Ecosystem and Ecological Function

The Spatial Distribution and Driving Factors of Carbon Storage in the Grassland Ecosystems of the Northern Tibetan Plateau

  • HUANGQING Dongzhi , 1, # ,
  • CHEN Xueying , 2, 3, # ,
  • SHI Mingming 1 ,
  • YANG Liusheng 1 ,
  • OU Baoxi 4 ,
  • YAN Duiming 1 ,
  • WANG Baolong 1 ,
  • GUO Xiaodong 1 ,
  • LI Zeyu 1 ,
  • SHI Peili , 2, 3, *
Expand
  • 1. Xining Natural Resources Comprehensive Survey Center, China Geological Survey, Xining 810000, China
  • 2. Institute of Geographic Sciences and Natural Resources Research, Chinese Academy of Sciences, Beijing 100101, China
  • 3. University of Chinese Academy of Sciences, Beijing 100190, China
  • 4. College of Eco-Environmental Engineering, Qinghai University, Xining 810016, China
*SHI Peili, E-mail:

HUANGQING Dongzhi, E-mail: ;

CHEN Xueying, E-mail:
The authors contributed equally to this work, and should be regarded as the co-first author.

Received date: 2023-02-03

  Accepted date: 2023-04-15

  Online published: 2023-08-02

Supported by

The Comprehensive Investigation and Potential Evaluation of Carbon Sink of Natural Resources in the Qinghai-Tibet Plateau(ZD20220134)

The Science and Technology Program of the Tibet Autonomous Region(XZ202101ZD0007G)

Abstract

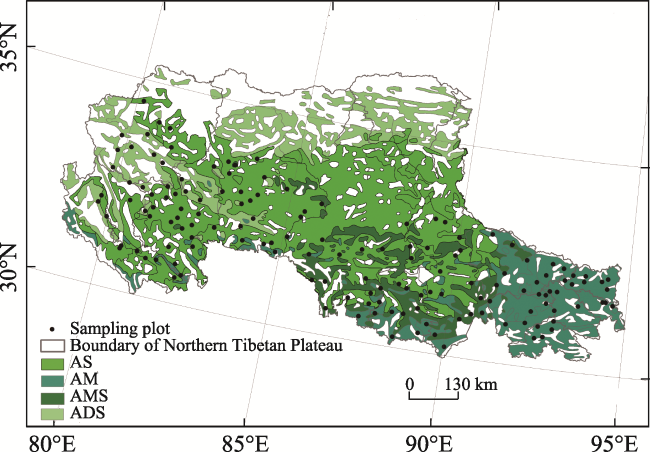
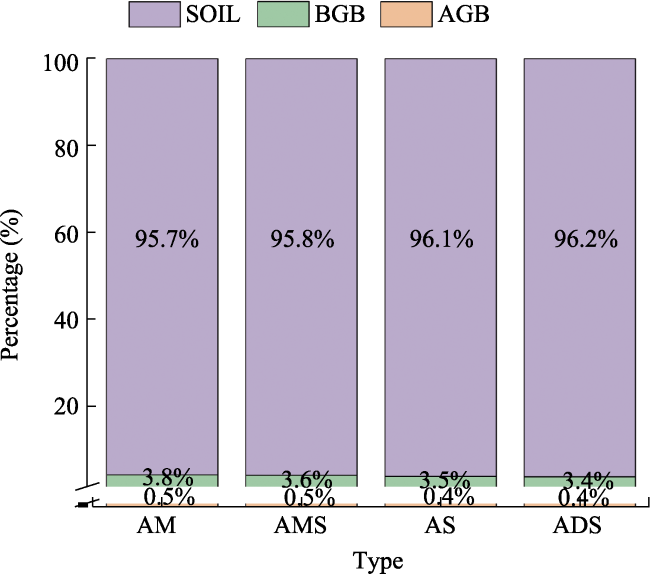
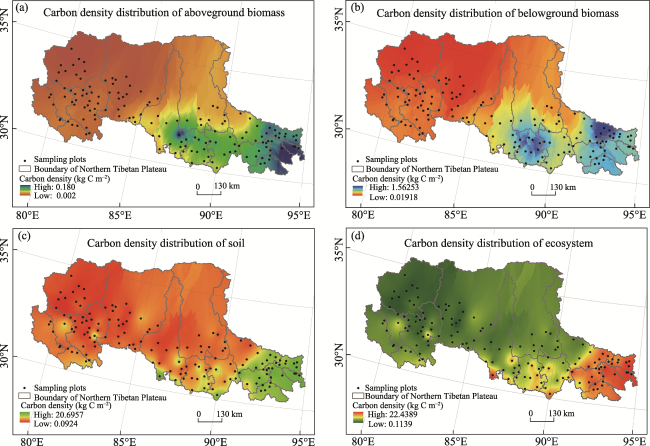
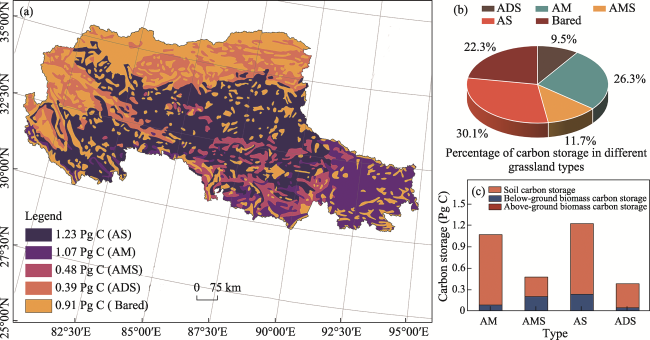
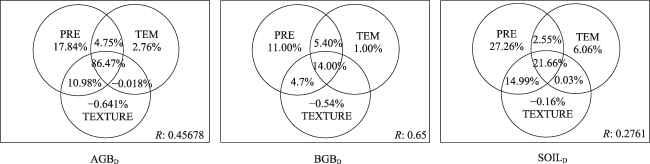
The investigation of carbon storage in ecosystems and its driving factors is crucial for understanding carbon cycling and achieving the goal of carbon neutrality. The grassland in the Northern Tibetan Plateau is an important grassland ecosystem in China, although the accurate estimation of its carbon stock and our knowledge of its spatial patterns and driving factors in the Northern Tibetan Plateau remain unclear due to insufficient field investigations. In this study, a dataset of 150 measured sample points on the Northern Tibetan Plateau, kriging interpolation and statistical methods were used to estimate the densities of aboveground biomass carbon, belowground root carbon and soil organic carbon at a soil depth of 30 cm, as well as to explore the spatial distribution and the main influencing factors of each carbon pool. The average carbon densities were 0.038 kg C m-2 in aboveground biomass, 0.284 kg C m-2 in belowground biomass, and 7.445 kg C m-2 in the soil. The soil organic carbon accounted for 95.85% of the grassland carbon density. The total carbon storage of the grassland ecosystem in the Northern Tibetan Plateau was about 4.08 Pg C, with a decreasing trend from southeast to northwest. Of the total, the organic carbon stocks of vegetation and soil were 0.58 Pg C (including the aboveground and belowground biomass) and 2.58 Pg C, accounting for 28.29% of the total vegetation carbon and 26.60% of the total soil carbon, respectively, on the Tibetan Plateau, with the remainder stored in the bare land. While the precipitation, temperature and soil texture all affected the ecosystem carbon storage, precipitation played the most significant role and the combination of these three factors explained up to 86.47% of the aboveground carbon density. The aboveground carbon pools in grassland ecosystems of the Northern Tibetan Plateau were most sensitive to climatic factors, while the spatial patterns of belowground and soil carbon storage were more complex. This study provides a spatially accurate assessment of the carbon storage in the grasslands on the Northern Tibetan Plateau.

Cite this article

HUANGQING Dongzhi , CHEN Xueying , SHI Mingming , YANG Liusheng , OU Baoxi , YAN Duiming , WANG Baolong , GUO Xiaodong , LI Zeyu , SHI Peili . The Spatial Distribution and Driving Factors of Carbon Storage in the Grassland Ecosystems of the Northern Tibetan Plateau[J]. Journal of Resources and Ecology, 2023 , 14(5) : 893 -902 . DOI: 10.5814/j.issn.1674-764x.2023.05.001

1 Introduction

As an important component of terrestrial ecosystems, grasslands cover about 40% of the global land surface (Yang et al., 2022). Grasslands have a very large carbon pool of about 520 Pg C, accounting for one-third of the global carbon storage of terrestrial ecosystems, and they are second only to forest ecosystems, so grasslands play an important role in the terrestrial carbon cycle (Scurlock and Hall, 1998; Schuman et al., 2002; Fang et al., 2007; Carvalhais et al., 2014). The ecosystem carbon pool consists of aboveground biomass, belowground biomass and soil. The aboveground biomass of grasslands accounts for about 36% of the total biomass of global vegetation (Bo et al., 2022), but it is vulnerable to climate change, land use and plant community composition, and shows great seasonal and interannual fluctuations (Ma et al., 2010; Liu et al., 2022). Belowground biomass is mainly composed of plant roots, so it is an important product of plant photosynthesis. Approximately 25% of the global grassland ecosystems have more than 80% of the total biomass distributed in the belowground portion (Mokany et al., 2006; Li, 2020), which is the basis for determining the carbon sink of the ecosystem (Hu et al., 2005). More importantly, the soil carbon pool is the largest carbon sink carrier. Its storage level exceeds the sum of carbon in the atmosphere and vegetation, so it is critical for maintaining carbon balance (Eswaran et al., 1993). Accurate estimations of regional carbon allocation and carbon storage are crucial for better understanding carbon cycling, and therefore it is very important to estimate the carbon source and sink of terrestrial ecosystems to meet the needs of carbon neutrality.
As the Third Pole of the world, the Qinghai-Tibetan Plateau covers an area of about 2.50×10⁶ km2, with alpine meadows and alpine steppes accounting for more than 60% of its area (Yang et al., 2009a). The Northern Tibetan Plateau, situated in the hinterland of the Qinghai-Tibetan Plateau, is sensitive to global changes, especially climate warming, due to its unique geographical environment (Li et al., 2011). Guo and Wang (2012) analyzed the data of 71 plateau meteorological stations in northern Tibetan, and found that the average plateau surface temperature rose at a rate of 0.28 ℃ every 10 years. That study also found that the northern plateau warming was the most significant in the whole plateau since 1961, while the warming in other regions was relatively weak (Guo and Wang, 2012). It also showed an asymmetric trend, in which winter warming was more obvious than summer warming (Zong and Shi, 2019). The response of the Northern Tibetan Plateau to global change will further affect the compositions of ecosystem communities (Klein et al., 2004), productivity (Klein et al., 2008), phenology (Dorji et al., 2013), and act on carbon storage. Enhancing the carbon storage of grasslands is currently considered to be one of the most effective and economic methods to offset anthropogenic CO2 emissions in China (Ma et al., 2016). However, as the main area of alpine grasslands, the status quo, spatial pattern and driving factors of carbon storage in the Northern Tibetan Plateau remain unclear due to insufficient field investigations (Yang et al., 2009b). In addition, the Northern Tibetan Plateau contains vast uninhabited areas with relatively few human activities, so it is an ideal place to study carbon storage and its influencing factors.
In this study, the densities of aboveground and belowground biomass carbon and soil organic carbon of the grassland ecosystem in the Northern Tibetan Plateau were determined based on 150 measured sample sites on the Northern Tibetan Plateau. The spatial distribution of carbon density was then extrapolated by the kriging interpolation method, and the total carbon storage of the entire Northern Tibetan Plateau was estimated. Combined with the climatic and soil texture data, the impacts of each factor on the aboveground, belowground, and soil carbon densities in the different grassland types were evaluated. The results of this study provide a spatially accurate assessment of the carbon storage of grasslands on the Northern Tibetan Plateau.
Fig. 1 Distribution of vegetation types and sampling sites on the Northern Tibetan Plateau

Note: AS: alpine steppe; AM: alpine meadow; AMS: alpine meadow steppe; ADS: alpine desert steppe. The same notations are used in subsequent figures.

2 Materials and methods

2.1 Study area

The study area is located in the northern Tibet Plateau, also called the Changtang Plateau, with an average altitude of more than 4500 m. Administratively, the Northern Tibetan Plateau includes the Ngari Prefecture and Nagqu Prefecture, with a land area of 69.02×10⁴ km2. The plateau surface is rugged, with valleys and basins that are widely and unevenly distributed (Li et al., 2011). The Northern Tibetan Plateau is characterized by a typical plateau continental cold and dry climate, with evaporation greater than precipitation, and very wide daily and annual temperature variations. The coldest and warmest temperatures are about -15 ℃ in January and less than 10 ℃ in July, respectively. The annual precipitation ranges from 100 mm to 600 mm, gradually decreasing from southeast to northwest (Zhao et al., 2017). The vegetation in the study area includes four grassland types, i.e., alpine meadow (AM), alpine meadow steppe (AMS), alpine steppe (AS) and alpine desert steppe (ADS) from east to west. Kobresia pygmaea and Stipa purpurea are the main dominant species in the eastern semi-humid alpine meadows, while Carex moorcroftii and Leontopodium nanum are the dominant species in the alpine steppes, and Stipa glareosa is the dominant species in the alpine desert steppes (Wang et al., 2016).

2.2 Sampling method and calculation of aboveground, belowground and soil carbon densities

Sampling was conducted during the period of vigorous vegetation growth in the Northern Tibetan Plateau from August to mid-September in 2020 and 2021. The 150 sampling points were relatively uniformly selected throughout the Northern Tibetan Plateau, except for the inaccessible no-man’s land, covering each representative grassland type and climatic region in the study area. Specifically, 48, 13, 71 and 18 sites were sampled in AM, AMS, AS and ADS, respectively. At each sampling site, three replicates of 50 cm×50 cm quadrats were delineated, and all aboveground parts of the plants were cut off from the ground, placed in an envelope, brought back to the laboratory, and dried to constant weight in an oven at 65 ℃ to determine the average aboveground biomass. In each quadrat, five diagonal drills with a diameter of 8 cm were used to obtain samples of belowground biomass and soil organic carbon. Soil and roots were sieved and separated with a 0.5 mm gauze. Roots were cleaned with water and oven-dried to determine root biomass. Soil samples were air-dried for the measurement of soil organic carbon content. Soil bulk density was measured using the ring knife method. Soil organic carbon, root biomass and soil bulk density were determined in each 10 cm soil layer down to the depth 30 cm. Carbon densities are calculated as follows:
$AG{{B}_{D}},BG{{B}_{D}}=biomass\times 0.45$
$SOI{{L}_{D}}=SOC\times BD\times h$
Among the variables, AGBD, BGBD and SOILD are aboveground biomass, belowground biomass and soil organic carbon content per unit area, respectively; biomass refers to the total amount of all plants in the sample square; SOC is soil organic carbon content; BD is soil bulk density; and h is soil depth. In view of the field survey, the sampling depths of all survey points could reach 30 cm. Therefore, soil carbon density and carbon storage were calculated to the soil depth of 30 cm in this study. Similarly, the root biomass and root carbon density were also calculated to 30 cm.

2.3 Data acquisition of climatic and soil texture features

The climatic data, including precipitation and temperature with a resolution of 500 m, were obtained from the relevant data of the China Meteorological Background Dataset (https://www.resdc.cn/Default.aspx). The soil texture data were obtained from the Resource and Environmental Science and Data Center, Institute of Geographic Science and Resources, Chinese Academy of Sciences. This dataset includes the contents of soil sand and clay (%) with a resolution of 1 km for all of China.

2.4 Statistics and mapping

The data were pre-processed in Excel to remove outliers. SPSS (SPSS Inc. Chicago, Illinois, USA) was used for data analysis, including the normal distribution test, one-way ANOVA and LSD multiple comparison analysis (α=0.05), to clarify the factors of climate and soil texture which influence the carbon density of grassland ecosystems on the Northern Tibetan Plateau. In the R language, the carbon densities of aboveground, roots and soil were taken as response variables, and annual average temperature, annual precipitation and soil texture were used as explanatory variables for Variance Partitioning Analysis (VPA). ArcGIS (Environmental Systems Research Institute, ESRI) software was used to make thematic maps, and Origin was used for mapping.

3 Results

3.1 Spatial distribution of carbon storage on the Northern Tibetan Plateau

3.1.1 Carbon density and distribution in different grassland types

The 150 sampling sites in the study area were statistically analyzed, and the results are shown in Table 1. Aboveground biomass carbon density (AGBD) ranged from 0.002 to 0.180 kg C m‒2, mostly concentrated around 0.024 kg C m‒2. Belowground biomass carbon density (BGBD) ranged from 0.019 to 1.563 kg C m‒2, with the majority of samples concentrated around 0.166 kg C m‒2. Soil carbon density (SOILD) ranged from 0.092 to 20.696 kg C m‒2, with the highest proportion of samples in the range of 2.5 to 3.75 kg C m‒2. Among them, the average AGBD was 0.038 kg C m‒2 and the average BGBD was 0.284 kg C m‒2, while the SOILD was the largest, averaging 7.445 kg C m‒2, or about 23 times the sum of AGBD and BGBD. To further analyze the carbon density distribution among the different grassland types, the organic carbon density data for AGBD, BGBD and SOILD of the four grasslands were statistically analyzed, and the results are shown in Table 2. The mean values of AGBD, BGDD and SOILD were all ranked as AM > AMS> AS >ADS. As shown in Fig. 2, among the four grassland types, the proportion of SOILD was the highest, while BGBD was about three times higher than AGBD.
Table 1 Descriptive statistics of aboveground, belowground and soil carbon densities (kg C m‒2) at the sampling points
Variable Sample count Mean SE Min Median Max
AGBD 150 0.038 0.036 0.002 0.024 0.180
BGBD 150 0.284 0.296 0.019 0.161 1.563
SOILD 150 7.445 5.713 0.092 4.942 20.696

Note: AGBD: aboveground carbon density; BGBD: belowground carbon density; SOILD: soil carbon density. The same notations are used in Table 2.

Table 2 Descriptive statistics of the aboveground, belowground and soil carbon densities of the different grassland types (kg C m‒2)
Grassland type CD Min Max Mean SE
AM AGBD 0.016 0.181 0.072 0.039
BGBD 0.083 1.563 0.535 0.341
SOILD 3.320 20.031 13.549 4.938
AMS AGBD 0.012 0.092 0.042 0.027
BGBD 0.093 1.056 0.290 0.290
SOILD 3.118 20.696 7.633 5.038
AS AGBD 0.002 0.080 0.019 0.016
BGBD 0.019 0.923 0.156 0.158
SOILD 0.092 16.243 4.289 2.542
ADS AGBD 0.004 0.031 0.012 0.007
BGBD 0.038 0.295 0.105 0.058
SOILD 1.304 6.661 2.957 1.751

Note: AM: alpine meadow; AMS: alpine meadow steppe; AS: alpine steppe; ADS: alpine dessert steppe; CD: carbon density.

Fig. 2 Proportions of the components of carbon density in the different types of grasslands

Note: SOIL, BGB and AGB represent the carbon densities in soil, belowground and aboveground biomass, respectively.

3.1.2 Spatial patterns of ecosystem carbon storage

Figure 3 shows that the AGBD, BGBD, SOILD and total ecosystem carbon density (CD) of the Northern Tibetan Plateau present overall decreasing trends from southeast to northwest. The total carbon storage of the grassland ecosystem in the Northern Tibetan Plateau also decreased from southeast to northwest (Fig. 4a). The total carbon storage in the study area was 4.08 Pg, with the highest proportion of carbon storage in AS at 1.23 Pg C (Fig. 4a), accounting for 30.1% (Fig. 4b). The second largest component was 1.07 Pg C in AM. The carbon storage in the bare land of the Northern Tibetan Plateau was in the third place; followed by AMS, and the carbon storage in ADS was 0.39 Pg C. All four types of grasslands had the largest carbon storage values in soil. Soil carbon storage was ranked as AS > AM > ADS > AMS. Belowground carbon storage was ranked as AS> AMS> AM > AMS and aboveground carbon storage had a very low proportion, in the order of AS > AM > AMS > ADS (Fig. 4c).
Fig. 3 Spatial distribution of carbon density in the different carbon pools of the Northern Tibetan Plateau grasslands
Fig. 4 Spatial patterns of carbon storage in the Northern Tibetan Plateau grasslands

3.2 Factors influencing carbon storage in the Northern Tibetan Plateau grasslands

3.2.1 Factors influencing SOC in the Northern Tibetan Plateau grasslands

(1) Climatic factors
Annual precipitation had highly significant effects (P<0.001) on AGBD and BGBD (Fig. 5a, 5b), but there was no significant effect (P>0.05) on SOILD in the Northern Tibetan Plateau grasslands (Fig. 5c). Aboveground, belowground, and soil carbon densities all increased exponentially with annual precipitation. Mean annual temperature had highly significant effects (P<0.001) on AGBD and BGBD (Fig. 5d, 5e), but no significant effect on soil carbon density (Fig. 5f). With an increase in temperature, the aboveground, belowground and soil carbon densities showed trends of increasing and then decreasing, and each of them arrived at peaks around 0 ℃. Climatic factors had significant effects on the regulation of aboveground and belowground biomass carbon densities, but had a little effect on soil carbon density.
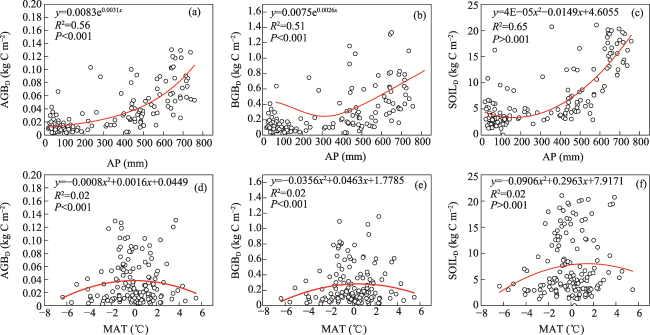
Fig. 5 The effects of climatic factors on carbon density in the aboveground biomass (a, d), belowground biomass (b, e) and soil (c, f)

Note: AP: annual precipitation; MAT: mean annual temperature. The abbreviations are same as in Fig. 1.

(2) Soil texture
The proportion of clay was mostly around 15%-30% in each of the samples, and as the clay increased, the aboveground, belowground, and soil carbon densities increased either exponentially or linearly (P<0.001) (Fig. 6a-6c). The proportion of soil sandy soil ranged from 40% to 60%, and as the proportion of sand increased, the aboveground, belowground, and soil carbon densities decreased linearly, exponentially, and linearly, respectively, and the sand proportion had highly significant effects on the aboveground, belowground, and soil carbon densities (P<0.001) (Fig. 6d-6f). Soil carbon density had the highest correlations with the soil clay and sand proportions, compared to AGBD and BGBD (R2=0.13, R2=0.26, repectively).
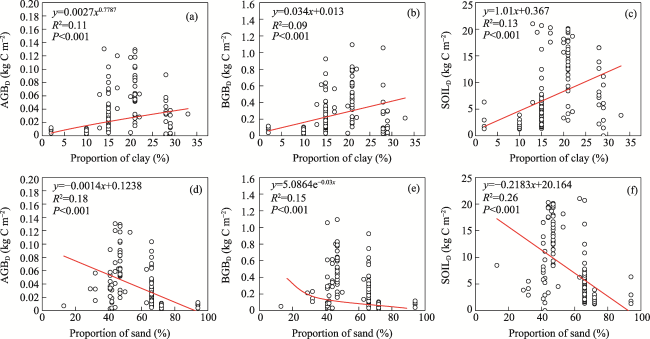
Fig. 6 The effects of soil texture composition on the different components of the carbon density

3.2.2 Factors influencing carbon storage in different types of grasslands

(1) Climatic factors
The responses of carbon densities of the different grassland types to climatic factors were not consistent. The annual precipitation had a highly significant effect (P<0.001) on AGBD in AS, significant effects (P<0.05) on AGBD in AM and AMS, and a marginal effect (P=0.051) on AGBD in ADS (Fig. 7a). There were significant effects (P<0.05) on BGBD in AS and AM, but not in AMS or ADS (Fig. 7b). In contrast, there were no significant correlations between annual precipitation and soil carbon density in any of the four types of grasslands (Fig. 7c). The aboveground, belowground, and soil carbon densities did not respond significantly to mean annual temperature in any of the four grassland types, and only AM soil carbon density showed a weakly significant (P<0.05) correlation to temperature (Fig. 7d-7f).
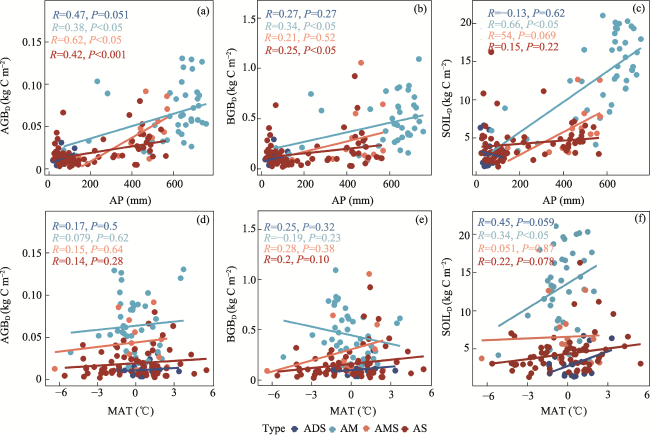
Fig. 7 Relationships between climatic factors and carbon densities in the different types of grasslands
(2) Soil texture
The aboveground, belowground, and soil carbon densities of the four grassland types increased as the proportion of soil clay increased, but decreased with an increasing proportion of sand. AGBD and BGBD did not show significant positive or negative correlations with the proportions of clay or sand in the four grassland types (Fig. 8a, 8b, 8d, 8e). The soil carbon density of AS showed a significant positive correlation with the clay ratio (P<0.05) (Fig. 8c), and the soil carbon density of AMS showed significant positive and negative correlations with the clay ratio and sand ratio, respectively (P<0.05) (Fig. 8c, 8f).
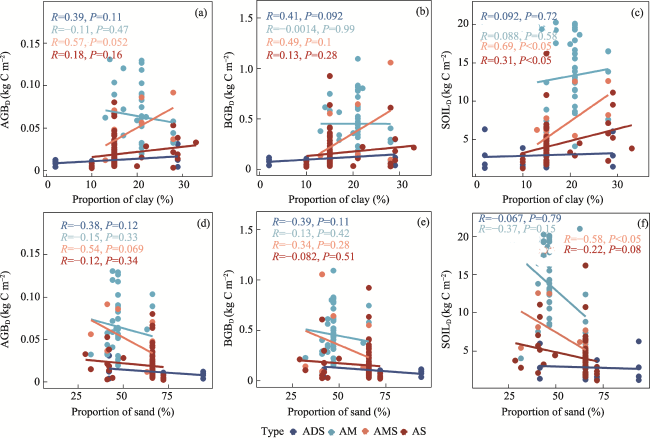
Fig. 8 Relationships between carbon density and soil texture in the different types of grassland

4 Discussion

In this study, the total carbon storage in the grassland ecosystem of the Northern Tibetan Plateau was estimated to be about 4.08 Pg C, including 0.58 Pg C in the vegetation carbon pool (including aboveground and belowground biomass carbon), 2.58 Pg C in the soil carbon pool, and the remainder stored in the bare land. Several recent studies have estimated carbon storage on the Tibetan Plateau mainly through field surveys, remote sensing estimation, and model simulation (Yang et al., 2009b; Liu and Liu, 2014). However, those estimation results still have great variability due to different sampling times, different areas, different calculation methods, and different models. For example, Yang et al. (2022) used field investigation integrated with remote sensing extrapolation to estimate an amount of 4.4 Pg C in SOC stock in the top 30 cm layer on the Qinghai Tibetan Plateau (112.82×10⁴ km2 of grassland). Converting that figure by area, the northern Tibetan Plateau portion would be equivalent to 2.69 Pg C, which is very close to our estimate of 2.58 Pg C in the grassland area of 69.02×10⁴ km2, but it is a little lower than the soil organic carbon including the soil carbon in the non-vegetated area, i.e., 0.92 Pg C. Zhang et al. (2016) simulated the spatial and temporal variation characteristics of vegetation carbon, soil organic carbon storage and carbon density in the Chinese grassland ecosystem from 1961 to 2013 based on a terrestrial ecosystem model (TEM) (Zhang et al., 2016). Zhang et al. (2007) used the Century model combined with the second national soil census data, and estimated that the vegetation carbon pool of the Qinghai-Tibet Plateau was 2.05 Pg C and the soil carbon pool of the grassland was 9.7 Pg C. As a comparison, the vegetation carbon pool of the Northern Tibetan Plateau accounted for about 28.29% of the total for the whole Tibetan Plateau and the soil carbon pool accounted for 26.60% of the total. In this study, the kriging interpolation method was used to extrapolate the profile information of the sample sites to the regional scale, which helped to reduce the effect of soil spatial heterogeneity (Fang et al., 2010). The Northern Tibetan plateau is mainly divided into four grassland types, with higher carbon storage in AM and AS, and lower carbon storage in AMS and ADS. From the perspective of carbon density, although the AS had the largest carbon storage amount because of its larger distribution area, its carbon density was lower than those of AM and AMS.
Fig. 9 Variance Partitioning Analysis of the contributions of precipitation (PRE), temperature (TEM) and soil texture (TEXTURE) on the different components of carbon density
Many studies have shown that carbon storage in grassland ecosystems is influenced by changes in climatic factors (Fang et al., 2001; Zhang et al., 2020; Cao et al., 2022). Precipitation affects carbon storage by influencing vegetation growth and soil water content, and by changing the soil respiration rate and carbon input from litter to soil (Zhang et al., 2016); while temperature changes mainly affect the photosynthesis of plants and microbial activity, which affect carbon storage. Precipitation is directly responsible for the formation of the different grassland types in the Northern Tibetan plateau, so annual precipitation had a significantly positive correlation with both aboveground and belowground biomass carbon densities of vegetation, but no significant effect on soil carbon density. Furthermore, the aboveground and belowground biomass carbon densities increased exponentially and rapidly when the annual precipitation was greater than 500 mm, which is largely related to its limiting effect on vegetation activity in arid and semi-arid environments (Jobbagy et al., 2002). In terms of the different species of grassland types, the significant responses of aboveground and belowground biomass carbon densities to year-round precipitation were inconsistent among the four types of grasslands, with AM and AS showing greater significance, which may be related to the differences in plant and biogeochemical limitations of the different grassland types leading to differences in their water use efficiency (Huxman et al., 2004). In this study, the aboveground and belowground biomass carbon densities also showed highly significant responses to mean annual temperature, but the changes in mean annual temperature were not significant for any of the four types of grasslands. Yang et al. (2010) analyzed aboveground and belowground biomass of different grasslands from the arid and semi-arid temperate grasslands of the Qinghai-Tibet Plateau in northern China, and found that neither of them showed a significant trend in the temperature gradient, which was different from the results of this study.
The aboveground, belowground, and soil carbon densities increased with an increasing proportion of clay and a decreasing proportion of sand in the soil on the Tibetan Plateau, which is consistent in consistent with the results of Yang et al. (2009b) in Tibetan grasslands and Li et al. (2021) in loess plateau ecosystems. All these results are consistent with the inverse texture hypothesis, i.e., that more carbon can be stored in fine-texture soils with higher water-holding capacity (Noy-Meir, 1973; Yang et al., 2009b; Li et al., 2021). Soil carbon density increases when the soil particles are dominated by clays with smaller particle sizes, which have a larger surface area and are more likely to form soil aggregates, which slows the decomposition of organic matter. In the significance analysis, soil carbon density had strong significant relationships with soil clay proportion and sand proportion, indicating that climatic factors only play a moderating role in soil carbon density, and soil texture is the fundamental factor influencing soil carbon density.
The Variance Partitioning Analysis (VPA) demonstrated that temperature explained 2.76% of aboveground biomass carbon density, 1.00% of belowground biomass carbon density, and 6.06% of soil carbon density, while the soil texture explained very little. The combination of precipitation and soil texture could explain 10.98%, 4.70%, and 14.99% of the aboveground, belowground, and soil carbon densities, respectively. The combination of precipitation, temperature and soil texture explained 86.47% of aboveground biomass carbon density. Taken together, the role of precipitation is the most important, and the aboveground carbon pool of the grassland ecosystem in the Northern Tibetan Plateau is most susceptible to mediation by climatic factors. Compared with aboveground biomass carbon density, VPA explained less of the belowground biomass carbon density and soil carbon density. Since 80% of the biomass in grassland ecosystems is distributed belowground and root turnover is longer, the mechanisms driving the spatial patterns of the belowground and soil carbon stocks might be more complex.

5 Conclusions

In this study, we assessed the carbon storage and spatial distribution of the carbon pool in the grasslands on the Northern Tibetan Plateau, and analyzed the main influencing factors. The main conclusions are threefold.
(1) The average carbon densities were 0.038 kg C m‒2 in aboveground biomass, 0.284 kg C m‒2 in belowground biomass, and 7.445 kg C m‒2 in soil.
(2) The total carbon storage of the grassland ecosystem in the Northern Tibetan Plateau was calculated to be about 4.08 Pg C, showing a decreasing trend from southeast to northwest. Of the total, the organic carbon stocks of vegetation and soil were 0.58 Pg C (including aboveground and belowground biomass) and 2.58 Pg C, accounting for 28.29% of the total vegetation carbon and 26.60% of the total soil carbon, respectively, with the remainder stored in the bare land.
(3) Precipitation, temperature and soil texture all affected ecosystem carbon storage. Precipitation played the most significant role, and the combination of these three factors explained up to 86.47% of the aboveground carbon density. Aboveground carbon pools in grassland ecosystems of the Northern Tibetan Plateau were found to be the most sensitive to climatic factors, while the spatial patterns of belowground and soil carbon storage were more complex.
[1]
Bo L X, Lai Q, Liu X Y. 2022. Adaptation of different machine learning algorithms for grassland biomass estimation. Acta Agrestia Sinica, 30(11): 3156-3164. (in Chinese)

[2]
Cao Y N, Sun M X, Chen M R, et al. 2022. Effects of precipitation on the vegetation coverage in Northern Tibetan Plateau from 2000 to 2016. Acta Agrestia Sinica, 30(3): 721-730. (in Chinese)

[3]
Carvalhais N, Forkel M, Khomik M, et al. 2014. Global covariation of carbon turnover times with climate in terrestrial ecosystems. Nature, 514(7521): 213-217.

[4]
Dorji T, Totland O, Moe S R, et al. 2013. Plant functional traits mediate reproductive phenology and success in response to experimental warming and snow addition in Tibet. Global Change Biology, 19(2): 459-472.

[5]
Eswaran H, Berg E V D, Reich P, et al. 1993. Organic carbon in soils of the world. Soil Science Society of America Journal, 57(1): 192-194.

[6]
Fang J Y, Guo Z D, Piao S L, et al. 2007. Estimation of terrestrial vegetation carbon sinks in China from 1981 to 2000. Scientia Sinica (Terrae), 37(6): 804-812. (in Chinese)

[7]
Fang J Y, Piao S L, Tang Z Y, et al. 2001. Inter-annual variability in net primary production and precipitation. Science, 293(5536): 1723-1723.

[8]
Fang J Y, Yang Y H, Ma W H, et al. 2010. Carbon pools and changes in grassland ecosystems in China. Scientia Sinica Vitae, 40(7): 566-576. (in Chinese)

[9]
Guo D L, Wang H J. 2012. The significant climate warming in the Northern Tibetan Plateau and its possible causes. International Journal of Climatology, 32(12): 1775-1781.

[10]
Hu Z M, Fan J W, Zhong H P, et al. 2005. Progress on grassland underground biomass researches in China. Chinese Journal of Ecology, 24(9): 1095-1101. (in Chinese)

[11]
Huxman T E, Smith M D, Fay P A, et al. 2004. Convergence across biomes to a common rain-use efficiency. Nature, 429(6992): 651-654.

[12]
Jobbagy E G, Sala O E, Paruelo J M. 2002. Patterns and controls of primary production in the Patagonian steppe: A remote sensing approach. Ecology, 83(2): 307-319.

[13]
Klein J A, Harte J, Zhao X Q. 2004. Experimental warming causes large and rapid species loss, dampened by simulated grazing, on the Tibetan Plateau. Ecology Letters, 7(12): 1170-1179.

[14]
Klein J A, Harte J, Zhao X Q. 2008. Decline in medicinal and forage species with warming is mediated by plant traits on the Tibetan Plateau. Ecosystems, 11(5): 775-789.

[15]
Li M Y, Shangguan Z P, Deng L. 2021. Spatial distribution of carbon storages in the terrestrial ecosystems and its influencing factors on the Loess Plateau. Acta Ecologica Sinica, 41(17): 6786-6799. (in Chinese)

[16]
Li X J, Zhang X Z, Wu J S, et al. 2011. Root biomass distribution in alpine ecosystems of the Northern Tibetan Plateau. Environmental Earth Sciences, 64(7): 1911-1919.

[17]
Li Z. 2020. Effects of precipitation change on plant belowground biomass and its underlying mechanisms. Diss., Shanghai, China: East China Normal University. (in Chinese)

[18]
Liu C, Li P, Wu Y T, et al. 2022. Estimation of grassland aboveground biomass using digital photograph and canopy structure measurements. Chinese Journal of Plant Ecology, 46: 1-9. (in Chinese)

[19]
Liu M, Liu G H. 2014. Impact factors and uncertainties of the estimation on soil organic carbon storage. Ecology and Environmental Sciences, 23(7): 1222-1232. (in Chinese)

[20]
Ma A, He N P, Yu G R, et al. 2016. Carbon storage in Chinese grassland ecosystems: Influence of different integrative methods. Scientific Reports, 6(1): 21378. DOI: 10.1038/srep21378.

[21]
Ma W H, Fang J Y, Yang Y H, et al. 2010. Biomass carbon stocks and their changes in northern China’s grasslands during 1982-2006. Science China-Life Sciences, 53(7): 841-850.

[22]
Mokany K, Raison R J, Prokushkin A S. 2006. Critical analysis of root: Shoot ratios in terrestrial biomes. Global Change Biology, 12(1): 84-96.

[23]
Noy-Meir I. 1973. Desert ecosystems: Environment and producers. Annual Review of Ecology and Systematics, 4(1): 25-51.

[24]
Schuman G E, Janzen H H, Herrick J E. 2002. Soil carbon dynamics and potential carbon sequestration by rangelands. Environmental Pollution, 116(3): 391-396.

[25]
Scurlock J M O, Hall D O. 1998. The global carbon sink: A grassland perspective. Global Change Biology, 4(2): 229-233.

[26]
Wang J S, Yao S C, Pu Q, et al. 2016. Quantitative classification and ordination of grassland communities on the Northern Tibetan Plateau. Acta Ecologica Sinica, 36(21): 6889-6896. (in Chinese)

[27]
Yang Y H, Fang J Y, Ji C J, et al. 2009a. Above- and belowground biomass allocation in Tibetan grasslands. Journal of Vegetation Science, 20(1): 177-184.

[28]
Yang Y H, Fang J Y, Ma W H, et al. 2010. Large-scale pattern of biomass partitioning across China’s grasslands. Global Ecology and Biogeography, 19(2): 268-277.

[29]
Yang Y H, Fang J Y, Pan Y D, et al. 2009b. Above ground biomass in Tibetan grasslands. Journal of Arid Environments, 73(1): 91-95.

[30]
Yang Y H, Zhang D Y, Wei B, et al. 2022. Nonlinear responses of community diversity, carbon and nitrogen cycles of grassland ecosystems to external nitrogen input. Chinese Journal of Plant Ecology, 47(1): 1-24. (in Chinese)

[31]
Zhang J Y, Liu Y X, Luo Y Y, et al. 2020. Temporal and spatial distribution of aboveground biomass of vegetation and quantitative analysis of impact factors in semi-arid grassland basin. Chinese Journal of Ecology, 39(2): 364-375. (in Chinese)

[32]
Zhang L, Zhou G S, Ji Y H, et al. 2016. Simulation of spatial and temporal carbon stock dynamics in Chinese grasslands. China Science: Earth Science, 46(10): 1392-1405. (in Chinese)

[33]
Zhang Y Q, Tang Y H, Jiang J, et al. 2007. Characterizing the dynamics of soil organic carbon in grasslands on the Qinghai-Tibetan Plateau. Science in China Series D-Earth Sciences, 50(1): 113-120.

[34]
Zhao G S, Shi P L, Wu J S, et al. 2017. Foliar nutrient resorption patterns of four functional plants along a precipitation gradient on the Tibetan Changtang Plateau. Ecology and Evolution, 7(18): 7201-7212.

[35]
Zong N, Shi P L. 2019. Effects of simulated warming on soil nitrogen supply potential in an alpine meadow on the Tibetan Plateau. Acta Ecologica Sinica, 39(12): 4356-4365. (in Chinese)

Outlines

/