Resource Economy

Contribution of Medicinal and Aromatic Plants on Gross Domestic Product in Karnali Province, Nepal

  • Kamal Raj ARYAL , 1 ,
  • Anup GURUNG 2 ,
  • Prabin PAUDEL , 3, * ,
  • Rajendra Kumar BASUKALA 1 ,
  • Shiva PARIYAR 4 ,
  • Arjun THAPA 5 ,
  • Hikmat Kumar SHAHI 1 ,
  • Ganga SHAH 6 ,
  • Saroj PANTHI , 3, *
Expand
  • 1. Forest Research and Training Center, Karnali Province, Surkhet 21700, Nepal
  • 2. Department of Biological Environment, Kangwon National University, Chuncheon, Gangwondo 24341, Republic of Korea
  • 3. Ministry of Industry, Tourism, Forests and Environment, Gandaki Province, Pokhara 33700, Nepal
  • 4. Forest Directorate, Gandaki Province, Pokhara 33700, Nepal
  • 5. Small Mammal Conservation and Research Foundation Balkhu, Kathmandu 44618, Nepal
  • 6. Mid-Western University, Surkhet 21700, Nepal 7. New Zealand School of Forestry, University of Canterbury, Private Bag 4800, 8041 Christchurch, New Zealand.
*Prabin PAUDEL, E-mail: ;
Saroj PANTHI, E-mail:

Kamal Raj ARYAL, E-mail:

Received date: 2022-05-22

  Accepted date: 2022-12-10

  Online published: 2023-08-02

Abstract

Medicinal and aromatic plants (MAPs) have been grown and used extensively for health care and healing practices since time immemorial in Nepal. They possess cultural, religious and economic values in Nepalese communities. In recent years, the MAPs sector is a growing commercial sector in Nepal that provides livelihood opportunities for low income generating people especially in the Himalayas. In this regard, this study assesses the contribution of MAPs to the gross domestic product (GDP) of Karnali Province of Nepal. A total of 58 species of MAPs were identified in Karnali Province. It was found that various parts of these annuals, biennials and perennial plants have been used as medicines, perfumes and food. MAPs in Karnali Province generated economic output equivalent to NPR 160738 million (USD 1.39 billion) or 1.03% of GDP of Karnali Province and 0.02% of the National GDP in the fiscal year 2019/2020. However, the findings revealed that the current GDP estimate undervalues the contribution of the MAPs sector to the national GDP due to the non-inclusion of ethnobotanical uses of medicinal plants. Moreover, if all cash and environmental benefits people derive from this sector could be valued and recorded in the System of National Accounts, the GDP from MAPs would be much higher than the amount estimated in this study. We conclude that MAPs have a reasonable contribution to the GDP of Karnali Province and Nepal.

Cite this article

Kamal Raj ARYAL , Anup GURUNG , Prabin PAUDEL , Rajendra Kumar BASUKALA , Shiva PARIYAR , Arjun THAPA , Hikmat Kumar SHAHI , Ganga SHAH , Saroj PANTHI . Contribution of Medicinal and Aromatic Plants on Gross Domestic Product in Karnali Province, Nepal[J]. Journal of Resources and Ecology, 2023 , 14(5) : 1104 -1112 . DOI: 10.5814/j.issn.1674-764x.2023.05.021

1 Introduction

Forests are identified as key landscape elements that provide fundamental protection of soil and water resources (Langat et al., 2016). Millions of people around the world rely on forest resources as it provides multiple goods, ecosystem services as well as cultural or spiritual values and to diversify their source of income (Teischinger, 2009; Miura et al., 2015). In developing countries, forest plays a key role in human livelihoods as people depend on forest resources for food, fuel wood, fodder, medicine, timber and construction materials (Sunderlin et al., 2005; Teischinger, 2009; Miura et al., 2015; Barata et al., 2016; Langat et al., 2016). The economic and social contribution of the forestry sector to any nation are important aspects of sustainable forest management and many countries are seeking to increase the socio-economic benefits delivered by this sector (Guleria et al., 2014).
After water resources, forest is the second largest natural resource of Nepal (Ranjit, 2011). According to the Department of Forest Research and Survey (DFRS), forest covers 40.36% (5.96 million ha) of the total geographic area of Nepal while other wooded lands cover 4.38% (0.65 million ha) (DFRS, 2015). Therefore, forest could play a pivotal role in the process of economic growth and development of the country (Ranjit, 2011). Because of unique geographical locations and climatic diversities, the forest types of Nepal are highly variable (Gurung and Pyakurel, 2017; Kalauni and Joshi, 2018). Medicinal and Aromatic Plants (MAPs), a sub-sector of forest plays an important role in supporting livelihoods in the Himalayan countries like Nepal (Kala, 2004; Gurung and Pyakurel, 2017). In Nepal, still approximately 80% of the populations reside in rural areas and thus, these rural people especially those living in the hills and mountains areas rely on MAPs to generate income and diversify their livelihoods (Olsen and Larsen, 2003; Gurung and Pyakurel, 2017). The use of MAPs in Nepal is quite ancient as it is used to cure various ailments and diseases since time immemorial (Gurung and Pyakurel, 2017; Pyakurel et al., 2017; Ratna, 2020). In one way or other, many of these plants have been an integral part of Nepalese health and livelihood systems in rural areas due to remoteness, inadequate land for agricultural and limited livelihood diversification opportunities (Poudel, 2007; Gurung and Pyakurel, 2017; Pyakurel et al., 2017; Sah et al., 2020).
It is believed that most of the plant species distributed in the Himalayan region have medicinal value (Sah et al., 2020). In this regard, Nepal is very rich in medicinal plants in high elevated forest and range land (Olsen and Larsen, 2003). Nepal is well known for its diversity of forest products, and the rural communities heavily relied on the plant diversity for the fulfillment of their basic needs and utilize them; especially MAPs, according to their traditional knowledge and practice (Joshi et al, 2011; Ratna, 2020). Pandey (1961) reported 73 MAPs for the first time in Nepal. Subsequently, many studies were conducted and reported different numbers of MAPs; Department of Medicinal Plants (DMP) (1970) reported 483 species, Malla and Shakya (1984) reported 690 species of MAPs in Nepal.
Before 1988, MAPs were termed as minor forest products and the sector of MAPs remained vastly unexplored and underutilized in the country (Kalauni and Joshi, 2018). After implementation of the master plan for forestry sector in Nepal, in 1988, both biologically and economically high valued MAPs were recognized as an important commercial forest products (Kalauni and Joshi, 2018). Since then, recording of trade for MAPs started in Nepal. In recent years, Nepal is becoming a major supplier of MAPs (especially raw materials) to the medicinal plant industries in China and India (Pyakurel et al., 2019). According to Olsen (2005), the annual export of MAPs has been estimated between 7000 and 27000 t at a value of USD 11 million to 48 million (Caporale et al., 2020). Likewise, several studies have been conducted to quantify the traded MAPs at district level in Nepal (Ranjit, 2011; Rai et al., 2016; Pyakurel et al., 2017; Sah et al., 2020). The comprehensive district level trade studies revealed that MAPs sales have surpassed the annual district budget (Pouliot et al., 2018; Caporale et al., 2020).
Karnali Province is famous for forest resources; specially MAPs (Pouliot et al., 2018; Sah et al., 2020). In this province, collection of MAPs, especially herbs is an old practice to augment their sources of income as it provides livelihood opportunities for many people (Acharya et al., 2015; Gurung and Pyakurel, 2017; Pouliot et al., 2018; Sah et al., 2020). In addition, most of the people rely on medicinal plants for their basic primary health care since they have limited access to modern medical facilities and services (Gurung and Pyakurel, 2017; Pyakurel et al., 2017). Although thousands of people are getting benefits from MAPs, there is no authentic and reliable record of employment generation and income creation from it in Karnali Province. In addition, no detail study has been conducted regarding the contribution of the MAPs to the gross domestic product (GDP) of Karnali Province. Consequently, the contribution of MAPs sectors has always been undervalued and has been less prioritized during the formulation of annual as well as periodic plans of the central and provincial government. In this scenario, study which can illustrate the real contribution of MAPs in GDP is essential. Hence, this study quantifies the contribution of MAPs in the GDP of Karnali Province. This study will make easier for the researchers, policy makers and authorities for the promotion, sustainable harvesting, value addition, and marketing of MAPs. As a result, sustainable management of these high value plants may improve the standards of the natural resources dependent underprivileged communities in the province by providing more income generating opportunities.

2 Materials and methods

2.1 Study area

This study was conducted throughout the Karnali Province. Karnali Province is situated in the north-western part of Nepal and covering 10 districts: Western Rukum, Salyan, Dolpa, Humla, Jumla, Kalikot, Mugu, Surkhet, Dailekh, and Jajarkot (Fig. 1). The total area of this province is 27984 km2. According to the population census 2021, the total population of this province is 1694889 (CBS, 2021a). Raji and Raute communities are indigenous to the Karnali Province. Rajis are found in Surkhet in a small number (n=1271) (CBS, 2012). This province is rich in biodiversity which provides habitat for large number of birds, mammals, reptiles and plants (Acharya and Paudel, 2020). A total of 89 mammalian species present in Karnali Province, 10% of them are globally threatened. Karnali Province is a prime habitat of more than 400 medicinal and aromatic plants, where Dolpa District alone shares 57% (n=400) of Nepal’s MAPs (Lama et al., 2001). People living in high-altitude use the ancient system of healing for various ailments. Amchi is one of the widely practiced systems of Nepal and involves extensive use of locally available herbs for curing human and animal diseases (Bauer, 2004).
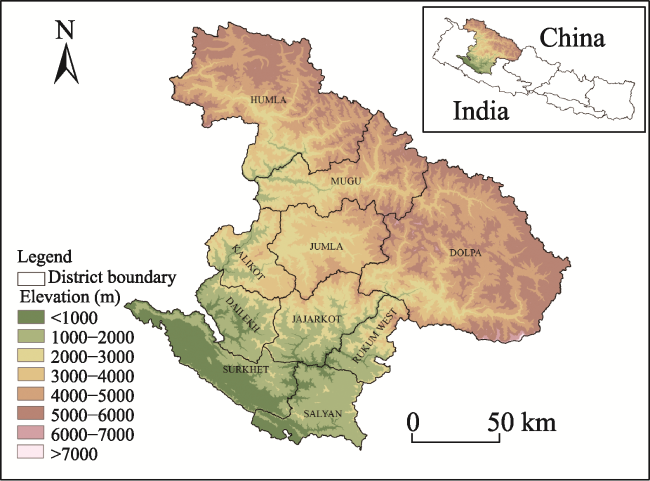
Fig. 1 Map of Karnali Province
The economic profile of Karnali reveals the lowest economic performance compared to other provinces, which accounts only about for 4% of national GDP (KPPC, 2020). The agriculture, forestry, and fishery sector contributes 33% GDP of Nepal (CBS, 2021b). Study about royalty and trade volume of NTFP suggest that Karnali Province alone shares nearly 40% of national trade volume and two-third of the royalty (Acharya and Paudel, 2020).
More than half the province’s land surface (51%) is covered with vegetation, which includes forest (30%), shrubland (3%), and grassland (18%) (Uddin et al., 2015; Acharya and Paudel, 2020). In the upper parts of the province most of the area is covered by snow/glaciers and bare areas. Agriculture lands and broadleaved forests cover the lower part and needle-leaved forests occupy the middle parts of the province (Fig. 2) (Uddin et al., 2015).
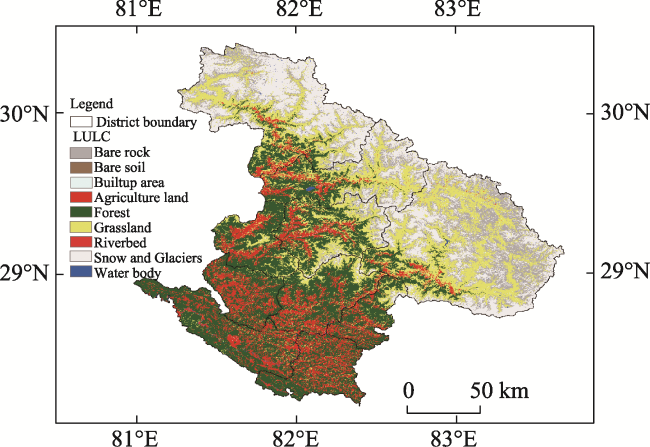
Fig. 2 Land cover map of Karnali Province

Note: Source: ICIMOD, Uddin et al., 2015.

2.2 Methodological framework

Gross Domestic Product (GDP) is a good indicator to measure economic health of a country. It can be calculated using three different types such as Expenditure Approach, Income Approach and Production Approach (Callen, 2008). Expenditure approach involves measurement of expenditure by household, business and the government while the income approach calculates total income generated by goods and services. In contrast to expenditure approach, Production Approach encompasses the added value at the time of production. It is also known as Value Added Approach and estimates the Gross Value Added (GVA) total cost of economic output after its reduction by the cost of intermediate goods used to produce final goods.
The concept of “value added” was used as the principal economic indicator in this study. Gross Value Added is a measure of the contribution to GDP made by an individual producer, industry, or sector. It is an economic measure of the value of goods and services produced in an area or a sector of an economy. In a sector, GVA is defined as the value of output less the value of intermediate consumption. GVA in a sector is calculated using Eq. (1).
GVA=SG–PIG
where, GVA (Gross Value Added) is the sum of values added by all enterprises; SG is sales of goods; PIG is purchase of intermediate goods used to produce the goods.
To enable calculations to be made along the value chain, two GVA terms are defined: The gross value added in MAPs sub-sector (termed MAPs GVA hereafter) and the gross value added in the primary forest products manufacturing sub-sector (termed MGVA hereafter), which is the sum of the gross value added from the MAPs.
GVA = MAPs GVA + MGVA
Or
GVA = MAPs GVA + EMMGVA
where, GVA is gross value added, MAPs is medicinal and aromatic plants, MGVA is Manufacturing Gross Value Added and EMMGVA is Ethno-medicine (medicines made from MAPs) Manufacturing Gross Value Added.
The data on the production and prices of MAPs and medicines made by MAPs were based on the data recorded by the Divisional Forests Offices (DFOs) and offices of the Protected Areas (PAs). But due to the Covid-19 pandemic, MAPs were not collected from Shey-Phoksundo National Park during the fiscal year 2019/2020. Therefore, only the record of DFOs were analyzed. Data related to the royalty and market price (in monetary terms) were collected from the DFO offices and persons and firms who are authorized to collect and export the MAPs from the forests. Where, relevant division forest offices create a yearly database of NTFPs produced within their jurisdiction. Hence, we represent the MAPs from the forest sector as:
$GVA = QMAPs×PMAPs + QEM×PEM $
where, GVA is gross value added, QMAPs is quantity of medicinal and aromatic plants, PMAPs is price of medicinal and aromatic plants, QEM is quantity of ethno-medicine and PEM is price of ethno-medicine
Finally, the value of the final products and the intermediate goods were both estimated at prevailing market price, or at the royalty rates. These values were further compared with total provincial and national GDP in corresponding fiscal year and estimated contribution in percentage form.

2.3 Data sources

For data collection, we consulted with all stakeholders’ groups that are directly or indirectly related to MAPs sectors in the province. It involves government officials representing Provincial Forest Ministry, Forest Directorate, and Forest Research and Training Center (n = 12), officials from division forest offices (n = 10), executive members of Federation of Community Forestry User Network (n = 10), members of Conservation Area Management Committee (n = 3), entrepreneurs from MAPs based industries (n = 10), MAPs traders and collectors (n = 30, 3 traders from each districts selected purposively).
The data about the MAPs and ethnomedicine were collected from 10 DFOs of Karnali Province. Round year data of fiscal year 2019/2020 were collected, where Nepali fiscal year starts in the mid of July. Whenever necessary, the primary data were supplemented with the secondary data available online through websites of division forest offices, provincial ministries, department of forests and soil conservation and NTFPs related non-governmental organizations such as Jadibuti Association of Nepal and Asia Network for Sustainable Agriculture and Bioresources. The values of the final product and the intermediate goods were estimated at prevailing market price or royalty rates. Due to unavailability of official data, we have used market rate for this study. Market rate of NTFPs were collected from at least three traders of each district. Furthermore, at least three local collectors and farmers from each district were also asked to verify the price paid by the traders. Then, the average market rate of NTFPs paid by local traders to the farmer were calculated. Forest regulation 1995 was also used to assess market rate for those species with no distinct market rate. These rates were further validated with the validated with the monthly price lists of Kathmandu and Nepalgunj as published by the Asia Network for Sustainable Agriculture and Bioresources.

2.4 Data analysis

We employed quantitative research tools for undertaking this study. Collected data were further collated and entered in MS- Excel 2016. These were further analyzed using Eq. (4) and calculated in terms of descriptive statistics as sum and percentage. Finally, these results were presented in tabular forms.

3 Results

3.1 Quantity and rate of MAPs

For this purpose, quantity of MAPs was collected from DFOs (Dailekh, Dolpa, Humla, Jajarkot, Jumla, Kalikot, Mugu, Salyan, Surkhet, and West Rukum) of Karnali Province. Export permissions issued by DFOs were analyzed to identify the quantity of the MAPs collected from Karnali Province. In this study, a total of 58 MAP species were recorded in Karnali Province. Local market rate of MAPs varies from district to district and place to place within the province, therefore, the local traders helped to identify local rates of MAPs. Some species were out of interest of the traders, and hence, were not aware of the prices of these species. For such kind of species, local market rates were determined by assuming 20 times more than the government royalty rate of that particular species presented in Table 1 (MOFSC, 1995).
Table 1 Local market rate and royalty rate of MAPs of Karnali Province
S.N. Vernacular name of species Scientific name Local market rate (NPR kg-1) Sources of market rate Royalty rate (NPR kg-1)
1 Allo Girardinia diversifolia 100 Local traders 5
2 Amala Phyllanthus emblica 10 Local traders 1
3 Padamchal Rheum australe 200 Local traders 5
4 Attis Aconitum heterophyllum 800 Local traders 15
5 Bajradanti Potentilla fulgens 100 20 times of royalty 5
6 Ban Lasun Lilium nepalense 12000 Local traders 30
7 Bhringaraj Eclipta prostrata 10 20 times of royalty 0.5
8 Bhutkes Selinum tenuifolium 250 Local traders 5
9 Bish Aconitum spicatum 350 Local traders 5
10 Bojho Acorus calamus 55 Local traders 5
11 Bunki Phul Anaphilis triplinervis 100 20 times of royalty 5
12 Chiraito Swertia chirayita 250 Local traders 15
13 Chutro (Bark) Berberis asiatica 40 Local traders 8
14 Dalchini (Bark) Cinnamomum zeylanicum 80 Local traders 7
15 Dalechuk Hippophae salicifolia 100 20 times of royalty 5
16 Dhatelo Prinsepia utilis 100 20 times of royalty 5
17 Dhupi (Bark) Juniperus indica 1000 20 times of royalty 25
18 Dhupi (Leaf) Juniperus indica 35 Local traders 2
19 Ghodtapre Centella asiatica 20 20 times of royalty 1
20 Gokuldhup Commiphora wightii 100 20 times of royalty 5
21 Guchchi Chyau Morchella conica 14000 Local traders 500
22 Gujargano Cissampelos pareira 100 20 times of royalty 5
23 Gurjo Tinospora sinensis 50 Local traders 2
24 Harro Terminialia chebula 40 Local traders 2
25 Jatamansi Nardostachys grandiflora 600 Local traders 30
26 Kakarsingi Pistacia chinensis 550 Local traders 10
27 Kaladana Ipomoea hederaceae 550 Local traders 7
28 Kalikath (Seed)/Tigedi Sarcosperma arboretum 500 Local traders 5
29 Kalo Museli Curculigo orchioides 250 Local traders 6
30 Karaj Chulthe Rheum australe 200 Local traders 5
31 Kaulo / Pawan (Bark) Persea odoratissima 35 Local traders 30
32 Kurilo Asparagus racemosus 200 Local traders 5
33 Kutki Neopicrorhiza scrophulariiflora 1400 Local traders 30
34 Majitho Rubia manjith 200 Local traders 5
35 Paani Amala Nephrolepis cordifolia 60 20 times of royalty 3
36 Padamchal Rheum australe 50 Local traders 10
37 Pakhanbed Bergenia ciliata 40 Local traders 7
39 Rato chyau Pycnoporus cinnabarinus 4000 Local traders 50
40 Rittha Sapindus mukorossi 100 Local traders 3
41 Sadharan Chyau Agaricus campestris 1000 Local traders 10
42 Satuwa Paris polyphylla 5000 Local traders 40
43 Setakchini /Khiraula Moringa oliefera 400 Local traders 15
44 Seto Museli Chlorophytum borivilianum 250 Local traders 5
45 Silajit Eng; Mineral pitch 250 Local traders 50
46 Siltimur Lindera neesiana 40 20 times of royalty 2
47 Sisnu (Leaf) Urtica dioica 250 Local traders 2
48 Sisnu (Stem) Urtica dioica 250 Local traders 1
49 Sisnu (Powder) Urtica dioica 450 Local traders 2
50 Somlata Ephedra gerardiana 100 20 times of royalty 5
51 Sugandhawal Valeriana jatamansi 300 Local traders 20
52 Sunpati Rhododendron anthopogon 100 20 times of royalty 5
53 Tejpat Cinnamomum tamala 25 Local traders 2
54 Telali (Timber) Unknown 20 20 times of royalty 1
56 Timur Zanthoxylum armatum 490 Local traders 10
57 Titepati Artemisia vulgaris 20 20 times of royalty 1
58 Yarshagumba Cordyceps sinensis 1200000 Local traders 30000

Note: ①. Sources of market rate refers the source from where market rate of MAPs per kg was taken for data collection; ②. “Royalty” refers to the fee charged by the government for the utilization of forest resources such as timber and non-timber forest products. This fee is collected as per the Forest Act and Forest Regulation of Nepal, which outlines the amount of royalty to be charged based on the type and quantity of the forest resources extracted. “market rate equal 20 times of royalty rate for forest products” means that the price at which forest products are sold in the market is 20 times higher than the royalty fee charged by the government for their utilization. We used 20 times the royalty rate mentioned in the Forest Act of Nepal because local traders do not have access to the market price of non-timber forest products.

3.2 Gross value added of districts

A total of 15 species of MAPs were collected from Dailekh district for the sale propose. During the fiscal year 2019/ 2020, a total amount of NPR 57074450 was generated from the MAPs in Dailekh. Moringa olifera was the key species contributing major share to the GDP of this district. Total NPR 29160000 was generated from this species during that fiscal year. Among the 15 MAPs, bark of Machilus odoratissima was the least contributor to the GDP of this District from which only NPR 84000 was generated during that fiscal year. In Dolpa District, 19 species were identified having market value. Relatively a higher amount of capital was generated from MAPs in Dolpa District. A total of NPR 333359750 was generated during the fiscal year 2019/2020 in Dolpa District. Ophiocordyceps sinensis was the major species of MAPs which has contributed the highest portion of the GDP of this district. Total NPR 286401600 was generated from this species during that fiscal year. Among the 19 MAPs, Silajit, the rock extract (English name-Mineral Pitch) was the least contributor to the GDP of this district. Table 2 shows the major and least contributor of MAPs to the GDP of Karnali Province.
Table 2 Gross Value Added generated from MAPs in fiscal year 2019/2020
S.N. District Gross Value Added (NPR)
1 Dailekh 57074450
2 Dolpa 333359750
3 Humla 305450000
4 Jajarkot 534738500
5 Jumla 49137715
6 Kalikot 29875940
7 Mugu 116011200
8 Salyan 202801500
9 Surkhet 9952000
10 Rukum (West) 17212345
Total 1655613400
Similarly, 9 species of MAPs were collected from Humla District. Guchchi chyau (Morchella conica) was the major species of MAPs that contributed about total NPR of 203.88×10⁶ to the GDP of this district. Likewise, 29 species of MAPs were identified in Jajarkot District. A total of NPR 534738500 was generated during the fiscal year 2019/2020 in Jajarkot District. Timur (Zanthoxylum piperitum) was the major species of MAPs that contributed major share to the GDP of this district during the fiscal year 2019/20. Timur alone generated NPR 4.5766×10⁸ in the district. A total of 15 species of MAPs were harvested from Jumla District. Kutki (Picrorhiza kurrea) was the major species of MAPs that contributed about 31.63% to the total share of GDP of this district in 2019/20. Relatively lower amount of capital was generated from MAPs in Kalikot District as compared to other districts. Only NPR 29.88×10⁶ was generated from 7 species of MAPs in Kalikot District during the fiscal year 2019/2020.
In Mugu, Salyan and Surkhet Districts, a total of NPR 116.01×10⁶, NRs 202.80×10⁶ and NPR 9.95×10⁶ were generated respectively from MAPs in 2019/2020. Relatively lower amount of capital was generated from MAPs in Surkhet District. Where, 92.07% of the royalty is shared by Timur. Also, in Salyan and Surkhet, Timur was the major species of MAPs that contributed to the GDP of the districts. A total of 27 species of MAPs were identified in Rukum West District. A total of NPR 17.21×10⁶ was generated in 2019/2020 from MAPs in which Setakchini/Khiraula (Moringa oleifera) was the major species that contributed 36.95% to the share of GDP of the district.

3.3 Gross value added to the Karnali Province

A total of NPR 1655.61×106 gross value added was generated from the selling of MAPs in Karnali Province in the fiscal year 2019/2020. The largest amount (NPR 534.74× 10⁶) was generated from Jajarkot District whereas the smallest amount (NPR 9.95×10⁶) was generated from Surkhet District. Processing products of the medicinal plants are another source of the GDP. The price of the raw materials can be increased by performing primary processing, like cleansing, drying and packaging. In this study, the data of all processing products were collected throughout the province. The GDP generated by Kapur (Cinnamomum camphora), Asare (Alangium saluiforium), Mentha (Mentha piperita), Lemongrass (Gymbopogon citratus), and Camomile (Matricaria chamomilla) were calculated directly after producing the oil extract from these raw materials. GDP of Sisnu powder (Urtica diolica), Dhupi oil (Juniperus indica), Jatamansi oil (Nardostachys jatamansi), and Sunpati oil (Rhododendron anthopogan) was calculated by deducting the market value of raw material from the price of the refined products (Table 3).
Table 3 Gross value added (GVA) generated from processing products
S.N. Local name Scientific name Quantity
(kg)
Rate (NPR) Amount
(NPR)
District
originated
Deductible amount
Raw
materials
Quantity
(kg)
Rate
(NPR)
Amount (NPR)
1 Kapur oil Cinnamomum camphora 10 10000 100000 Surkhet Kapur leaf
2 Asare oil Alangium aluifolium 16 5000 80000 Surkhet Asare leaf
3 Mentha oil Mentha piperita 75 1700 127500 Surkhet Menttha
4 Lemon grass oil Cymbopogon citratus 530 3500 1855000 Surkhet, Dolpa Lemon grass
5 Chamomile oil Matricaria chamomilla 3.5 22500 78750 Surkhet Camomile
6 Sisnu powder Uritica diolica 500 600 300000 Rukum Sisnu leaf 600 250 150000
7 Dhupi oil Juniperus indica 1000 3000 3000000 Dolpa, Jumla Dhupi leaf 50000 35 1750000
8 Jatamansi oil Nardostachys jatamansi 150 50000 7500000 Dolpa, Jumla Jatamansi rhizome 7500 600 4500000
9 Sunpati oil Rhododendron anthopogan 100 8000 800000 Dolpa, Jumla Sunpati 5000 100 500000
Total 13841250 6900000

3.4 Contribution to provincial and national gross domestic product

The nominal GDP of Karnali Province in 2019/2020 was NPR 160738 million while the nominal GDP of Nepal during the same year was about NRs. 7367043 million (CBS, 2020). Where, GVA from MAPs in Karnali Province is 165.61 million. Hence, the contribution of the total GVA by MAPs sector in Karnali Province to the Provincial GDP is calculated at 1.03%, and to the nation’s GDP is calculated at 0.22% (Table 4).
Table 4 Contribution of the forestry sector in GDP of Karnali Province and national GDP
Administrative level GDP
(×106 NPR)
Contribution%
(Proportion of the GDP)
Province 160738 1.03
Country 7367043 0.022

4 Discussion

Nepal is enriched with plant diversity because of its climatic variability as induced from sharp altitudinal differences (Kalauni and Joshi, 2018). It is gifted with more than 700 species of medicinal herbs in which 250 species are traditionally used in local medicines and more than 100 species are commercially collected from the wild and most of them are exported in raw form to China and India (Pandey, 1961; Kalauni and Joshi, 2018; Caporale et al., 2020). This study identified 58 MAP species in Karnali Province of Nepal. Most of these MAPs were collected from the wild and processed through cleansing, drying and packaging. In Karnali Province, majority of the raw MAPs was exported to either China or India and a smaller part is processed to essential oils within the country. In recent years, number of MAPs are cultivated in national and community forests and in private lands (Sah et al., 2020). Species that are cultivated in community forests and private lands in lower altitude include Timur (Zanthoxylum piperitum), Lemongrass (Cymbopogon citratus), Mentha (Mentha piperita), Citronella (Cymbopogon nardus), Palmarosa (Cymbopogon martini), Chamomile (Matricaria chamomilla), Tejpat (Cinnamomum tamala), Soapnut (Sapindus mukorossi) and Kurilo (Asparagus racemosus) (Pyakurel et al., 2017; Kalauni and Joshi, 2018; Pyakurel et al., 2019).
Collection of Yarsagumba (Cordyceps sinensis) among the harvesters is becoming very fascinating due to its high medicinal value and high cost as well. In Karnali, the local market rate for a kg of Yarsagumba (Cordyceps sinensis) is NPR 1200000. In upper part of the Karnali Province especially in Humla, Jumla and Dolpa, local dwellers involve in collection and gathering of this valuable medicinal plant species leaving their entire job aside. Local collectors can earn descent amount of cash by selling this valuable medicinal plant. In rural areas of the Karnali Province, local people can sustain their livelihood for 6-8 months only by selling these valuable herbs. Therefore, collection and trade of MAPs become indispensable for the people in the Himalayas as there are limited livelihood opportunities in those areas.
In recent years, the sector of MAPs is becoming a booming commercial sector in Karnali Province. It plays an important role in the GDP of the province. The MAPs contributed to 1.03% of GDP of Karnali Province and 0.022% National GDP in the fiscal year 2019/2020. However, there is no reliable trade system for trading these MAPs in Karnali Province. In most of the scenario the collected MAPs were sold to sub-local traders at minor markets or to local traders at major market Center. In most of the cases, harvesters receive advance amount from sub-local traders and they often have mutual business relationship.
In Nepal, most of the MAPs are collected from the wild. It is estimated that about 85% of the MAPs are collected from the wild and most of them are collected from the western part of Nepal especially from Karnali and Sudurpaschhim Provinces. (Kalauni and Joshi, 2018). The proportion of revenue shared by the NTFPs to the national GDP is relatively higher from these areas. The lower part of the western region consists of dense forest which provide favorable environment for the growth of valuable MAPs (Kalauni and Joshi, 2018). Similarly, the higher part of the western region provides favourable environment for the growth of valuable MAPs like Yarsagumba (Cordyceps sinensis), Satuwa (Paris polyphylla), Guchchi Chyau (Morchella esculenta), which have a higher market value. The collection and marketing of these valuable medicinal plants in the hilly and mountain region of the country has significantly helped the rural people by providing livelihood opportunities to diversify their livings (Kalauni and Joshi, 2018). In the Himalayas, people have inadequate land for agriculture and limited livelihood diversification opportunities, and thus, proper cultivation and harvesting of MAPs can alleviate poverty to a considerable extent in these remote areas (Gurung and Pyakurel, 2017). At present, MAPs are becoming major export commodity in Nepal (Gurung and Pyakurel, 2017). It is estimated that about 7000 to 27000 t of MAPs are annually collected and traded from Nepal which will generate the foreign earnings of about USD 60 million (Olsen and Larsen, 2003; Pyakurel et al., 2017; Pouliot et al., 2018). In the past, most of these species were exported to India and China in a raw form. However, in recent years with the help of advanced technology processing of these products were initiated in Nepal (Gurung and Pyakurel, 2017).
In Karnali Province, the processing of medicinal products was also performed by the MAPs collector. The processing of medicinal plants was mainly performed for the essential oil yielding plants. The advancement of technology will help to expand the diversification of MAPs sector which will provide opportunities for rural-poor people to diversity their source of income. In the province, MAPs were primarily used for their medicinal or aromatic properties in pharmacy or perfumery sector. In addition, the number of cosmetic industries is increasing in Nepal which uses natural ingredients in their products. The processing and consumption of MAPs at local market can give multiple benefits to the buyers, suppliers and the revenue collectors.
It is no doubt that the promotion of the cultivation, collection and harvesting of these valuable medicinal plants can diversify the source of income at rural parts of the province. Moreover, the availability of the processing technology can increase the demand, economic opportunity and cash value of the MAPs products. Majority of the rural people in Karnali Province are engaged in collection of MAPs to support their livelihoods. Therefore, if proper cultivation, collection and marketing of MAPs are developed, these plants can contribute to the major share of the local, provincial and national GDP.

5 Conclusions

This pioneer study estimated the contribution of MAPs of Karnali Province to the provincial and national GDP of Nepal. A total economic output equivalent to NPR 160738 million (USD13.88 billion) and 1.03% of GDP of Karnali Province as well as 0.02% National GDP was generated from this sector in the fiscal year 2019/2020. This suggests that the current GDP estimate undervalues the contribution of the sector to the provincial and national GDP due to the non-inclusion of ethnobotanical uses of medicinal plants. Moreover, if all cash and environmental benefits people derive from this sector could be valued and recorded in the System of National Accounts, the contribution of MAPs on GDP would be much higher than the amount estimated in this study. There is no means of verification as this is the first-ever study of its kind conducted at the province level. The contribution of medicinal and aromatic plant sector computed in this study can become a part of national estimates. Hence, this study quantifies the direct economic contribution of the MAPs sector to the local, district level, provincial and national economy of Nepal.

Acknowledgements

The authors express their sincere thanks to the Karnali Provincial Government for allocating fund for conducting this study.
[1]
Acharya K P, Paudel P K. 2020. Biodiversity in Karnali Province: Current status and conservation. Ministry of Industry, Tourism, Forest and Environment, Karnali Province Government. Surkhet, Nepal. https://www.researchgate.net/publication/346424393.

[2]
Acharya R, Dahal S, Kunwar R, et al. 2015. Medicinal and aromatics plants in a far western Nepal: A sustainable livelihoods analysis. Hartman and Weitpet, 2015: 77-82. https://www.researchgate.net/publication/299676190

[3]
Barata A M, Rocha F, Lopes V, et al. 2016. Conservation and sustainable uses of medicinal and aromatic plants genetic resources on the worldwide for human welfare. Industrial Crops and Products, 88: 8-11.

[4]
Bauer K M. 2004. High frontiers:Dolpo and the changing world of Himalayan pastoralists. New York, USA: Columbia University Press.

[5]
Callen T. 2008. Back to basics: What is gross domestic product? Finance & Development, 45(4): 48-49.

[6]
Caporale F, Mateo-Martín J, Usman M F, et al. 2020. Plant-based sustainable development—The expansion and anatomy of the medicinal plant secondary processing sector in Nepal. Sustainability, 12(14): 55-75.

[7]
CBS. 2012. National Population and Housing Census 2011 (National Report). National Planning Commission Secreatariat, Central Bureau of Statistics, Government of Nepal. Kathmandu, Nepal.

[8]
CBS. 2020. Provincial GDP 2019/2020. National Planning Commission, Central Bureau of Statistics, Government of Nepal. Kathmandu, Nepal. https://cbs.gov.np/table-1-provincial-gross-value-added-by-industrial-division-2076-77

[9]
CBS. 2021a. PGDP 2077/78. National Planning Commission Secreatariat, Central Bureau of Statistics, Government of Nepal. Kathmandu, Nepal. https://cbs.gov.np/pgdp_2077-78

[10]
CBS. 2021b. National population census primary report B. National Planning Commission, Government of Nepal. Kathmandu, Nepal.

[11]
Demissie F, Yeshitela K, Rouleau M, et al. 2019. Socio-economic importance of forest resources and their conservation measures in Ethiopia: The case of area closure in South Gonder of Ethiopia. Environmental Monitoring and Assessment, 191: 1-11.

[12]
DFRS. 2015. State of Nepal’s forests. In: Forest Resource Assessment (FRA), Department of Forest Research and Survey (DFRS), Katthmandu, Nepal.

[13]
DMP. 1970. Medicinal plant of Nepal. Department of Medicinal Plants. Kathmandu, Nepal.

[14]
Guleria C, Vaidya M, Sharma R, et al. 2014. Economics of production and marketing of important medicinal and aromatic plants in mid hills of Himachal Pradesh. Economic Affairs, 59: 363-378.

[15]
Gurung K, Pyakurel D. 2017. Identifcation manual of commercial Medicinal and Aromatic Plants of Nepal. Nepal Herbs and Herbal Products Association (NEHHPA): Teku, Kathmandu, Nepal.

[16]
Joshi K, Joshi R, Joshi A R. 2011. Indigenous knowledge and uses of medicinal plants in Machhegaoun, Nepal. Indian Journal of Traditional Knowledge, 10(2): 281-286.

[17]
Kala C P. 2004. Studies on the indigenous knowledge, practices and traditional uses of forest products by human societies in Uttaranchal state of India. GB Pant Institute of Himalayan Environment and Development: Almora, India.

[18]
Kalauni D, Joshi A. 2018. Status of Medicinal and Aromatic Plant (MAPs) and socio-economic influence in Nepalese livelihood—A review research. Acta Scientific Agriculture, 2(9): 123-130.

[19]
KPPC. 2020. Nepal provincial planning, baseline and strategic options for Karnali Province. Karnali Province Planning Commission: Surkhet, Nepal.

[20]
Lama Y C, Ghimire S K, Aumeeruddy-Thomas Y. 2001. Medicinal plants of dolpo: Amchis’ knowledge and conservation. People and Plants Initiative, WWF Nepal Program, Kathmandu, Nepal.

[21]
Langat D K, Maranga E K, Aboud A A, et al. 2016. Role of forest resources to local livelihoods: The case of East Mau forest ecosystem, Kenya. International Journal of Forestry Research, 2016. DOI: 10.1155/2016/4537354.

[22]
Malla S B, Shakya S R. 1984. Medicinal plants of Nepal. In: Nepalnature’s paradise (T.C. Majupuria). Bangkok, Thailand: White Lotus Company.

[23]
Miura S, Amacher M, Hofer T, et al. 2015. Protective functions and ecosystem services of global forests in the past quarter-century. Forest Ecology and Management, 352: 35-46.

[24]
MOFSC. 1995. Forest Regulation 1995. Kathmandu, Nepal: Ministry of Forests and Soil Conservation.

[25]
Olsen C S. 2005. Valuation of commercial central Himalayan medicinal plants. AMBIO, 34(8): 607-610.

[26]
Olsen S, Larsen O H. 2003. Alpine medicinal plant trade and Himalayan mountain livelihood strategies. The Geographical Journal, 169(3): 243-254.

[27]
Pandey P R. 1961. Distribution of medicinal plants of Nepal. Symposium on Medicinal Plants: 15-61. Ceylon, India.

[28]
Poudel K L. 2007. Trade potentility and ecological analysis of NTFPs in Himalayan Kingdom of Nepal. https://digitalrepository.unm.edu/nsc_research/5

[29]
Pouliot M, Pyakurel D, Smith-Hall C. 2018. High altitude organic gold: The production network for Ophiocordyceps sinensis from far-western Nepal. Journal of Ethnopharmacology, 218: 59-68.

[30]
Pyakurel D, Bhattarai I, Ghimire S K. 2017. Trade and conservation of medicinal and aromatic plants in western Nepal. Botanica Orientails- Journal of Plant Science, 11: 27-37.

[31]
Pyakurel D, Smith-Hall C, Bhattarai-Sharma I, et al. 2019. Trade and conservation of Nepalese medicinal plants, fungi, and lichens. Economic Botany, 73: 505-521.

[32]
Rai J R, Paudel R P, Pathak A. 2016. Promoting forest based enterprises in Nepal: Lessons from piloting activities in Koshi hill districts. Forest Action, Kathmandu, Nepal.

[33]
Ranjit Y. 2011. Economic impact of people’s participation in forest management (a case study of Kabhre Palanchwok, Nepal). Economic Journal of Development Issues, 13- 14 (1-2): 139-151.

[34]
Ratna S. 2020. Medicinal plants and their traditional uses in Ramkot Village, Kathmandu Nepal. Patan Pragya, 6(1): 180-190.

[35]
Sah A P, Mandal R A, Mathema A B, et al. 2020. Medicinal herbs in community forests of Darchula District, Nepal: A boon of employment and income generation for rural users. Journal of Historical Archaeology & Anthropological Sciences, 5(5): 167-173.

[36]
Sunderlin W D, Angelsen A, Belcher B, et al. 2005. Livelihoods, forests, and conservation in developing countries: An overview. World Development, 33(9): 1383-1402.

[37]
Teischinger A. 2009. The forest based sector value chain: A tentative survey. Lenzinger Berichte, 87: 1-10.

[38]
Uddin K, Shrestha H L, Murthy M S R, et al. 2015. Development of 2010 national land cover database for the Nepal. Journal of Environmental Management, 148: 82-90.

Outlines

/