
Journal of Resources and Ecology >
Assessing Vulnerability to Environmental Changes of Freshwater Crab, Thaipotamon chulabhorn in the Dun Lumpun Non-Hunting Area, Thailand
|
Arika BRIDHIKITTI, E-mail: arika.bri@mahidol.edu |
Received date: 2023-01-29
Accepted date: 2023-04-30
Online published: 2023-08-02
Thaipotamon chulabhorn (Mealy Crab) is a freshwater crab, listed as ‘Least Concerned’ in the IUCN Red List of Threatened Species. Nonetheless, this crab is exclusively found in one small area of the Dun Lumpun Forest, Thailand, and currently faces high exposure to environmental changes. This study aims to investigate key dynamic factors that influence vulnerability to environmental changes of the Mealy Crab. The study was conducted between 15 March and 23 October 2016, covering the local summer until the end of the rainy season and being influenced by strong El Niño, thus suggesting drought episodes. This vulnerability assessment was carried out through crab population records from 1997 to 2016, field measurements/surveys, and interviews with experienced park rangers. The results revealed that drought is the major vulnerability factor that is threatening the population of the crabs and their livelihoods (7.96 out of 10), followed by an increased number of their natural enemies (7.41), variations in groundwater level (6.11), changes in groundwater quality (4.63), changes in forest soil (4.63) and human intervention (4.26). Since 1996, human intervention has been found to have a little direct impact on the crab population due to the restricted access to forest resources. The 2016 drought was accompanied by anomalously low rainfall and the early onset of the rainy season, contributing to an earlier and shorter mating period of the crabs. Nonetheless, a consistently increased number of the Mealy Crab population indicated that they are not significantly vulnerable to a larger number of their natural enemies, and even to the changes in groundwater and forest soil. In conclusion, the crab population was increasing along with changes in the habitat and climate and its growth cycle was unusual during the drought.
Arika BRIDHIKITTI , Bidur KHADKA , Suraj SHARMA . Assessing Vulnerability to Environmental Changes of Freshwater Crab, Thaipotamon chulabhorn in the Dun Lumpun Non-Hunting Area, Thailand[J]. Journal of Resources and Ecology, 2023 , 14(5) : 1092 -1103 . DOI: 10.5814/j.issn.1674-764x.2023.05.020
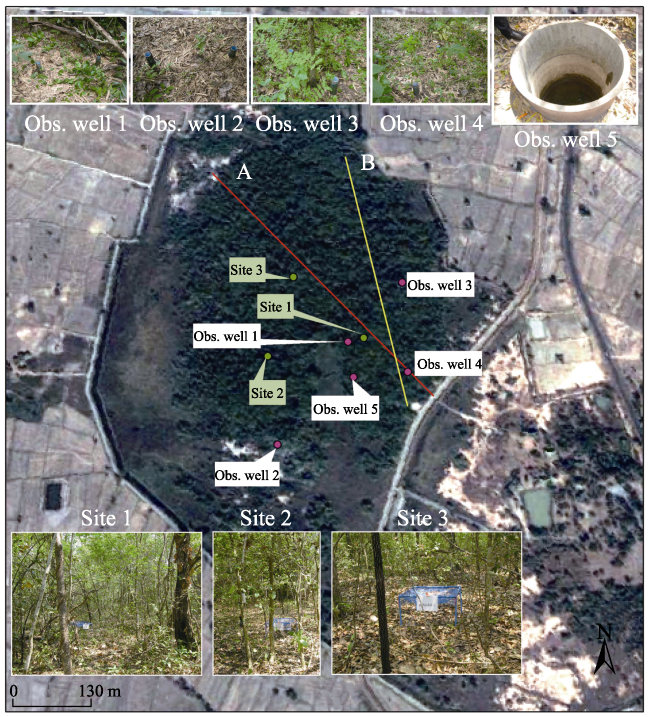
Fig. 1 Sampling sites in Dun Lumpun Non-Hunting Area |
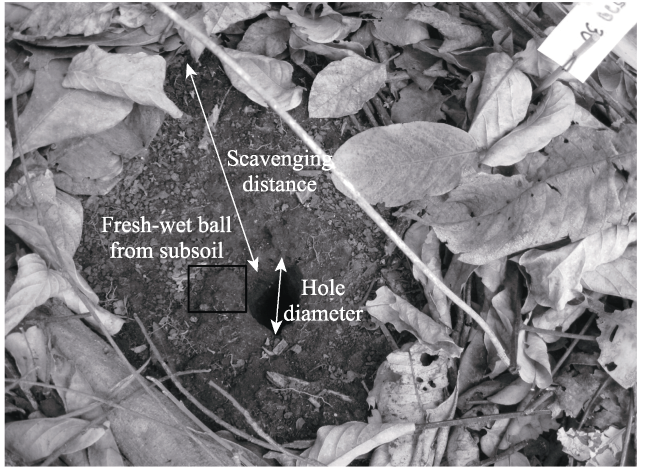
 Nighttime observations were conducted using an infrared video recorder (Power Bank Full HD 1920×1080 P model), which captured 5 randomly selected holes in the forest from 7:00 PM to 2:00 AM from 9 April to 24 October 2016.Daytime observations of 34 crab hiding holes at three studied sites (see Fig. 1) in the forest were conducted once a month from 9 April to 24 October 2016 to determine the hole-closure period, seasonal survival rate, and the dimension of the food-scavenging zone. The longest diameter of the hole and the scavenging zone, the area with less leaf litter (Fig. 2), were measured. The dynamic status of the holes was classified into ‘activated’, ‘abandoned’, and ‘closured’. The active hole was suggested from clean holes with fresh-wet soil balls nearby. The abandoned hole refers to an unoccupied status, probably because that crab is dead already or moved to anywhere else. This hole looks like pretty dirty holes without any fresh-wet soil balls, except a spider net inside the hole. The closured hole is identified as a shallow hole sealed with soil.
Fig. 2 Hole configuration and scavenging zone |
Day-to-Night observations of crab behaviors in the exhibition zone were done once a month from 9 April to 24 October 2016 using an infrared video recorder (All-In-One HD IP camera). The exhibition zone is designed for the crabs with imitating natural habitats. It is a 1.0×1.5 m2 acrylic box, containing clay, plastic grass, natural rocks, and groundwater from the well outside the forest. Once every 15 minutes, the number of active crabs was counted for five minutes to study physical responses of the crabs to diurnal change. The crabs’ responses to human (such as tourists) intervention were also remarked from the video recorder.A field survey was conducted on two transect lines (Fig. 1) with distances of 520.93 m for line A and 418.18 m for line B. Along with the survey, the number of holes (activated, abandoned, and closured) ± 1 meter from the lines were count, and photos of the hole environment were taken to determine proportions of the areas preferably inhabited by the crabs. This survey was done in the daytime on 14−15 August 2016. The results were also used to justify crab population density.Interviews with the park rangers regarding crab spatial distribution started after the completion of the regular annual crab population survey in August 2016. All park rangers were asked to indicate densely crab populated areas on a grid map.Hourly soil moisture and soil temperature were collected at 0.5 m from soil surface using soil moisture sensor and soil temperature sensor (EC-5 and RT-1, respectively) with EM50 data logger from Decagon Devices, Inc. The sensors were installed at Site 2 (Fig. 1).Soil texture and soil color were assessed in the field on 18 September 2016 using the ribbon test and Munsell soil color chart, respectively. Twenty-three samples were taken from the soil surface near the three studied sites and the observed wells. Another 23 samples were taken over fringes of the crab holes, represented subsoil carry over the top by the crabs (Fig. 2), and 9 soil samples were from rice fields close to the forest. A total of 55 samples each weighing about 100 g was used in the laboratory for soil pH assessment.Six soil cores were collected on 18 September 2016 and they were tested for saturated soil hydraulic conductivity and soil density. Three samples were obtained from three studied sites (Fig. 1): in the forest area with the appearance of many crab holes, in the outskirts of the forest, and the Dry Dipterocarp forest. All the soil cores had the same diameter and height of five cm and it was used to collect the soil at a 15-cm depth from the surface. The soil density was estimated by dividing oven-dry soil weight (at 105 ℃ for 24 hours) by the soil core volume. Soil hydraulic conductivity was later assessed in the laboratory with the soil core samples using Minidisk portable tension infiltrometer (Decagon Devices, Inc.) with known soil texture and two to six suction rate adjustments.The soil pH of the 55 samples was assessed according to the 1:1 soil: water extraction procedure. The soil was first sieved and weighed to 30.00±0.02 g using a two-digit balance. Then, thirty milliliters of distilled water were added into a plastic beaker containing 30 g of soil. The soil: distilled water solution was shaken for 15 minutes before its pH was measured using calibrated digital pH meter (PH-8685 AZ Instrument).Biomass deposition rate onto the soil was assessed using the weighting method. The air-dried biomass including leaves, twigs, fruits, and seeds, which were deposited on the sampling areas (0.7×0.7 m2, see Fig. 1) over specified periods, were weighed and the deposited vegetation species corresponding to high contribution into the soil biomass were identified from the collected leaves. The leaves were collected monthly from 15 March to 24 October 2016.Table 1 Weight, dimensions and sex distribution of the observed Mealy Crabs |
| Weight (g) | Number | Carapace dimension (cm) | |||
|---|---|---|---|---|---|
| Female | Male | Upper length | Lower length | Width | |
| 10-15 | 3 | 3 | 2.17 | 2.33 | |
| 16-20 | 2 | 3.5 | 2.38 | 2.63 | |
| 21-25 | 5 | 5 | 3.63 | 2.44 | 2.99 |
| 26-30 | 5 | 4 | 3.87 | 2.74 | 3.09 |
| 31-35 | 8 | 8 | 3.95 | 2.83 | 3.27 |
| 36-40 | 2 | 4 | 4.24 | 3.15 | 3.4 |
| 41-47 | 2 | 4.4 | 3.15 | 3.25 | |
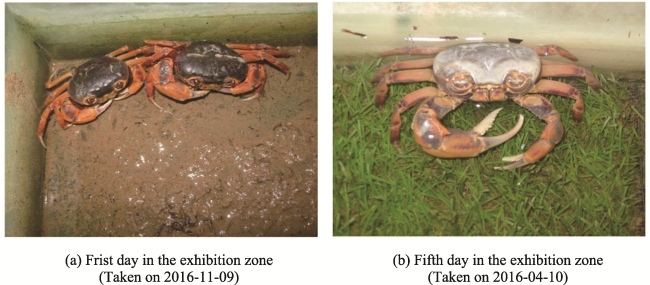
Fig. 3 Colors of the crabs on different dates (a) first day and (b) fifth day in the exhibition zone |
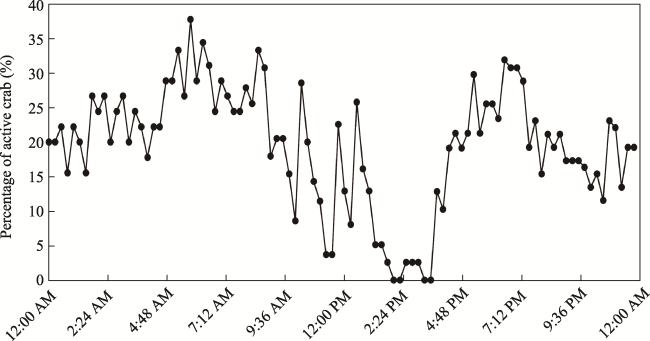
On 9 April 2016, two female crabs in the forest were found ovigerous (bearing eggs on their pleon). Typically, baby crabs hatch from eggs between March and May. The mother crabs and their babies usually stay inside the hole until the onset of the rainy season, thus triggering the moist soil condition (Mahasarakham University, 1997).On 1 July 2016, female crabs in the exhibition site were not ovigerous, whereas, in the forest, several couples were found matting. The findings of the present study are similar to the findings in the work of Mahasarakham University (1997), which revealed that mating was observed in July 1997, but typical mating started in August (Mahasarakham University, 1997). This early mating season in 1997 was claimed to be a result of the early onset of the rainy season after long-term drought from May to June 1997 (Mahasarakham University, 1997).On 14 August 2016, female crabs in the exhibition zone were not ovigerous and no mating couple was found during the line transect survey in the forest. Approximately 7.2% of the total observed holes along the transect lines were abandoned; whereas a similar proportion of the holes was closed (7.5%). The crabs usually close their hiding holes with clayey soil to protect themselves during the most vulnerable periods. Furthermore many tiny holes were found near the water channel. This could imply the appearance of juvenile crabs.Fig. 4 Percentage of active crabs in the exhibition zone |
Table 2 Biomass deposition rate (g m-2 d-1) and percent distribution of species accounting to total biomass (in 2016) |
| Scientific name | Common name | Site 1 | Site 2 | Site 3 | ||||||||
|---|---|---|---|---|---|---|---|---|---|---|---|---|
| Mar 15th- May 20th | Jul 2nd- Aug 14th | Sep 18th - Oct 23rd | Mar 15th - Apr 9th | Apr 9th - May 20th | Jul 1st - Aug 14th | Sep 18th -Oct 23rd | Mar 15th -Apr 9th | Apr 9th -May 20th | Jul 3rd- Aug 14th | Sep 18th- Oct 23rd | ||
| Biomass deposition rate (g m-2 d-1) | 0.684 | 0.535 | 0.633 | 7.111 | 0.141 | 3.207 | 0.701 | 8.533 | 1.852 | 0.893 | 0.426 | |
| Bambusa arundinacea Willd. | Phai paa | 11.34 | 0.67 | 0.74 | 1.89 | |||||||
| Diospyros mollis Griff. | Ebony tree | 14.43 | 8.02 | 21.74 | ||||||||
| Casearia grewiaefolia Vent | Kruai Paa | 4.12 | 2.16 | 22.64 | 14.13 | |||||||
| Alangium salviifolium (L.f.) Wangerin. subsp. Hexapetalum Wangerin | Pruu | 11.34 | 7.69 | 15.83 | 0.22 | 9.63 | 11.98 | 9.90 | 20.28 | 3.26 | 36.36 | 57.89 |
| Terminalia alata Heyne ex Roth. | Laurel | 7.22 | 1.92 | 1.57 | 5.93 | 1.98 | 2.36 | 5.43 | 5.26 | |||
| Spatholobus parviflorus (DC.) Kuntze | Thao phan saai | 1.03 | 2.92 | 7.41 | 0.99 | 3.77 | ||||||
| Streblus asper Lour. | 24.74 | 89.21 | 31.11 | 10.89 | ||||||||
| Eugenia cumini Druce | 3.09 | 10.37 | 1.84 | 1.98 | 14.62 | 27.17 | 54.55 | 31.58 | ||||
| Maytenus marcanii (Craib) Ding Hau | Naam daeng | 16.49 | 21.15 | 2.70 | 11.85 | 0.47 | 6.52 | 2.63 | ||||
| Cryptolepis buchananii Roem. & Schult. | Thao en on | 2.06 | 9.62 | 0.72 | 6.67 | 1.84 | 16.83 | 0.94 | 1.09 | 2.63 | ||
| Olax scandens Roxb. | 4.12 | 2.70 | ||||||||||
| Cassia siamea Lamk. | Thai Copper Pod | 13.46 | 26.86 | 68.20 | 30.69 | |||||||
| Vitex pinnata Linn. | Teen nok | 3.85 | 23.02 | 12.59 | 9.43 | 14.13 | ||||||
| Uvaria rufa Blume | 3.85 | |||||||||||
| Diospyros montana Roxb. | Ma Kluea paa | 25.00 | 26.62 | 3.70 | 14.29 | 15.84 | 6.13 | |||||
| Streptocaulon juventas (Lour.) Merr. | 1.92 | 1.38 | ||||||||||
| Osbecfia chiuensis Linn. | En aa noi | 0.46 | 2.97 | 4.55 | ||||||||
| Artocarpus lakoocha Roxb. | Haat | 6.13 | ||||||||||
| Pluchea indica (L.) Less. | Indian March Fleabane | 3.30 | 2.17 | 4.55 | ||||||||
| Capparis sepiaria Linn. | Naam wua sang | 2.17 | ||||||||||
| Others | 11.54 | 10.79 | 7.92 | 2.17 | ||||||||
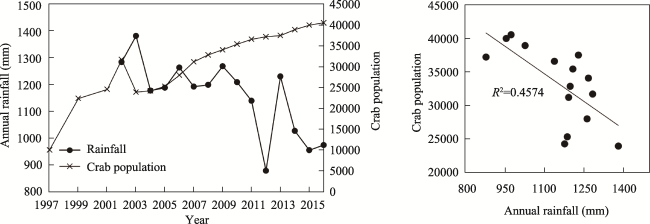
Fig. 5 Time-series crab population and annual rainfall (left) and number of crab population against its corresponding annual rainfall (right) |
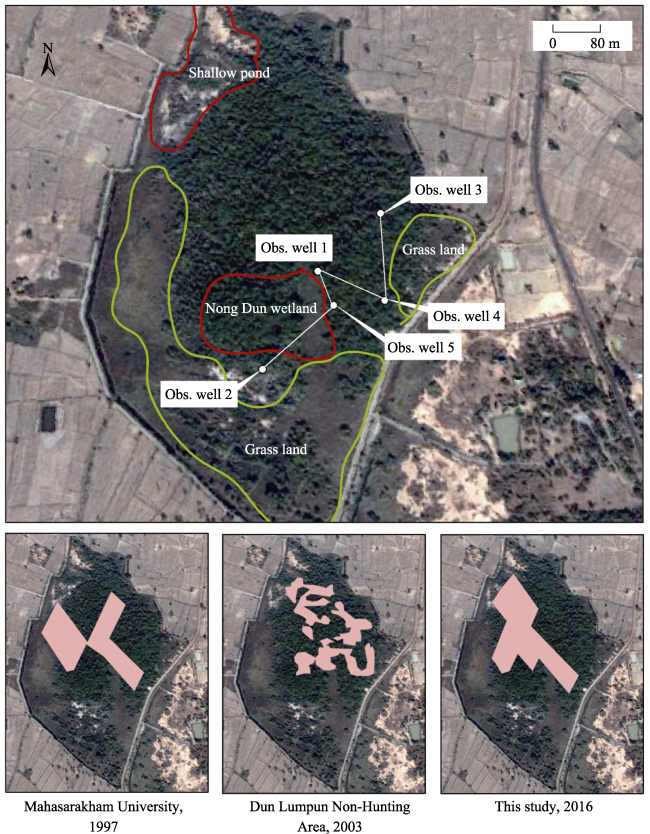
Fig. 6 Locations of observation wells and Nong Dun wetland (upper) and crab spatial distribution maps from several studies (lower) |
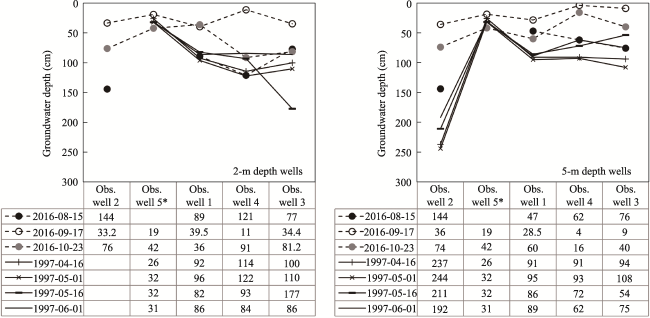
Fig. 7 Groundwater depth taken from 2-m depth wells (left) and groundwater level from the surface taken from 5-m depth wells (right)Note: * The observation well 5 has no depth information. |
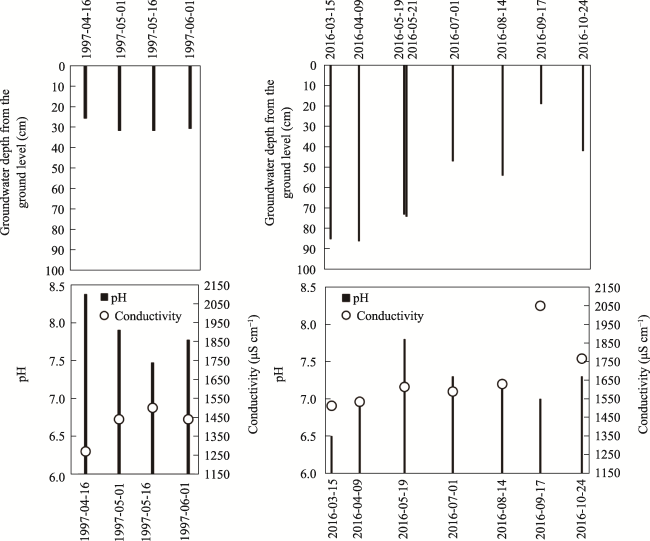
Fig. 8 Groundwater quality and quantity observed at well 5 |
Table 3 Physical and chemical characteristics of soils from the Dun Lumpun forest and its adjacent areas |
| Area | Site description | Depth | pH | OC (%) | Soil texture | Soil color | Hydraulic conductivity (μm s‒1) | Bulk soil density (g cm‒3) |
|---|---|---|---|---|---|---|---|---|
| Dun Lumpun Forest | Site 1: Forest soil | Surface | 8.00 | 2.5-2.75 | Silty Clay Loam | 7.5YR 2.5/1 Black | 1.1‒1.8 | 1.25 |
| Underground | 8.35 | 1.5-2.25 | Clay Loam | 7.5 YR 3/1 Very dark gray | ‒ | ‒ | ||
| Site 2: Forest soil | Surface | 8.15 | 2.25-2.5 | Clay Loam | 7.5 YR 3/1 Very dark gray | 3.2 | 0.97 | |
| Underground | 8.13 | 2.5-2.75 | Clay Loam | 7.5 YR 3/1 Very dark gray | ‒ | ‒ | ||
| Site 3: Forest soil | Surface | 8.27 | 2.25-2.5 | Silty Clay Loam | 7.5YR 2.5/1 Black | 0.9 | 1.07 | |
| Underground | 8.26 | 2.25-2.5 | Silty Clay Loam | 7.5YR 2.5/1 Black | ‒ | ‒ | ||
| Forest soil | Surface | 6.40 | 2.5-2.75 | Clay Loam | 7.5 YR 3/1 Very dark gray | 2.1 | 1.00 | |
| Soils near the Dun Lumpun Forest | Grassland soil | Surface | 10.30 | 0-0.25 | Loamy Sand | 2.5YR 4/6 Red | 10.03 | 1.80 |
| Dry Dipterocarp forest soil | Surface | 5.50 | 1.25-1.5 | Loamy Sand | 2.5YR 4/2 Weak Red | 9.27 | 1.92 | |
| Rice field soil | Surface | 7.60 | 0.25-0.5 | Loam | 7.5YR 2.5/2 Very dark brown | ‒ | ‒ | |
| Rice field soil | Surface | 8.20 | 0.5-0.75 | Loam | 7.5YR 2.5/1 Very dark brown | ‒ | ‒ | |
| Rice field soil | Surface | 7.90 | 1.25-1.5 | Loamy Sand | 2.5YR 4/2 Weak red | ‒ | ‒ | |
| Rice field soil | Surface | 8.30 | 1.5-2.25 | Sandy Clay Loam | 7.5 YR 3/1 Very dark gray | ‒ | ‒ | |
| Rice field soil | Surface | 7.30 | 0-0.25 | Loamy Sand | 2.5YR 4/2 Weak red | ‒ | ‒ |
Note: ‒ means not measured. |
In 2016 from March (local summer) to October (end of rainy season), there were anomaly low rainfalls and an early onset of intensive rainfall, resulting in an earlier and shorter crab mating period.Crab-enemies, which were found in this study were rodents, Asian water monitor (Varanus salvator), Bengal monitor (Varanus bengalensis), small Asian mongoose (Herpestes javanicus), and python (Python reticulatus). Their number is expected to be increasing.As compared to the results obtained from previous studies, significant changes in groundwater levels and qualities were observed. This implies that there is dynamic groundwater in the forest.Physical and chemical characteristics of the soil in Dun Lumpun Forest were diverse from those observed in the adjacent areas, including the rice fields, grasslands, and Dry Dipterocarp forest. The finding suggests that the crabs cannot adapt to different soil types.The human intervention had a little direct impact on the crab population as the result of the restriction of human access to the forest since 1996. Furthermore, the forest and the crabs have also been protected by the cultural belief about the Forest’s Angel Guardian.| [1] |
Department of National Park, Wildlife and Plant Conservation, Ministry of Natural Resource and Environment Thailand. 2003. Crab population survey report for the year 2003 during May 15th-23rd, 2003, Dun Lumpun Non-Hunting Area. Ministry of Natural Resource and Environment (Thailand).
|
| [2] |
|
| [3] |
|
| [4] |
Mahasarakham University. 1997. Study and investigation of biodiversity conservation in natural habitats in Mahasarakham Province. A final report submitted to the Department of Environmental Policy and Planning, Ministry of Science, Technology and Environment, Thailand.
|
| [5] |
NOAA National Oceanic and Atmospheric Administration. 2016. Multivariate ENSO Index (MEI). Washington DC: Department of Commerce of USA.
|
| [6] |
|
/
| 〈 |
|
〉 |