
Journal of Resources and Ecology >
Performance Evaluation of Rural Characteristic Industry Development in Metropolitan Areas based on the TOPSIS Method—Taking the Xi’an Metropolitan Area as an Example
|
FU Xiaomeng, E-mail: 707561728@qq.com |
Received date: 2023-02-01
Accepted date: 2023-04-26
Online published: 2023-08-02
Supported by
The Major Project of the Ministry of Education of China in 2020(20JZD012)
The New Urbanization Research Fund of Xi’an University of Architecture and Technology in 2022(2022SCHZ05)
The coordinated development of urban and rural areas is an important measure for releasing the potential of domestic demand and promoting industrial upgrading. The development of rural industries in metropolitan areas, especially those with rural characteristics, is an important pathway for achieving comprehensive rural revitalization and promoting urban and rural integration in the metropolitan area. Based on the development goal of promoting rural industries in metropolitan areas, this study constructed a performance evaluation index system, including industrial development, industrial integration, rural construction, and farmers’ life, and applied the TOPSIS method to evaluate the development of rural characteristic industries in the metropolitan area of Xi’an. The results indicated that the overall development performance of rural characteristic industries in the metropolitan area was at a medium level. The developmental performance at the level of “primary industry-secondary industry-tertiary industry” integration was relatively good, with a certain extension of the industrial chain and expansion of industrial functions, and certain economic benefits were created in this process. However, the development of rural characteristic industries has not effectively driven the development of rural society. In terms of space, the development of rural characteristic industries in the metropolitan area presents a circular distribution feature that decreases from the core circle to the outer circle. In terms of types, there are significant differences in the development levels between the different types, and the weaknesses of different industries vary. Based on these considerations, the key pathway for the collaborative and typified development of regional characteristic industries is proposed.
FU Xiaomeng , ZHANG Pei , ZHANG Mengjiao , LI Zhijun . Performance Evaluation of Rural Characteristic Industry Development in Metropolitan Areas based on the TOPSIS Method—Taking the Xi’an Metropolitan Area as an Example[J]. Journal of Resources and Ecology, 2023 , 14(5) : 1044 -1052 . DOI: 10.5814/j.issn.1674-764x.2023.05.015
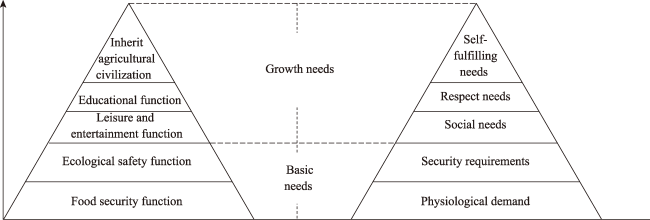
Fig. 1 Mapping of Maslow’s demand hierarchy theory and rural industrial functions |
Table 1 Performance evaluation index system and index weights of rural characteristic industries |
| Expectation performance | Target layer | Criterion layer | Indicator layer | |||
|---|---|---|---|---|---|---|
| Index | Weight | Index | Weight | Indicator layer | Weight | |
| Industrial development benefits | Industrial development effect | 0.4823 | Production benefit | 0.1206 | Extent of agricultural technology popularization | 0.0197 |
| Scale of characteristic industries | 0.0358 | |||||
| Total output of characteristic industries | 0.065 | |||||
| Economic performance | 0.3617 | Total output value of characteristic industries | 0.1206 | |||
| Comprehensive output value of characteristic industries | 0.2412 | |||||
| Industrial integration effect | 0.2907 | Industrial chain extension | 0.1938 | Proportion of output value of characteristic industries in regional GDP | 0.1292 | |
| Ratio of the number of farmers driven by characteristic industrial management organizations | 0.0646 | |||||
| Industrial function expansion | 0.0969 | Characteristic product processing conversion rate | 0.0323 | |||
| Network sales of featured products | 0.0646 | |||||
| Rural development benefits | Effect of rural social development | 0.0905 | Infrastructure | 0.0452 | Perfection of infrastructure | 0.0226 |
| road accessibility | 0.0226 | |||||
| Public service facilities | 0.0452 | Perfection of public facilities | 0.0226 | |||
| Internet broadband coverage | 0.0226 | |||||
| Farmers’ living standard | 0.1365 | Increase farmers’ income | 0.091 | Annual income of the village collective | 0.0607 | |
| Increment of operating income per household | 0.0303 | |||||
| Labor return | 0.0455 | Proportion of innovation and entrepreneurship personnel returning to the countryside in the total number | 0.0114 | |||
| Proportion of people engaged in characteristic industries in the total employment | 0.0341 | |||||
Table 2 Overall scores of rural characteristic industry development in the Xi’an Metropolitan Area |
| Expectation performance | Target layer | Criterion layer | Score | Total score | |
|---|---|---|---|---|---|
| Industrial development benefits | Industrial development effect | Production benefit | 0.3810 | 0.7777 | 0.7124 |
| Economic performance | 0.3960 | ||||
| Industrial integration effect | Industrial chain extension | 0.4090 | 0.6470 | ||
| Industrial function expansion | 0.2380 | ||||
| Rural development benefits | Effect of rural social development | Infrastructure | 0.2811 | 0.5257 | 0.4637 |
| Public service facilities | 0.2446 | ||||
| Farmers’ living standard | Increase farmers’ income | 0.1707 | 0.4017 | ||
| Labor return | 0.2310 | ||||
| Overall performance level | 0.5880 | ||||
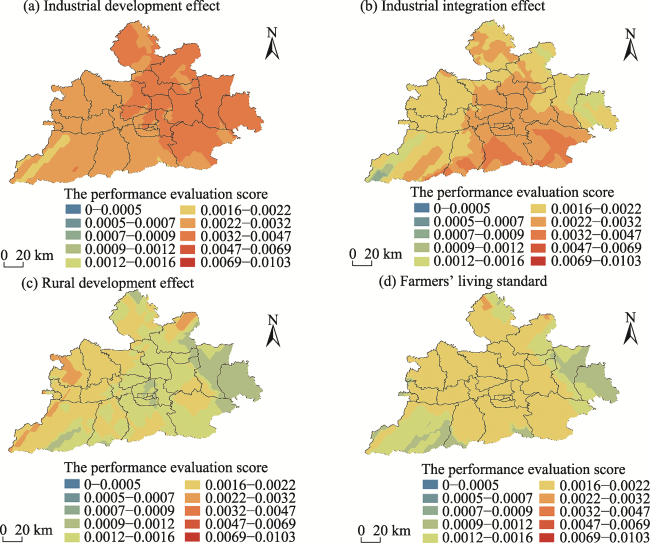
Fig. 2 Spatial distribution of the performance evaluation scores of rural characteristic industries in the Xi’an Metropolitan Area |
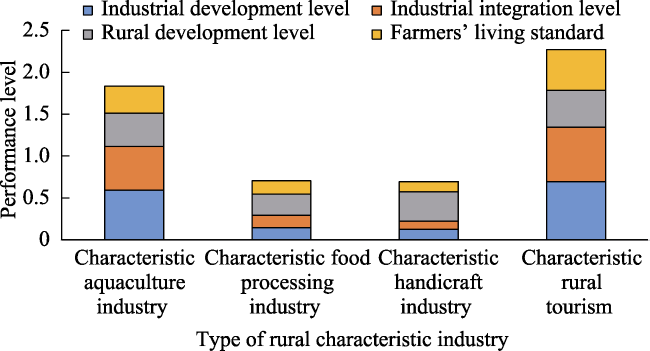
Fig. 3 Comparison of the performance levels of different types of rural characteristic industries |
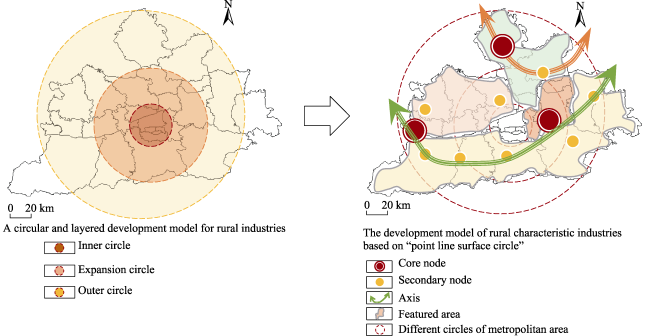
Fig. 4 Schematic diagram of spatial mode transformation of rural characteristic industry development in the metropolitan area |
| [1] |
|
| [2] |
|
| [3] |
|
| [4] |
|
| [5] |
|
| [6] |
|
| [7] |
|
| [8] |
|
| [9] |
|
| [10] |
|
| [11] |
|
| [12] |
|
| [13] |
|
| [14] |
Research Group of the National Development and Reform Commission Macroeconomics Institute and the Department of Agricultural Economics. 2016. Research on promoting the integration and development of China’s rural primary, secondary, and tertiary Industries. Economic Research Reference, (4): 3-28. (in Chinese)
|
| [15] |
|
| [16] |
|
| [17] |
|
| [18] |
|
| [19] |
|
| [20] |
|
| [21] |
|
| [22] |
|
| [23] |
|
| [24] |
|
| [25] |
|
| [26] |
|
| [27] |
|
/
| 〈 |
|
〉 |