
Journal of Resources and Ecology >
Identifying Priority Areas for Ecological Restoration based on GIS: A Case Study of Xiushui County, China
|
XIE Hualin, E-mail: xiehl_2000@163.com |
Received date: 2023-04-02
Accepted date: 2023-05-09
Online published: 2023-08-02
Supported by
The National Natural Science Foundation of China(41971243)
The National Natural Science Foundation of China(41961035)
The Key Project of Jiangxi Natural Science Foundation(20202ACB203004)
The 68th Batch of China Postdoctoral Science Foundation Funding(2020M682106)
The 14th Batch of Jiangxi Postdoctoral Science Foundation Special Funding(2020KY29)
Integrating the landscape pattern holistically and identifying priority areas for ecological restoration scientifically are the key challenges of national land space planning and ecological protection. Taking Xiushui County, a fragile ecological region in the south, as an example, this study established an evaluation index system based on the pattern-process principle, including the importance of ecosystem services and ecosystem sensitivity, and explored regional priority areas for ecological restoration through GIS spatial analysis technology. The results show that the ecological restoration priority area in the case study area is 2880.64 km2 in total, covering 63.93% of the overall area. Of that amount, 367.55 km2 is the bottom-line priority areas for ecological restoration, accounting for 8.16%. Regarding land use types within the major ecological restoration priority area, the arable land and construction land areas are 210.83 km2 and 122.52 km2, covering 55.35% and 51.43% of the overall area, respectively. Determining the priority areas at different levels can help decision-makers to prioritize the restoration needs of degraded areas and provide a basis for adopting targeted ecological restoration measures for areas with different degrees of degradation. Identifying priority areas also provides basic information for the protection and construction of the eco-security pattern of the territorial space, which is vital for improving the regional ecological environmental safety and building a harmonious community between humans and nature.
XIE Hualin , SHENG Meiqi , HE Yafen , ZOU Pinjian . Identifying Priority Areas for Ecological Restoration based on GIS: A Case Study of Xiushui County, China[J]. Journal of Resources and Ecology, 2023 , 14(5) : 1015 -1025 . DOI: 10.5814/j.issn.1674-764x.2023.05.012
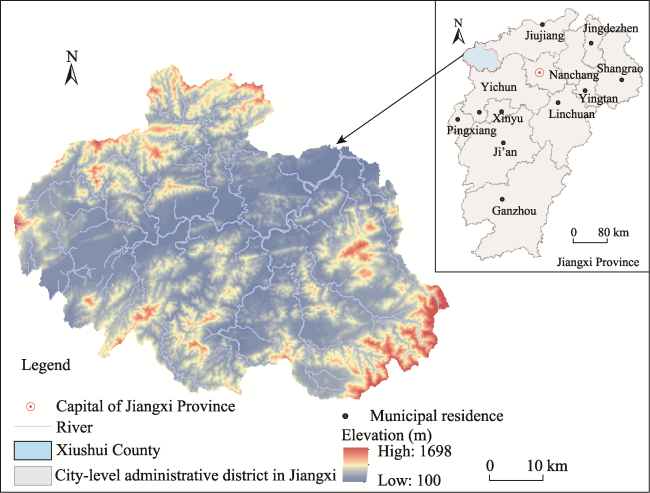
Fig. 1 The study area |
Table 1 Flood sensitivity evaluation index system and weights |
| Evaluation factor | Insensitive | Generally sensitive | Moderately sensitive | Sensitive | Extremely sensitive |
|---|---|---|---|---|---|
| River and lake buffer zone distance (m) | ≥20 | 15-20 | 10-15 | 5-10 | ≤5 |
| Flooded area scope (m) | ≥120 | 115-120 | 110-115 | 105-110 | ≤105 |
| Grading assignment | 1 | 3 | 5 | 7 | 9 |
Table 2 Geological hazard sensitivity evaluation index system and weight |
| Evaluation factor | Insensitive | Generally sensitive | Moderately sensitive | Sensitive | Extremely sensitive |
|---|---|---|---|---|---|
| Elevation (m) | <50 | 50-100 | 100-200 | 200-500 | >500 |
| Vegetation cover | >0.8 | 0.6-0.8 | 0.4-0.6 | 0.2-0.4 | 0-0.2 |
| Slope (°) | <5 | 5-10 | 10-15 | 15-25 | >25 |
| Topographic relief (m) | <20 | 20-50 | 50-100 | 100-300 | >300 |
| Human activity intensity | Woodland, high cover grassland, lake, beach, mudflat | Reservoir pit, wetland, other unutilized land | Low and medium cover grassland, cultivated land, bare land | Rural residential area, other construction land | Urban, industrial and mining construction land |
| Grading assignment | 1 | 3 | 5 | 7 | 9 |
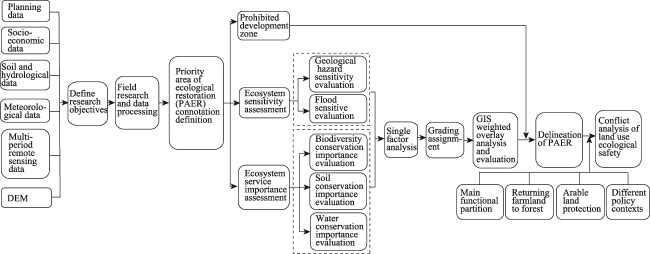
Fig. 2 Ecological restoration priority area identification framework |
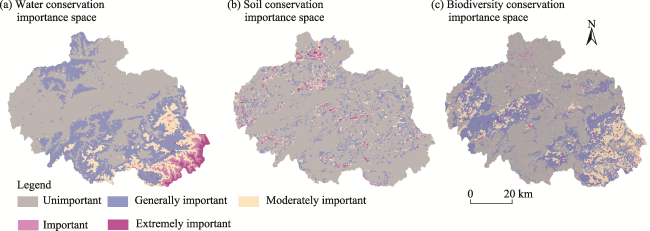
Table 3 The ecological importance space of the case study area |
| Evaluation factor | Importance level | Area (km2) | Percentage (%) | Cumulative percentage (%) |
|---|---|---|---|---|
| Water conservation importance space | Unimportant | 2642.32 | 58.68 | 58.68 |
| Generally important | 1202.69 | 26.71 | 85.39 | |
| Moderately important | 607.94 | 13.50 | 98.89 | |
| Important | 26.60 | 0.59 | 99.48 | |
| Extremely important | 23.28 | 0.52 | 100.00 | |
| Soil conservation importance space | Unimportant | 3292.66 | 73.12 | 73.12 |
| Generally important | 723.71 | 16.07 | 89.20 | |
| Moderately important | 317.86 | 7.06 | 96.26 | |
| Important | 133.19 | 2.96 | 99.21 | |
| Extremely important | 35.41 | 0.79 | 100.00 | |
| Biodiversity conservation importance space | Unimportant | 2426.44 | 53.89 | 53.89 |
| Generally important | 1392.68 | 30.93 | 84.82 | |
| Moderately important | 442.03 | 9.82 | 94.63 | |
| Important | 157.25 | 3.49 | 98.12 | |
| Extremely important | 84.43 | 1.88 | 100.00 |
Fig. 3 Ecological importance space distributions |
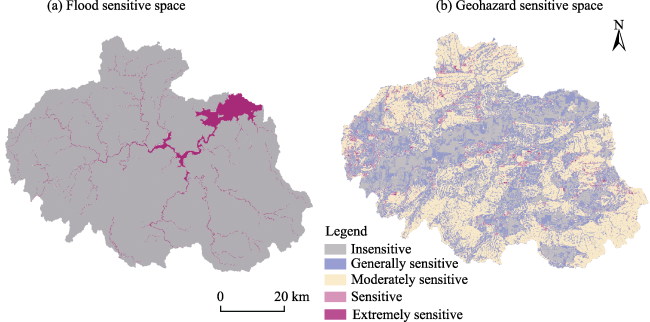
Table 4 The ecological sensitivity space of the case study area |
| Evaluation factor | Sensitivity level | Area (km2) | Percentage (%) | Cumulative percentage (%) |
|---|---|---|---|---|
| Flood sensitive space | Insensitive | 4260.91 | 94.56 | 94.56 |
| Generally sensitive | 18.37 | 0.41 | 94.97 | |
| Moderately sensitive | 17.32 | 0.38 | 95.36 | |
| Sensitive | 17.92 | 0.40 | 95.75 | |
| Extremely sensitive | 191.32 | 4.25 | 100.00 | |
| Geohazard sensitive space | Insensitive | 968.10 | 21.51 | 21.51 |
| Generally sensitive | 1385.22 | 30.78 | 52.30 | |
| Moderately sensitive | 1981.10 | 44.03 | 96.32 | |
| Sensitive | 118.49 | 2.63 | 98.96 | |
| Extremely sensitive | 46.90 | 1.04 | 100.00 |
Fig. 4 Ecological sensitive space distributions |
Table 5 Identification of the ecological restoration priority areas in the case study area |
| Ecological restoration priority area type | Area (km2) | Percentage (%) | Cumulative percentage (%) |
|---|---|---|---|
| Non-ecological restoration priority area | 1625.50 | 36.07 | 36.07 |
| Buffer ecological restoration priority area | 2133.48 | 47.35 | 83.42 |
| Crisis ecological restoration priority area | 379.61 | 8.42 | 91.84 |
| Bottom-line ecological restoration priority area | 367.55 | 8.16 | 100.00 |
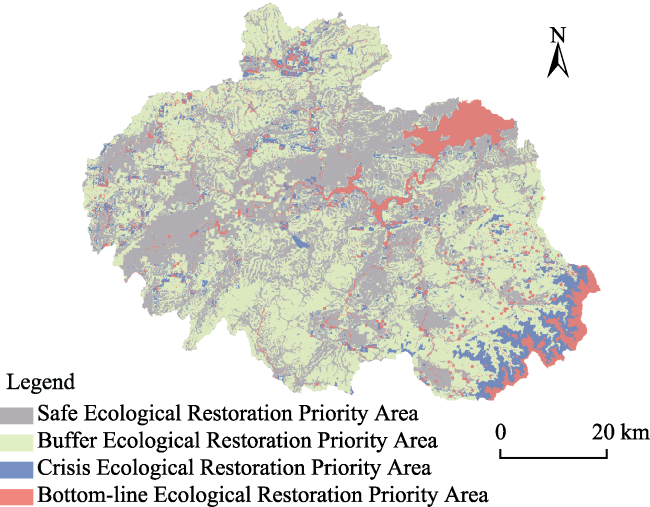
Fig. 5 Distribution of ecological restoration priority area types |
Table 6 Current land use representing an ecological safety conflict zone |
| Ecological restoration priority area type | Construction land | Arable land | ||
|---|---|---|---|---|
| Area (km2) | Percentage (%) | Area (km2) | Percentage (%) | |
| Non-ecological restoration priority area | 98.84 | 44.65 | 199.11 | 48.57 |
| Buffer ecological restoration priority area | 52.00 | 23.49 | 112.90 | 27.54 |
| Crisis ecological restoration priority area | 21.48 | 9.70 | 42.91 | 10.47 |
| Bottom-line ecological restoration priority area | 49.04 | 22.15 | 55.02 | 13.42 |
| Total | 221.36 | 1 | 409.94 | 1 |
| [1] |
|
| [2] |
|
| [3] |
|
| [4] |
|
| [5] |
|
| [6] |
|
| [7] |
|
| [8] |
|
| [9] |
|
| [10] |
|
| [11] |
|
| [12] |
|
| [13] |
|
| [14] |
|
| [15] |
|
| [16] |
|
| [17] |
|
| [18] |
|
| [19] |
|
| [20] |
|
| [21] |
|
| [22] |
|
| [23] |
|
| [24] |
|
| [25] |
|
| [26] |
|
| [27] |
|
| [28] |
|
| [29] |
|
| [30] |
|
| [31] |
|
| [32] |
|
| [33] |
|
| [34] |
|
| [35] |
|
| [36] |
|
| [37] |
|
/
| 〈 |
|
〉 |