Impact of Human Activities on Ecosystem

Spatio-temporal Evolution and Influencing Factors of Cultural and Leisure Venues in Beijing

  • WU Liyun , 1, 2 ,
  • LI Ying 1, 2 ,
  • XU Jiayang 1, 2 ,
  • YAN Zhixin 1, 2 ,
  • CHANG Mengqian 3 ,
  • XIA Bing , 4, *
Expand
  • 1. China Academy of Culture and Tourism, Beijing International Studies University, Beijing 100024, China
  • 2. School of Tourism Science, Beijing International Studies University, Beijing 100024, China
  • 3. China CYTS Tours Holding Co., Ltd, Beijing 100007, China
  • 4. Institute of Geographic Sciences and Natural Resources Research, Chinese Academy of Sciences, Beijing 100101, China
*XIA Bing, E-mail:

WU Liyun, E-mail:

Received date: 2022-10-25

  Accepted date: 2023-01-05

  Online published: 2023-08-02

Supported by

The Key Project of Beijing Social Science Fund(20JCB081)

Abstract

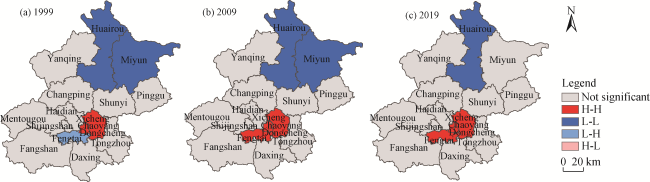
With the continuous growth of China's national economy, the people's spiritual and cultural consumption needs are strong. Cultural and leisure venues are one of the most important spaces for meeting people’s increasing needs for a better life. Taking 5625 cultural and leisure venues in Beijing as the research object, we analyzed the spatial and temporal distribution characteristics of the cultural and leisure venues in Beijing from 1994-2019, and the factors influencing them, by using the analysis methods of barycentric coordinates, standard deviation ellipse, kernel density analysis, spatial autocorrelation and Geodetector. The results show four main aspects of this system. (1) The spatial distribution of cultural and leisure venues in Beijing is uneven and shows a “core-edge” pattern. In the long run, there has been a tendency for cultural and leisure venues to spread into the northern and southern suburbs. (2) Beijing’s cultural and leisure venues have evolved from a “single-core cluster” in the central city to a “dual-core coexistence” in both the central city and Tongzhou District, in addition to a spatial trend of spreading throughout the whole city. (3) Located in the central city, Xicheng, Dongcheng, Chaoyang and Fengtai form the HH agglomeration of cultural and leisure venues in Beijing, while Huairou and Miyun constitute the LL agglomeration. (4) The spatial distribution of cultural and leisure venues in Beijing is affected by many factors, such as the economy, population, transportation, education and policies, and the main driver is changing from a combination of “economy” and “demand” to the single factor of “economy”.

Cite this article

WU Liyun , LI Ying , XU Jiayang , YAN Zhixin , CHANG Mengqian , XIA Bing . Spatio-temporal Evolution and Influencing Factors of Cultural and Leisure Venues in Beijing[J]. Journal of Resources and Ecology, 2023 , 14(5) : 1001 -1014 . DOI: 10.5814/j.issn.1674-764x.2023.05.011

1 Introduction

“Beijing’s medium and long-term plan for promoting the construction of a national cultural center (2019-2035)” proposes to accelerate the implementation of the “cultural business district” plan, which aims to build a number of new cultural and leisure spaces. Cultural leisure is a basic lifestyle component of modern people, while cultural leisure spaces are the third space of the city and the carrier of public leisure (Chen, 2012; Zhang, 2012). As Beijing is a national cultural center and one of the most active cities for cultural leisure, it is important to examine the spatial and temporal distribution characteristics and factors influencing the cultural leisure spaces in order to scientifically summarize the rules governing the distribution of cultural leisure spaces. This information is crucial for promoting the optimal layout and scientific development of cultural leisure spaces in Beijing, and even other cities in China, in order to meet people’s high-quality cultural leisure needs.
Leisure and entertainment activities have become an important part of the people’s daily life in China (Zhou et al., 2022). In order to meet the growing demand of consumers for cultural and leisure activities, various cultural and leisure facilities and venues have emerged, which not only promotes regional economic development, but also changes the structure of consumers’ cultural and entertainment expenditure and promotes the release of people’s leisure needs (Gul et al., 2018). The continuous improvement of both the urban cultural and leisure functions and the cultural and leisure environment is an important consideration for future urban development (Jia et al., 2019).
Research on cultural and leisure venues at home and abroad has focused on three aspects: 1) The impact of cultural and leisure venue construction on regional economic development from the perspective of industrial value (Dewenter and Westermann, 2003; Hobikoğlu and Çetinkaya, 2015); 2) The changes of cultural consumption patterns and their influencing factors from the perspective of consumption demand (Beyers, 2008; Chen, 2012); and 3) The spatial distribution patterns of cultural leisure places and their influencing factors from the perspective of spatial development (Aoyama, 2007). Regarding the research on the spatial distribution and influencing factors of cultural and leisure places, some scholars have studied the spatial distribution characteristics of cultural and leisure places such as museums, cinemas, bars and teahouses in a specific geographical scope. These studies have found that there are various spatial distribution characteristics such as random clustering (Cheng et al., 2012), clustering of universities and residential areas (Yu and Feng, 2009), clustering of the central city and traffic arteries (He et al., 2014; Liu et al., 2020), clustering of business districts (Yang et al., 2018), etc. Resources, policies, the economy, population, traffic and distance from the city center have emerged as the most important factors affecting the distribution of cultural and leisure venues (Zhuang et al., 2020; Meng et al., 2022). However, the existing studies have several shortcomings. From the viewpoint of research objects, there are more studies on a single type of cultural and leisure facility, but fewer comprehensive studies on multiple types of cultural and leisure facilities. From the viewpoint of research methods, many studies provide a static analysis of the spatial patterns of cultural and leisure facilities and the factors governing their formation, but fewer studies have examined their spatial and temporal evolution patterns and influencing factors from a dynamic perspective. In terms of research space, most studies focus on urban centers in the city, but there is lack of studies on cultural and leisure venues in suburban areas.
To overcome these shortcomings, this study takes the Beijing city area as the scope, including the central city and suburban areas, and examines the spatial and temporal distribution characteristics and influencing factors from 1994 to 2019 for four types of cultural and leisure venues, namely, cultural performance viewing venues, cultural recreation venues, cultural activity venues, and cultural entertainment venues, as the research objects. This study uses ArcGIS software and the geographic probe method in order to analyze the law governing the construction of cultural and leisure venues in Beijing, to provide a scientific basis and theoretical reference for the spatial layout of the cultural and leisure industry in Beijing, and to promote its high-quality development.

2 Research region and method

2.1 Research area

Beijing is the cultural center of China, and the city with the strongest cultural and leisure consumption. It consists of 16 districts with a total area of 16410 km2. In 2019, there were 261 museums of various types, 241 bars, 238 theaters of various types, and various categories of cultural and leisure venues in Beijing.

2.2 Data sources and processing

Drawing on the content logic of the “Classification of Culture and Related Industries (2018)” released by the National Bureau of Statistics, Beijing’s cultural and leisure venues were creatively grouped into four categories: 1) Cultural performance viewing venues, cultural recreation venues, cultural activity venues, and cultural entertainment venues, etc., where cultural performance venues include theaters, opera and dance theaters, and other various performance places; 2) Cultural recreation sites include cultural scenic spots, museums, art galleries, former residences of famous people, etc.; 3) Cultural activity sites include libraries, bookstores, cultural squares, art activity and creation centers, etc.; and 4) Cultural entertainment sites include bars, tea bars, book bars, clubs and other modern cultural leisure spaces. Using Python technology to search for the four types of cultural and leisure venues in Beijing by category in Amap, a total of 7808 venue information listings were obtained. After manual screening, the duplicate points and the points that do not belong to the above four types of cultural and leisure venues were removed, and 5625 items of cultural leisure place information were finally obtained. Using the picking tool of Amap to obtain the coordinate information of the above points, the information on the time of establishment of the above leisure places was crawled on platforms such as qcc.com, Tianyanchan.com, Baidu Encyclopedia and Wikipedia. The number of cultural leisure places in each year was determined based on the establishment time of various cultural leisure places, and finally, the 5625 valid data points are shown in Fig. 1. The data of GDP per capita, population density, road network density and school students were obtained from the “Beijing Regional Statistical Yearbook”, and the policy data were obtained from the work reports of Beijing and each district government, as well as relevant official websites.
Fig. 1 Distribution maps of the four basic types of cultural and leisure venues in Beijing

2.3 Research methods

2.3.1 Geographic barycentric coordinates

Geographic barycentric coordinates were used to reflect the central spatial location of leisure and cultural venues in a specific region. Assuming that a large region consists of n small regions, (xi, yi) is the center coordinate of the i-th region, ${{u}_{i}}$ is some attribute value and weight of region i, and ${{M}_{i}}\left( {{x}_{i}},{{y}_{i}} \right)$ is the center of gravity coordinate of the whole region (Wang et al., 2017), then the formula is as follows:
${{M}_{i}}\left( {{x}_{i}},{{y}_{i}} \right)=\left( \frac{\sum\limits_{i=1}^{n}{{{u}_{i}}{{x}_{i}}}}{\sum\limits_{i=1}^{n}{{{u}_{i}}}},\frac{\sum\limits_{i=1}^{n}{{{u}_{i}}{{y}_{i}}}}{\sum\limits_{i=1}^{n}{{{u}_{i}}}} \right)$

2.3.2 Standard deviation ellipse

The standard deviation ellipse mainly consists of the mean center $\left( \left\{ \bar{X},\bar{Y} \right\} \right)$, long semi-axis (Ex), short semi-axis (Ey) and azimuthal angle (θ ) elements, which mainly reveal the central, discrete and directional trends of the spatial distribution (Yang et al., 2018). Their formulas are as follows:
${{E}_{x}}=\sqrt{\frac{\sum\limits_{i=1}^{n}{{{\left( {{x}_{i}}-\bar{X} \right)}^{2}}}}{n}}$
${{E}_{y}}=\sqrt{\frac{\sum\limits_{i=1}^{n}{{{\left( {{y}_{i}}-\bar{Y} \right)}^{2}}}}{n}}$
$\begin{align} & \tan \theta = \\ & \frac{\left( \sum\limits_{i=1}^{n}{\tilde{x}_{i}^{2}}-\sum\limits_{i=1}^{n}{\tilde{y}_{i}^{2}} \right)+\sqrt{{{\left( \sum\limits_{i=1}^{n}{\tilde{x}_{i}^{2}}-\sum\limits_{i=1}^{n}{\tilde{y}_{i}^{2}} \right)}^{2}}+4{{\left( \sum\limits_{i=1}^{n}{{{{\tilde{x}}}_{i}}{{{\tilde{y}}}_{i}}} \right)}^{2}}}}{2\sum\limits_{i=1}^{n}{{{{\tilde{x}}}_{i}}{{{\tilde{y}}}_{i}}}} \\ \end{align}$
In the formulas, n is the number of cultural and leisure venues in Beijing, ${{x}_{i}}$ and ${{y}_{i}}$ are the coordinates of cultural and leisure venue i, ${{\tilde{x}}_{i}}$ and ${{\tilde{y}}_{i}}$ are the long and short axis directional distances from the ith cultural and leisure place to the mean center. The long half-axis indicates the dispersion of cultural and leisure venues in the main direction, while the short half-axis indicates the dispersion of cultural and leisure venues in the secondary direction.

2.3.3 Kernel density analysis

Kernel density analysis is mainly used to calculate the density of elements in their surrounding neighborhoods, reflecting the relative concentration of the spatial distribution of cultural and leisure venues (Wu et al., 2022). Its formula is:
$f\left( x \right)=\frac{1}{nh}\underset{i=1}{\overset{n}{\mathop \sum }}\,k\left( \frac{x-{{x}_{i}}}{h} \right)$
In this formula, f(x) is the kernel density function, h is the bandwidth greater than zero, n is the number of cultural and leisure venues within the bandwidth, k(*) is the spatial weighting function, and (xxi) is the Euclidean metric between estimated point x and sample point xi.

2.3.4 Spatial autocorrelation

Spatial autocorrelation is an important tool used to study the correlations between different spatial segments, which mainly reveals the evolutionary characteristics of spatial patterns in two dimensions: global and local (Feng et al., 2018). Global spatial autocorrelation mainly examines the overall spatial correlation and regional variability of cultural and leisure venues, which is usually expressed by Moran’s I (Li et al., 2017). The calculation formula is:
$Moran's\begin{matrix} {} \\ \end{matrix}I=\frac{\sum\limits_{i=1}^{n}{\sum\limits_{j=1}^{n}{{{W}_{ij}}\left( {{X}_{i}}-\bar{X} \right)\left( {{X}_{j}}-\bar{X} \right)}}}{{{S}^{2}}\sum\limits_{i=1}^{n}{\sum\limits_{j=1}^{n}{{{W}_{ij}}}}}$
In the formula, S2 is the discrete variance of Xi, n is the number of spatial units, and Xi, Xj are the number of cultural and leisure sites in i and j. Wij is the spatial weight matrix, and Wij takes a value of 1 if spatial units i and j have a common boundary, otherwise it is 0. The global Moran’s I takes values in the range of [-1, 1]. When Moran’s I > 0, it means that the distribution of regional cultural and leisure venues is spatially positively correlated; when Moran’s I < 0, it means that there is negative autocorrelation in the spatial distribution of cultural and leisure venues; and when Moran’s I = 0, it means that the distribution is spatially uncorrelated and the venues are more loosely distributed.
The Local Indictors of Spatial Association (LISA) is used to measure the correlation between local units and neighboring units in a region, and it can reflect local spatial differences through visualization (Wang et al., 2017). The formula is:
${{I}_{i}}=\frac{{{Y}_{i}}-\bar{Y}}{{{S}^{2}}}\underset{j=1}{\overset{n}{\mathop \sum }}\,{{W}_{ij}}\left( {{Y}_{i}}-\bar{Y} \right)$
The meanings of the variables are the same as above. The local Moran’s I takes values in the range of [-1, 1]. The study area can be divided into four types according to their values: High-High type (H-H), Low-Low type (L-L), High-Low type (H-L), and Low-High type (L-H). The H-L and L-H types indicate that the distribution of cultural and leisure venues in Beijing is dispersed and heterogeneous.

2.3.5 Geodetector

Geodetector is a tool for detecting and exploiting spatial differentiation, and it explains the degree of influence of the detection factor on the spatial differentiation of the attributes of a given element (Wang and Xu, 2017). The formula is as follows:
$q=1-\frac{1}{N{{\sigma }^{2}}}\underset{h=1}{\overset{L}{\mathop \sum }}\,{{N}_{h}}\sigma _{h}^{2}$
where q is the detection value; and L is the stratification of variable Y or factor X, i.e., classification or partitioning. N and Nh are the numbers of cells in the whole region and type h, and ${{\sigma }^{2}}\ \text{and}\ \sigma _{h}^{2}$ are the variances of Y values for the whole region and stratum h, respectively. The value range of q is [0,1], and a larger q value indicates more pronounced spatial heterogeneity of Y. If the stratification is generated by X, a larger q value indicates a stronger explanatory power of X on Y.

3 Spatio-temporal distribution characteristics and the evolution of cultural and leisure venues in Beijing

3.1 Temporal evolution of cultural and leisure venues

From 1994 to 2019, the number of cultural and leisure venues in Beijing grew rapidly from 434 to 5625, and leisure places experienced rapid growth. In the past 25 years, the growth of cultural and leisure venues in Beijing has gone through three stages: exploring and starting, steadily improving and rapidly taking off (Fig. 2 and Fig. 3). From 1994 to 1999, the number of cultural and leisure venues in Beijing increased from 434 to 542, for an average annual growth rate of 4.54%, so the expansion of cultural and leisure venues in Beijing was still in the stage of “exploring and starting”. At that time, both the growth volume and the growth rate were relatively small, and cultural and leisure options had not yet become the daily leisure demand of Beijing residents. In terms of the composition of the places, museums and art museums became the most important cultural leisure places at that time, with the highest percentage of 64%. During this period, the supply of public cultural and leisure facilities was relatively abundant, but the development of market-oriented cultural and leisure facilities was slow. In terms of spatial distribution, Beijing’s cultural and leisure facilities showed a distinctive “core concentration” characteristic, with 42% of the cultural and leisure facilities in the eastern and western districts alone, and only 23% in the ten suburban districts.
Fig. 2 Changes in the number of cultural and leisure venues in each of the different districts of Beijing from 1994 to 2019
Fig. 3 Quantitative changes in the types of cultural leisure places in Beijing from 1994 to 2019
From 2000 to 2009, Beijing’s cultural and leisure venues entered the “steadily improving” stage. During this period, the number of cultural and leisure venues in Beijing grew steadily from 542 to 1640, for an average annual growth rate of 11.71%. The internal structure of the cultural and leisure venues was optimized, and the number of cultural activities, cultural entertainment and cultural performance venues grew rapidly, with these three categories accounting for 27%, 17% and 16%, respectively, in 2009. The spatial distribution of cultural and leisure venues continued to be optimized, and cultural and leisure venues began to spread from the core urban areas to the periphery. Haidian and Chaoyang overtook Dongcheng and Xicheng to become the two districts with the largest number of cultural and leisure venues, accounting for 36%. The proportion of cultural and leisure venues in the ten suburbs rose to 30%, and the balance in the spatial distribution improved.
From 2010 to 2019, Beijing’s cultural and leisure venues entered a period of “rapidly taking off”, with the number of venues increasing by 2.43-fold, from 1640 to 5625. In 2010, the Outline of the Twelfth Five-Year Plan for National Economic and Social Development of Beijing first proposed cultural and leisure spaces and leisure and cultural districts, bringing the cultural and leisure venues to an unprecedented level. Since then, documents promoting the development of cultural and leisure venues, such as “Opinions of Beijing Municipal People’s Government on Further Strengthening Grassroots Public Culture Construction”, “Opinions of the CPC Beijing Municipal Committee on Playing the Role of a Cultural Center to Accelerate the Construction of a Socialist Advanced Culture Capital with Chinese Characteristics” and “Implementation Opinions on Fostering the Expansion of Service Consumption and Optimizing and Upgrading Commodity Consumption”, have been issued one after another, leading to great leaps in the development of cultural and leisure venues in Beijing. The internal structure and spatial distribution of cultural and leisure venues in Beijing are being continuously optimized. The proportion of cultural recreation and leisure venues, which represents the supply of public cultural and leisure services, continued to decline from 41% in 2009 to 35% in 2019. The market-oriented cultural and leisure venues grew rapidly. In particular, the cultural and recreational leisure venues representing the new cultural and leisure way of residents are growing the fastest and becoming an important direction for the upgrading and development of the leisure industry. From 1994 to 2019, the number of cultural entertainment and leisure venues grew 198-fold, from 8 to 1595, accounting for 28% of all cultural and leisure venues. The spatial distribution of cultural and leisure venues was further optimized, with the proportion of cultural and leisure venues in suburban areas increasing to 37% and the imbalance in the distribution between central urban areas and suburban areas weakened further.

3.2 Spatial evolution characteristics of the cultural and leisure places in Beijing

3.2.1 Spatial distribution characteristics of cultural and leisure venues

Using ArcGIS 10.2 spatial analysis, the center of gravity and standard deviation ellipse analysis were conducted for the cultural and leisure venues in Beijing in 1999, 2009 and 2019 (Fig. 4). From 1999 to 2019, the spatial distribution of cultural and leisure venues in Beijing showed a direction of “northeast-southwest”, and the angle of rotation θ experienced a process of “increasing-decreasing-increasing”, with a counterclockwise deflection, indicating that the trend of cultural and leisure venues in Beijing was to spread north-south. The elliptical flatness of the standard deviation increased from 0.25 in 1999 to 0.30 in 2019, indicating that the spatial extent of cultural and leisure venues in Beijing was gradually spreading in the direction of “northwest- southeast”.
Fig. 4 Distribution center of gravity and standard deviation ellipse of the cultural and leisure venues in Beijing
From 1999 to 2019, the center of gravity of Beijing’s cultural and leisure activities moved to the east and north, with the center of gravity moving from Xicheng District to Dongcheng District, and then to the border between Dongcheng District and Chaoyang District. From 1999 to 2009, Dongcheng and Xicheng were the core concentration areas of the cultural and leisure venues in Beijing, and the center of gravity was located in these two districts. Since then, the construction of cultural and leisure venues in Haidian and Chaoyang has accelerated, and Chaoyang District in particular has created a series of modern cultural and leisure clusters such as 798 Art District, Songzhuang Art District, 751 Art District and Sanlitun Bar Street, which have become the main driving force behind the eastward shift in the center of gravity of cultural and leisure venues. The northern suburbs are spatially clustered at the junctions of many districts along the “east-west” direction, and the center of gravity has been located at the junction of Shunyi and Huairou due to policies such as the construction of cultural and creative industry clusters and characteristic towns in Shunyi District and the construction of film and television, tourism and leisure clusters in Huairou District. The southern suburbs are spatially clustered along the “northeast-southwest” direction, and the center of gravity there has been shifting eastward from the junction of Fengtai and Daxing to the junction of Chaoyang and Daxing, as influenced by the development of the cultural and leisure industry clusters such as bars and cultural and creative industries in Chaoyang District. In general, culture and leisure construction has become the consensus of more districts. With the improvement in the overall economic development level of Beijing, its suburban areas are also accelerating to catch up with the central urban areas in the construction of cultural and leisure venues, so the number of cultural and leisure venues has been rapidly increasing.

3.2.2 Kernel density analysis of cultural and leisure venues

Using ArcGIS 10.2 kernel density analysis, a kernel density distribution map of the cultural and leisure venues in Beijing was generated (Fig. 5) and used to analyze the spatial clustering of the cultural and leisure venues in Beijing. The spatial structure of the cultural and leisure venues in Beijing shows a “core-edge” structure that is mainly concentrated in the central city, and the “single-core” clustering trend is closely related to the developed economy, concentrated resources, population concentration, and stronger demand for cultural consumption in the central city. In terms of temporal evolution, Beijing’s cultural and leisure venues are evolving from “single-core clustering” to “dual-core co-existence”, and the “core-edge” structure shows a spreading tendency. From 1999 to 2019, the high-density core area expanded from the Dongcheng and Xicheng districts to the six central urban areas, and Chaoyang District became an important core area. Tongzhou District forms one sub-density core area, which is closely related to the relocation of some cultural institutions that was brought about by the eastward relocation of the Beijing Municipal Government, the development of art towns such as Songzhuang and Taihu, and the opening of Beijing Universal Resorts, which is expected to become the new center of culture and leisure in Beijing.
Fig. 5 Kernel density of the cultural and leisure venues in Beijing

3.2.3 Spatial autocorrelation analysis of the cultural and leisure venues in Beijing

The global autocorrelation analysis (Table 1) and local spatial autocorrelation analysis were conducted on the spatial distribution of cultural and leisure venues in Beijing using ArcGIS 10.2. The results showed that the global Moran’s I in 1999 and 2009 were 0.43 and 0.33, with P-values less than 0.01 and Z-values greater than 2.58, so they passed the 1% significance test. The global Moran’s I in 2019 was 0.22, with a P-value less than 0.05 and a Z-value greater than 1.68, so it passed the 5% significance test. Therefore, the spatial distribution of cultural and leisure venues in Beijing has positive autocorrelation characteristics and shows a spatial clustering of cultural and leisure venues. Over time, however, the spatial clustering posture of cultural and leisure venues has decreased and the trend of the spatially discrete distribution of cultural and leisure venues has grown. This indicates that the spatial distribution of cultural and leisure venues in Beijing is improving in a balanced way, and there is a trend of spreading in the distribution of cultural and leisure venues throughout the whole city.
Table 1 Global Moran’s I and check values of cultural and leisure venues of Beijing in 1999, 2009 and 2019
Year Moran’s I P-value Z-value
1999 0.43 0.003 3.4167
2009 0.33 0.008 2.8092
2019 0.22 0.016 2.4275
The LISA agglomeration map of cultural and leisure venues in Beijing at the 5% significant level was explored by local spatial autocorrelation analysis and using 1999, 2009 and 2019 as the sample time points (Fig. 6). The results show that three agglomerations of HH, LH and LL were formed in the local spatial autocorrelation of the significant areas of cultural and leisure venues in Beijing.
Fig. 6 The LISA cluster map of cultural and leisure venues in Beijing
The Dongcheng, Xicheng and Chaoyang districts of Beijing have clusters of Beijing’s cultural centers, theaters, cultural and museum venues, performance centers and cultural scenic spots. They represent the HH type agglomerations of Beijing’s cultural and leisure venues. In 1999, Fengtai District was the only LH type agglomeration, and compared with the nearby HH districts of Dongcheng, Xicheng and Chaoyang, the cultural and leisure depression characteristics of Fengtai district were relatively prominent. In 2008, Fengtai District issued the “Industrial Development Guidance Fund Management Measures” to support cultural and creative enterprises with 50 million yuan per year, which accelerated the agglomeration of its cultural and creative industries. Correspondingly, in 2009 and 2019, Fengtai District entered the HH type agglomeration. In 1999 and 2009, the LL agglomeration mainly included Huairou and Miyun districts, and in 2019, the LL type agglomeration mainly focused on Huairou. Compared with the central urban area, Huairou and Miyun districts in the northern suburbs and their surrounding districts of Pinggu, Yanqing, Shunyi and Changping each have a certain number of cultural and leisure venues, but their overall development represents a relatively low-level area. In general, the differences in the development policies, economic development levels and consumption demands of the cultural and leisure industries in the different districts have caused some changes in the high and low values, but the local spatial pattern has not changed very much, and the distinction between the “highlands” and “lowlands” of culture and leisure in Beijing is clear.

4 Analysis of the factors influencing the spatial distribution of cultural and leisure venues in Beijing

The cultural and leisure industry is a reflection of the vitality and economic strength of the city (Loyd and Clark, 2004), and its spatial distribution is influenced by multiple factors such as the economy, population, transportation, and policies (Gan et al., 2020). Economic development influences the distribution of cultural and leisure venues, resulting in a nodal agglomeration state (Hutton, 2004). The degree of population agglomeration determines the robustness of consumer demand, which is a natural factor influencing the construction of cultural and leisure venues (Duan et al., 2010). Accessibility is an important factor influencing the location of cultural and leisure venues, and a location with convenient transportation is more conducive to the arrival and departure of consumers (Yu and Feng, 2009; Liu et al., 2022). Policy documents and planning have a strong guiding effect on the spatial clustering of cultural and leisure places (Liu and Wu, 2016). In addition to these factors, educational institution clusters have a strong endogenous cultural demand, which will release pull signals and encourage cultural and leisure enterprises to consciously locate venues around this area (Liu and Wu, 2016).
In summary, this study explores the drivers of the spatial distribution of cultural and leisure venues in Beijing in 1999, 2009 and 2019 from five perspectives: economic level, consumption potential, transportation conditions, policy orientation, and educational institutional gravity (Table 2), Factor detection and interaction detection analyses of the influencing factors were conducted using a geographic probe to examine the effects of factor differences and factor interactions on the dependent variables in order to reveal the driving forces behind the spatial distribution of cultural and leisure venues in Beijing. In the calculation of geographical detectors, the independent variable should be of a quantitative type, and when the independent variable is a numerical quantity, it is discretized. Therefore, in ArcGIS 10.2, the indicators in Table 2 were classified into six categories for gridding using the natural breakpoint method, and a smaller classification value indicates a smaller amount of the corresponding indicator value within the gridding for that indicator. The importance of each influencing factor is shown in Fig. 7, Fig. 8, and Fig. 9 for 1999, 2009 and 2019, respectively.
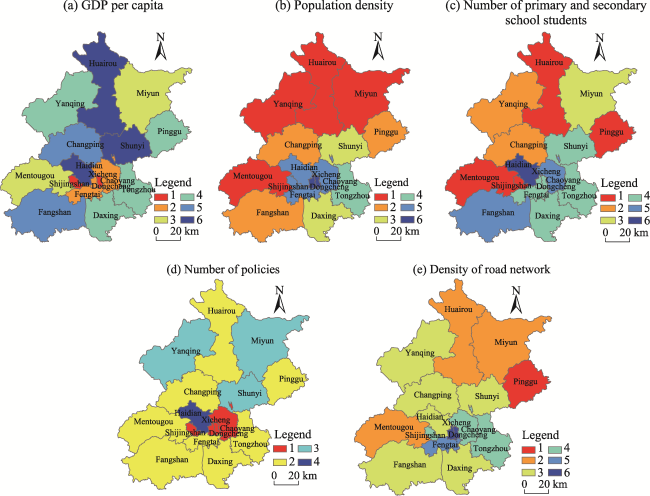
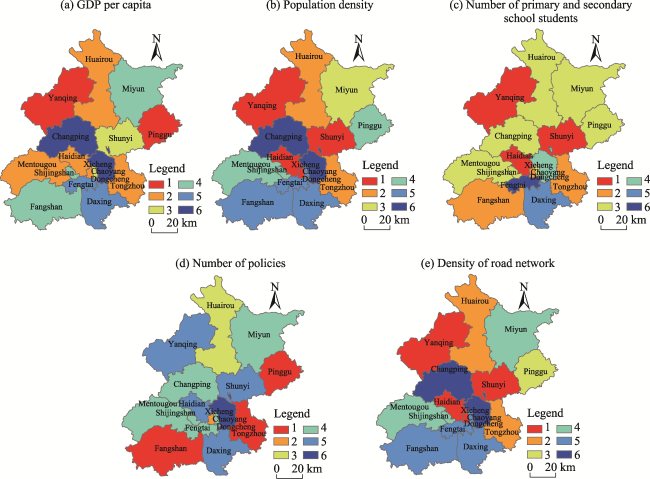
Table 2 Table of the main factors influencing cultural and leisure venues in Beijing
Influencing factor Indicator Unit Data source
Economic level GDP per capita yuan per person Beijing Regional Statistical Yearbook
Consumption potential Population density 104 persons km-2 Beijing Regional Statistical Yearbook
Traffic conditions Road network density km km-2 OpenStreetMap
Policy guidance Number of policies Number Official government websites of the cities
Educational institution gravity Number of students in school 104 persons Beijing Regional Statistical Yearbook
Fig. 7 Classification results of each influencing factor in 1999

Note: The indicator were classified for gridding using the natural breakpoint method, and a smaller classification value indicates a smaller amount of the corresponding indicator value within the gridding for that indicator. The same below.

Fig. 8 Classification results of each influencing factor in 2009
Fig. 9 Classification results of each influencing factor in 2019

4.1 Results of factor detection

The results of the single factor detection analysis using the geographic detector are shown in Table 3. All of the influencing factors were significantly correlated within the 99% confidence interval of the analysis in all three years. In terms of the magnitude of the explanatory power of the factors in each year, the influences of population density, road network density, number of students at school and GDP per capita fluctuated greatly in each year, and the explanatory power of the number of policies was consistently low, while the comprehensive effect of these multiple factors was very strong.
Table 3 Detection results of the spatio-temporal distribution drivers of cultural and leisure venues in Beijing
Year Factor detector GDP per capita Population density Road network density Number of policies Number of students in school
1999 q statistic 0.363 0.613 0.525 0.406 0.518
P value 0.000 0.000 0.000 0.000 0.000
2009 q statistic 0.697 0.603 0.769 0.424 0.709
P value 0.000 0.000 0.000 0.000 0.000
2019 q statistic 0.681 0.581 0.533 0.147 0.726
P value 0.000 0.000 0.000 0.000 0.000
In 1999, the ranking of the explanatory power of each factor is in the following order: population density > road network density > number of school students > number of policies > GDP per capita. In 2009, the ranking is: road network density> number of school students > GDP percapita >population density > number of policies. In 2019, the ranking is: number of school students > GDP per capita > population density> road network density > number of policies. Therefore, the explanatory power of each factor shows some changes over time, and there are several reasons for this.
(1) The influence of population density is decreasing, as its influence has declined from first place in 1999 to third place in 2019. The population distribution status determines the spatial distribution pattern of cultural and leisure venues (Wei et al., 2007). Population concentration areas are also areas with strong consumption demand, which will attract the establishment of cultural and leisure institutions. Cultural leisure is an enjoyable consumption, and with the maturity of the investment market, more cultural and leisure venues will consider other factors such as economic level, business cycle and other factors in their layout, resulting in a decline in the influence of the singular population density factor.
(2) Road network density is an important factor influencing the distribution of cultural and leisure venues, but its influence has declined from second place in 1999 to fourth place in 2019. Traffic accessibility affects the agglomeration status and accessibility of leisure venues (Yu and Feng, 2009). Cultural and leisure venues are generally located in the periphery of urban CBDs, transportation centers, on both sides of roads that are essential for work and shopping, and near developed mass leisure venues (Ryder, 2004), all of which have in common a well-connected road network or a transit point with a high volume of pedestrian traffic. The influence of roads on the location of cultural and leisure venues has been relatively reduced since Beijing’s successful bid for the Olympic Games in 2001, when large-scale infrastructure construction was initiated, and urban roads have been increasingly improved.
(3) The influence of the number of students in school has steadily increased, from the third-place ranking in 1999 to the first place in 2019, reflecting a close relationship between the educational population and the distribution of cultural and leisure venues. Cultural leisure is a higher-level spiritual demand arising from the satisfaction of people’s material needs. In the context of the continuous popularization of basic education and quality education, the demand for parent-child education and study, as well as the rapid growth of young people’s cultural consumption demand, objectively promote the clustering of cultural leisure product supplies around schools (Zhuang, 2013).
(4) GDP per capita has an important influence on the spatial layout of cultural and leisure places, and its influence has increased from the last place in 1999 to the second place in 2019. The strength of regional economic development is a necessary prerequisite for the construction of cultural and leisure facilities (Zhuang et al., 2020). The higher the level of economic development, the stronger the cultural and leisure needs of residents and the richer the supply of cultural and leisure products (Wu et al., 2015). In 2019, the regional GDP of four districts, namely, Dongcheng, Xicheng, Chaoyang and Haidian, accounted for about 60% of Beijing’s GDP, and the number of cultural and leisure venues in these four districts accounted for 54% of the whole. The level of economic development has an important role in promoting the spatial and temporal evolution of cultural and leisure venues.
(5) The number of policies has less influence on the distribution of cultural and leisure venues in Beijing than the other factors, and its influence is decreasing. The influence of policies has decreased from the fourth place in 1999 to the last place in 2019. The early plans had a certain guiding effect on the distribution of cultural and leisure venues (Liao and Zhang, 2020). However, with the deepening of urban modernization, the buildable space in major urban areas has been shrinking day by day, so the influence of policies and plans on the spatial layout of cultural and leisure venues is becoming weaker.

4.2 Interaction detection results

Based on the factor detection analysis, and considering that the distribution of cultural and leisure venues in Beijing is the result of multiple factors, the interaction detector was then used for further analysis. The results in Tables 4, 5, and 6 show that after including the interactions of all influencing factors in 1999, 2009, and 2019, the phenomenon of two-factor influence is enhanced, indicating that the spatial distribution is the result of the joint action of multiple factors.
Table 4 Interaction detection results of the factors influencing cultural and leisure venues in Beijing in 1999
Variable GDP per capita Population density Road network density Number of policies Number of students in school
GDP per capita 0.363
Population density 0.929 0.613
Road network density 0.774 0.795 0.525
Number of policies 0.759 0.656 0.779 0.406
Number of students in school 0.972 0.797 0.797 0.769 0.518
Table 5 Interaction detection results of the factors influencing cultural and leisure venues in Beijing in 2009
Variable GDP per capita Population density Road network density Number of policies Number of students in school
GDP per capita 0.697
Population density 0.984 0.603
Road network density 0.923 0.974 0.769
Number of policies 0.993 0.927 0.987 0.424
Number of students in school 0.769 0.979 0.879 0.937 0.709
Table 6 Interaction detection results of the factors influencing cultural and leisure venues in Beijing in 2019
Variable GDP per capita Population density Road network density Number of policies Number of students in school
GDP per capita 0.681
Population density 0.915 0.581
Road network density 0.903 0.649 0.533
Number of policies 0.987 0.899 0.790 0.147
Number of students in school 0.958 0.905 0.792 0.727 0.726
From the results of the interactions between the factors in each year, the spatial distributions of cultural and leisure venues in Beijing in 1999 and 2009 show “two-factor” characteristics. The interactions between GDP per capita, population density and other factors are significantly increasing, highlighting the dual “economic” and “demand” drivers of the distributions. In 1999, the interaction between GDP per capita and the number of school students was the strongest (0.972), followed by GDP per capita and population density (0.929), and then population density and road network density (0.795). In 2009, the number of policies and GDP per capita had the strongest interaction (0.993), followed by GDP per capita and population density (0.984), population density and number of students in school (0.979), and then population density and road network density (0.974). Culture and leisure is the consumption of people pursuing self-development, and the spatial distribution of cultural and leisure places is closely related to the gathering of leisure consumers and their ability to pay for leisure consumption. Therefore, economic factors and demand factors both play a dominant role in the spatial layout of cultural and leisure places.
In 2019, the main factor influencing the spatial distribution of cultural and leisure venues in Beijing was GDP per capita, indicating a significant “economy-driven” feature. The interaction values of GDP per capita with the other four influencing factors are significantly higher than those of the other factors, such as GDP per capita and number of policies (0.987), GDP per capita and number of students in school (0.958), GDP per capita and population density (0.915), and GDP per capita and road network density (0.903), so it is the core influencing factor for the distribution of cultural and leisure venues in Beijing in 2019. Regions with higher levels of economic development have better public services and infrastructure, the residents pay more attention to education and their own development, and they have a stronger demand for cultural and leisure consumption, which are the most important factors for attracting investment and the establishment of cultural and leisure enterprises.
Considering the results of the interactions of the factors in the three years, it is clear that the spatial distribution of cultural and leisure venues in Beijing has been driven by both “economic” and “demand” factors, and it has evolved over time from a two-factor-driven pattern to a singular “economic-driven” pattern.

5 Conclusions

This study takes 5625 cultural and leisure venues in Beijing as the object, and explores the spatial and temporal evolution of those venues using barycenter coordinates, standard deviation ellipse, kernel density analysis, spatial autocorrelation and other analysis methods. Moreover, the use of geodetector to further explore the factors influencing the spatial and temporal distribution of cultural and leisure venues led to four main conclusions.
(1) The spatial distribution of cultural and leisure venues in Beijing is uneven, and a “core-edge” pattern of concentration in the central city is prominent. As time passes, the number of cultural and leisure venues in the suburbs is growing, the trend of concentration in the core area is weakening, and cultural and leisure venues are spreading to the northern and southern suburbs.
(2) As time passes, the cultural and leisure venues in Beijing are evolving from “single-core clustering” to “double-core coexistence”, with one high-density core area centered on the six districts of the city and one sub-density core area centered on Tongzhou District. From 1999 to 2019, the global Moran’s I of the spatial distribution of cultural and leisure venues in Beijing decreased from 0.43 to 0.22, showing a spatial clustering of the cultural and leisure venues, but the trend of clustering is decreasing, and the spatial distribution is spreading throughout the whole city.
(3) Dongcheng, Xicheng, Chaoyang and Fengtai are the HH agglomerations of cultural and leisure venues. The LL agglomerations are mainly located in the northern suburbs and relatively concentrated in Huairou and Miyun District, with distinct characteristics of “highlands” and “depressions” of the cultural and leisure venues.
(4) The spatial distribution of cultural and leisure venues in Beijing has been influenced by a combination of factors, including the economy, population, transportation, education, and policies. In 2009 and before, the spatial distribution of cultural and leisure places in Beijing was jointly driven by both “economy” and “demand”. However, by 2019, Beijing’s cultural and leisure venues began to shift from dual factor driven development to singular “economic driven” development.
The early distribution of cultural and leisure venues in Beijing was also influenced by historical inertia (Yang and Zhang, 2009), although that factor is difficult to quantify and has not been considered for the time being. This study classifies the cultural and leisure venues in Beijing into four categories, but due to the limitation of space, the spatial and temporal distribution characteristics of each of the different types of cultural and leisure venues, and the reasons for their formation, were not further analyzed here. However, they can be explored further in the future.
[1]
Aoyama Y. 2007. The role of consumption and globalization in a cultural industry: The case of Flamenco. Geoforum, 38(1): 103-113.

[2]
Beyers W B. 2008. Cultural and recreational industries in the United States. Service Industries Journal, 28(3): 375-391.

[3]
Chen C. 2003. Culture and leisure new hotspot for consumption in the capital. Guangming Daily, 2003-10-10. (in Chinese)

[4]
Chen C K. 2012. Hierarchical linear relationship between the U.S.leisure and entertainment consumption. Technology in Society, 34(1): 44-54.

[5]
Cheng G, Li R J, Zhang J H, et al. 2012. The spatial fractal characteristics of teahouse’s random aggregation in Chengdu City. Progress in Geography, 31(6): 701-710. (in Chinese)

[6]
Dewenter R, Westermann M. 2003. Cinema demand in Germany. Journal of Cultural Economics, 29(3): 213-231.

[7]
Duan Z W, Li J Q, Wang X Z. 2010. A research on space structure of urban intelligence recreation ground. Human Geography, 25(6): 53-57. (in Chinese)

[8]
Feng Y J, Wu X G, Zhang H G. 2018. Spatio-temporal evolution and influence factors of water parks in Jiangsu Province. Economic Geography, 38(7): 217-224. (in Chinese)

[9]
Gan Y L, Zhu Y Y, Chen S Y, et al. 2020. Deconstruction of urban cultural consumption space in Wuhan City in the post-epidemic era: The case of physical bookstores. Areal Research and Development, 39(6): 65-70. (in Chinese)

[10]
Gul Y, Sultan Z, Moeinaddini M, et al. 2018. The effects of physical activity facilities on vigorous physical activity in gated and non-gated neighborhoods. Land Use Policy, 77: 155-162.

[11]
Hao F L, Wang S J. 2016. Spatial distribution characteristics of entertainment venues in Changchun urban area based on the public praise from internet. Human Geography, 31(6): 66-72, 108. (in Chinese)

[12]
He D, Zhang J Q, Meng B. 2014. Study on the spatial distribution of public cultural facilities in the central district of Beijing. Resource Development & Market, 30(1): 55-58, 129. (in Chinese)

[13]
Hobikoğlu E H, Çetinkaya M. 2015. In Innovative entertainment economy framework, economic impacts of culture industries: Turkey and Hollywood samples. Procedia-Social and Behavioral Sciences, 195: 1435-1442.

[14]
Hutton T A. 2004. The new economy of the inner city. Cities, 21(2): 89-108.

[15]
Jia X T, Lei J, Wu R W, et al. 2019. Urban recreation space pattern based on POI data: A case of Urumqi City. Arid Land Geography, 42(4): 943-952. (in Chinese)

[16]
Li G M, Zhang Y J, Zhang X J, et al. 2017. Study on the spatial divergence of tourism economy in Henan municipalities based on inbound tourism revenue. Areal Research and Development, 6(4): 93-98. (in Chinese)

[17]
Liao J Y, Zhang J Q. 2020. Research on the spatial distribution characteristics of Beijing urban cultural facilities based on POI Data. Journal of Beijing Union University, 34(1): 23-33. (in Chinese)

[18]
Liu H C, Wu Z S. 2016. Leisure education: A new dimension of adolescents’ “Becoming Human” and comprehensive development. Studies in Dialectics of Nature, 32(9): 107-111. (in Chinese)

[19]
Liu H L, Liu M T, Hu X H, et al. 2022. Temporal and spatial evolution of Chinese museums and their causes analysis. Tropical Geography, 42(3): 469-480. (in Chinese)

[20]
Liu Y Q, Zhang Y P, Jin S T, et al. 2020. Spatial pattern of leisure activities among residents in Beijing, China: Exploring the impacts of urban environment. Sustainable Cities and Society, 52: 101806. DOI: 10.1016/j.scs.2019.101806.

[21]
Loyd R, Clark T N. 2004. The city as an entertainment machine. Research in Urban Sociology, (5): 312-326.

[22]
Meng K Z Q, Yan J ZH, Wang S. 2022. The evolution and interpretation of the spatial pattern of leisure facilities in Chongqing. World Regional Studies, 31(5): 1057-1069. (in Chinese)

[23]
Ryder A. 2004. The changing nature of adult entertainment districts: Between a rock and a hard place or going from strength to strength? Urban Studies, 41(9): 1659-1686.

[24]
Wang H Q, Yuan J D, Meng X J. 2017. Spatial distribution and its influencing factors of level-A scenic spots in northeast China. Scientia Geographica Sinica, 37(6): 895-903. (in Chinese)

[25]
Wang J F, Xu C D. 2017. Geodetector: Principle and prospective. Acta Geographica Sinica, 72(1): 116-134. (in Chinese)

[26]
Wang W, Chen Y, Wang X W, et al. 2017. A study on spatial-temporal patterns of regional development disparities in Yangtze River Economic Zone. Resources and Environment in the Yangtze Basin, 26(10): 1489-1497. (in Chinese)

[27]
Wei Z C, Zhen F, Shan L, et al. 2007. Study on the spatial and temporal distribution pattern of cultural facilities in Shenzhen. Urban Development Studies, 14(2): 8-13. (in Chinese)

[28]
Wu L Y, Xu J Y, Yan Z X, et al. 2022. The spatio-temporal evolution of ski resorts in Beiing-Tianjin-Hebei Region: Characteristics and influencing factors. Journal of Resources and Ecology, 13(4): 592-602.

[29]
Wu Z J, Rui Y K, Jia J, et al. 2015. Analysis on the spatial distribution and expansion characteristics of urban entertainment and leisure venues: A case study on KTV. Journal of Geo-information Science, 17(5): 590-597. (in Chinese)

[30]
Yang X J, Zhu K K, Chen M Y, et al. 2018. Spatial distribution characteristics and temporal-spatial evolution of urban cinema—A case study of Xi’an. Economic Geography, 38(6): 85-93. (in Chinese)

[31]
Yu C X, Feng J. 2009. On the spatial distribution of leisure venues in Beijing. Urban Development Studies, 16(6): 77-82. (in Chinese)

[32]
Zhang H. 2012. Research on leisure, aesthetics and urban quality of life. Inner Mongolia Social Sciences, 33(4): 123-127. (in Chinese)

[33]
Zhou B, Huang M C, Li C L, et al. 2022. Leisure constraint and mental health: The case of park users in Ningbo, China. Journal of Outdoor Recreation and Tourism, 39: 100562. DOI: 10.1016/j.jort.2022.100562.

[34]
Zhuang L, Tian N, Zhao B. 2020. Spatio-temporal characteristics and impact factors of museums in Shanghai. Tropical Geography, 40(3): 539-550. (in Chinese)

[35]
Zhuang T L. 2013. On the overall development of people in the context of leisure culture. Dongyue Tribune, 34(6): 187-190. (in Chinese)

Outlines

/