Revegetation and Management of Mines

Characteristics of Water Consumption of Atraphaxis bracteata A. Los. in the Mu Us Sandy Land of North Central China

  • LI Wanying , 1 ,
  • GUO Yue 1 ,
  • WU Rina 1 ,
  • CAO Qiqi 2 ,
  • DING Guodong 1 ,
  • XIAO Huijie , 1, *
Expand
  • 1. School of Soil and Water Conservation, Beijing Forestry University, Beijing 100083, China
  • 2. Shandong Key Laboratory of Eco-Environmental Science for the Yellow River Delta, Binzhou University, Binzhou, Shandong 256603, China
*XIAO Huijie, E-mail:

LI Wanying, E-mail:

Received date: 2022-06-05

  Accepted date: 2023-02-20

  Online published: 2023-07-14

Supported by

Key Research and Development Program of China(2017YFC0504403)

Abstract

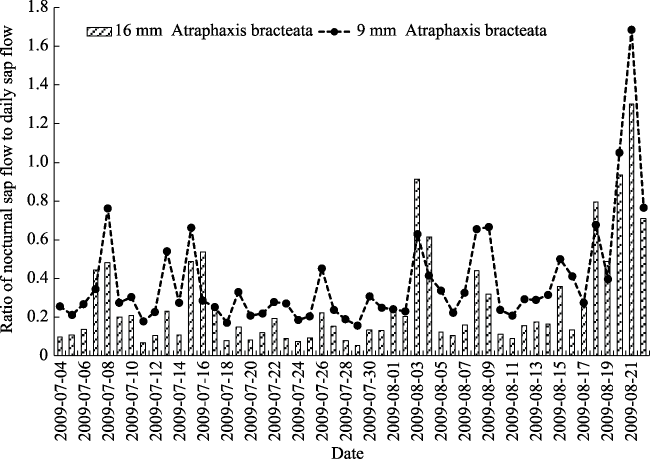
Water consumption by Atraphaxis bracteata A. Los. was measured using sap flow measuring system from May to October in 2009, and environmental variables were measured simultaneously in this study,. The study revealed the sap flow rate was largest in June, and the daily sap flow was significantly affected by weather condition. The sap flow rate is related to stem diameter, stems with larger diameter had higher sap flow rate than smaller diameter stems. The effects of soil moisture at depths of <1 m on the sap flow rate were not significant, which may be related to the uptake of water by plants from deep soil. In addition, time lags of 30-130 minutes were observed between transpiration and increased sap flow. These time lags were related to stem size as well as water conditions. The ratio of nocturnal to diurnal sap flow normally varied in the range between 0.1 and 0.4; however, on rainy days, the ratio was even larger than 1.0, indicating that nocturnal sap flow results in significant water loss. Environment factors had significant effect on sap flow. Solar radiation and the vapor-pressure deficit had the largest effect on the sap flow rate during the day and at night, respectively.

Cite this article

LI Wanying , GUO Yue , WU Rina , CAO Qiqi , DING Guodong , XIAO Huijie . Characteristics of Water Consumption of Atraphaxis bracteata A. Los. in the Mu Us Sandy Land of North Central China[J]. Journal of Resources and Ecology, 2023 , 14(4) : 880 -892 . DOI: 10.5814/j.issn.1674-764x.2023.04.020

1 Introduction

The Mu Us Sandy Land is one of the largest sandy lands in Northern China covering an area of 32.1×10³ km2 (Yan and Wu, 2013). Atraphaxis bracteata is widely distributed in the Mu Us Sandy Land, and it is an important dominant species is this region. Its rapid growth enables it to tolerate some sand burial; it can grow many adventitious roots, and form a dense root network, giving the species good water absorbing abilities and minimizing the effects of wind erosion (Guo et al., 2010).
Because water is the main limiting factor related to plant survival in arid sandy lands, many methods were developed to study plant water status, such as the lysimeter weighing method (Sakuratani, 1981; Swanson, 1994), leaf chamber method, use of stomatal closure measurements (Jones, 1999; Möller et al., 2007), stem or trunk shrinkage measured by a strain gauge (Link et al., 1998; Yamane et al., 2009) and use of a linear variable displacement transducer (Goldhamer and Fereres, 2001). Some studies measured plant transpiration using sap flow sensors (Granier, 1987; Fernández et al., 2001; Giorio and Giorio, 2003; Yamane et al., 2011).
Stem heat balance (SHB) technique is a widely used method to measure sap flow rate. The method was originally used to measure the sap flow rate in herbaceous plants. At present, the SHB is widely used to estimate sap flow rates of herbaceous plants and xylophyta (Sakuratani, 1981, 1984, 1987; Baker and van Bavel, 1987; Steinberg et al., 1989; Ishida et al., 1991; Batho et al., 1994; Weibel and Boersma, 1995; Gonzalez-Altozano et al., 2008; Chirino et al., 2011).
For the SHB method a small heater is wrapped around plant stem and provide constant input of heat to the stem, heat fluxes are measured with a thermopile and a series of thermocouples, the heat transported by sap flow from the heated segment can be calculated when the vertical and radial heat transferred by thermal conduction is deducted (Huang et al., 2010). Concerning the heat supply, heat storage in the stem section may be significant in trees with stem diameters greater than 25 mm, but this is negligibly small at smaller diameters (Batho, 1993; Batho et al., 1994; Grime et al., 1995). The advantage of the SHB technique is that sap flow meters are non-destructive and can monitor the change in sap flow over a short period. In addition, the cost of SHB is lower than those of other methods (Sakuratani, 1981; Swanson, 1994; Chabot et al., 2005).
Sap flow rate is mainly dependent on atmospheric conditions, including light intensity, vapor pressure deficit (VPD), air temperature, and relative humidity (Jones, 2004; Kume et al., 2007) quantified the effects of atmospheric demand on sap flow rate and tree conductance for water vapor transfer, an exponential decay function, including the VPD, accounted for 75% of the variation in mean daytime tree conductance. Zhang et al. (2011) found daily sap flow rate of grapevine increased linearly with solar radiation, and an exponential increase to its maximum curve as a function of VPD. Solar radiation and VPD accounted for 70% and 66% of the variability of sap flow rate respectively. Yu et al. (2009) found that the order of correlation degree of environment factors and Platycladus orientalis’s trunk sap flow rate is photosynthetically active radiation>vapor pressure deficit >temperature>relative humidity.
In addition, Zhang et al. (2011) found that soil water content also significantly influenced sap flow rate. The relationship between soil moisture and sap flow rate could be expressed by a piecewise regression with the turnover point of certain value of soil volume water content (VWC), which was 60% of the field capacity. Kume et al. (2007) found a distinct decrease in sap-flow rate of individual trees due to soil water stress; ranging from 10% to 40% for a given VPD. Some studies have explained that decreased soil water content could cause an increase in hydraulic resistance (e.g., Sperry and Pockman, 1993; Wullschleger et al., 1998), which results in a decrease in water uptake at a given water potential difference between soil and leaves (e.g., Cienciala et al., 1994; Kumagai, 2001). Rainfall is a major driver of biological processes in arid ecosystems (Noy-Meir, 1973). Some studies found rainfall pulses can creates a pulse of soil moisture. The soil water potentials elevated result in a rapid increase in sap flow velocity (Schwinning and Sala, 2004; Zeppel et al., 2008).
Sap flow in individual stems showed a strong positive relationship with leaf area (Allen et al., 1994). Some studies have illustrated the influence of stem diameter on the magnitude of sap flow errors. In addition, differences in wood anatomy may also influence xylem sap flow rates (Phillips et al., 1996; Hacke and Sperry, 2001), although little attention has been paid to these points.
At the leaf scale, a long-held assumption states that stomata close at night in the absence of light, causing transpiration to decrease to zero, and therefore sap flow stops. Emerging research shows, however, that nocturnal sap flow has been observed in all species, and significant nighttime water loss was observed in different species of trees (Zhang et al., 2011). Many studies have also found that different environmental factors have different effects on nocturnal fluid flow (Zhao et al., 2019). Some studies on leaf gas exchange have shown nighttime conductance accounts for 5%-30% of daily water loss (Rawson and Clarke, 1988; Winner et al., 1989; Matyssek et al., 1995; Assaf and Zieslin, 1996; Donovan et al., 1999; Snyder et al., 2003).
In summary, as mentioned above, sap flow is determined by different factors, including environmental factors, and the characteristics of plant species. It is very difficult to determine which is the dominant factor affecting the sap flow rate. Moreover, collinearity often exists among these factors (Belsley et al., 1980; Neter et al., 1996; Freund et al., 2003).
In the present study, transpiration of a shrub species (A. bracteata) with different diameters was determined by sap flow measurements over an entire growing season in 2009. During the observational period, various environmental factors such as solar radiation, VPD, wind speed, air temperature, relative humidity, soil moisture etc. were also observed. The objectives of this study are to investigate the amount of water consumed by a sand-fixing species (A. braceata), and to analyze the diurnal and seasonal variations of the sap flow rate in relation to environmental factors.

2 Materials and methods

2.1 Study area description

Yanchi County lies in north central China (37°04′-38°10′N and 106°30′-107°41′E), in the eastern part of Ningxia Hui Autonomous Region, and covers an estimated area of 6743 km2 (Fig. 1). The area is bordered by Shaanxi and Gansu provinces as well as by Ningxia Hui and Inner Mongolia autonomous regions. The northern edge of the County touches the Mu Us Sandy Land, and the southern edge merges with the Loess Plateau. The County is thus in a typical transitional zone.
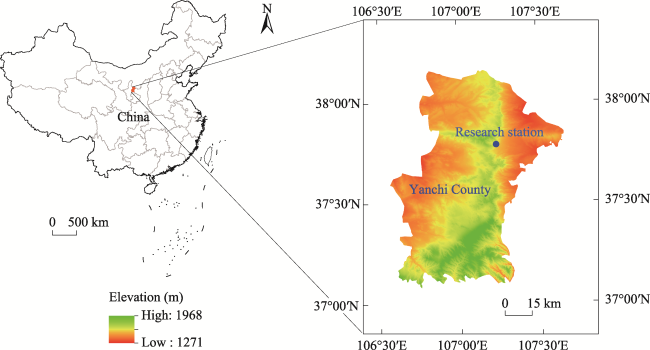
Fig. 1 The location of Yanchi research station in China
Terrain in the region features lower elevations in the north and higher elevations in the south, ranging from 1295 to 1951 m. From south to north, the terrain shows a transition from the Loess Plateau to the Ordos Plateau. Soil types in the south are primarily dark loessial soil, but in the north, soil changes to eolian sandy soil and sierozem, with some loess deposits, saline soil, planosol, and other soil types.
The climate ranges from semi-arid to arid and is dominated by a semiarid continental monsoonal climate of the mid-temperate zone. Abundant sunshine averages 3124 h annually, with a mean annual temperature of around 8.1 ℃, and the lowest and highest monthly mean temperatures of −24.2 ℃ in January and 34.9 ℃ in July, respectively. The frost-free season lasts 165 days. Annual precipitation ranges from 250 to 350 mm, and decreases when moving from the south to the north and from the southeast to the northwest. Mean annual pan evaporation is 2897 mm, which is dramatically higher than annual precipitation. Gales (wind speed, 8 m s−1) occur an average of more than 23.4 times per year.
Land use ranges from farming to herding of animals. The vegetation types range from dry steppe vegetation to desert grassland. The main vegetation types include shrubs, grasslands, meadows, and sandy or desert steppe or other grassland vegetation. Shrubs are the dominant form of vegetation (e.g., Salix psammophila and Caragana microphylla). Grasslands are classified into two main types: typical grassland (e.g., Stipa grandis, Stipa bungeana, Agropyron cristatum, Thymus serpyllum var. mongolicus, and other species) and desert grassland (e.g., Caragana tibetica, Oxytropis aciphylla, Nitraria sibirica, Kalidium foliatum, and other species) (Yang et al., 2009).

2.2 Experimental methods

2.2.1 Sap flow measurements

The experiments were carried out from May to October 2009. A standard quadrat size of 10 m×10 m was selected, and the diameter of the basal stem, plant height and crown width of A. bracteata plants in each plot were investigated. A standard plant was chosen for analysis during the test.
Stem sap flow gauges (Flow32, Dynamax Inc., Houston, TX, USA) were used to measure sap flow in the stems of A. bracteata using the SHB method. The gauges were installed as described by Smith and Allen (1996) and Yue et al. (2008); the manufacturer’s instructions were also followed.
Under the same site conditions within the plots, two stems of standard plant with diameters of 9 mm and 16 mm, and without lateral ramifications, were selected. For good thermal contact between the stem and the gauges, the superficial bark roughness of each stem was removed by using a blade. The stem was then smoothed by sanding to remove loose bark; in addition, the stem was coated with a layer of silicone grease. Each gauge was installed carefully to avoid any lumps and swellings on the stem. To reduce the influence of thermal gradients induced by the environment, the stem sap flow gauges were installed about 50 cm above the soil surface. The gauges were completely covered with aluminum foil as insulation to minimize thermal perturbations caused by the ambient environment, such as the influence of rain or solar radiation. To avoid water flowing into the gauges, shelters were installed above the gauges, and joints were sealed with wax. Sensor signals of gauges were logged using a data logger (CR1000, Dynamax Inc., Houston, TX, USA), and data were automatically recorded at 10-min intervals.

2.2.2 Environmental measurements

Data for environmental factors were measured with different instruments installed at the Yanchi Research Station in Yanchi County, China. Wind speed, air temperature, relative humidity, net radiation, rainfall and atmospheric pressure were measured by an automatic weather station (Vantage Pro2, Davis Instruments, Haywood, CA, USA), which was mounted near the plot. Meteorological data were recorded every 5 min with the data logger (CR1000, Dynamax Inc., Houston, TX, USA), and stored as a 30-min mean value.
Soil moisture was measured using the oven drying method. Soil samples were collected with a soil auger from the soil surface to 100 cm depth, with subsamples taken for every 20 cm of depth, including three replicates. Soil samples were dried for 8 hours in thermostatic oven at 105±2℃, and then put in dryer for half hour before weighing. Soil water content was calculated by weighing the original and dried soil samples. The soil samples were collected twice per month, and after rainfall, sampling was also repeated.

2.2.3 Leaf area index measurement

The leaf area index (LAI, m2 m-2) of A. bracteata shrubs was measured twice per month with a LAI-2000 plan canopy analyzer (SS1, Li-Cor, Inc., Lincoln, NE, USA) during the study period.

3 Results

3.1 Sap flow dynamics

3.1.1 Sap flow on a monthly scale

The stem sap flow rate of A. bracteata varied in different seasons. Figure 2a shows the sap flow rate was relatively small in May, because plants were in the initial stage of growth, and the leaves had not yet fully expanded. In addition, the sap flow rate was affected by limited soil water availability, and the soil water content in this month was low. The mean sap flow rates for 9- and 16-mm-diameter stems of A. bracteata were 28.9 g h-1 and 36.9 g h-1, respectively.
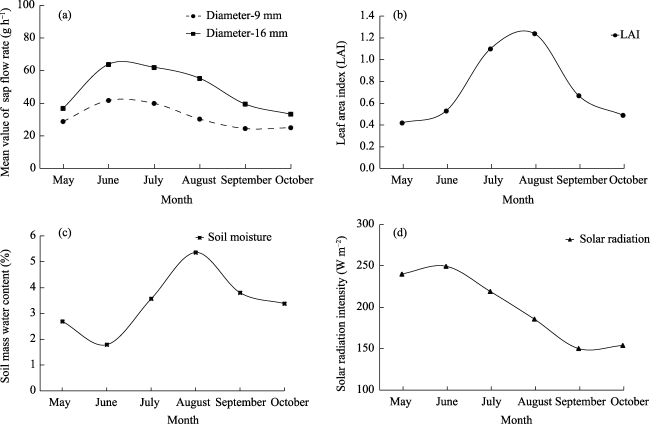
Fig. 2 Monthly variation of (a) sap flow rate of 9- and 16-mm stems of A. bracteata, (b) leaf area index of 16-mm stems of A. bracteata, (c) soil water content, (d) solar radiation intensity from May to October in 2009
Fig. 2b shows that, starting in June, the leaves expanded rapidly, and the plant entered into a period of rapid growth during which the sap flow rate increased markedly and peaked. For 9- and 16-mm-diameter stems of A. bracteata the sap flow rate can reach 41.8 g h-1 and 63.8 g h-1, respectively. Based on an analysis of the factors affecting the sap flow rate (Fig. 2b-2d), the increase may resulted from the peak in solar radiation intensity that occurred in June.
The rainy season at the study site lasted from July to August. Figure 2c shows how soil moisture content increased obviously during this period; however, the monthly average sap flow rate did not increase correspondingly. In fact, it decreased continuously during this period. Until August, the monthly average sap flow rate of 9- and 16-mm- diameter stems of A. bracteata declined to 30.4 g h-1 and 55.3 g h-1, respectively. The results indirectly indicate that in an arid area, soil moisture does not obviously affect the transpiration intensity of shrubs, because the shrubs adopted some strategies that protected them against soil drought, such as the growth of deep roots.
In September and October, the sap flow rate continued to decrease, perhaps in part because of the decreased leaf area, and also because of a decrease in solar radiation intensity.

3.1.2 Daily sap flow

The daily dynamics of sap flow during this period were plotted in Fig. 3; leaf area changed little in July and August. This figure shows a universal law, specifically, that daily sap flow varied rhythmically. The sap flow rate accelerated in the morning, peaked at noon, and then decreased in the afternoon; moreover, sap continued to flow at night, although the rate was sometimes negligible.
Figure 3 shows that weather conditions significantly affected the sap flow rate; on rainy days, the sap flow rate was obviously lower than that on sunny days. In addition, comparing the sap flow of 9- and 16-mm stems of A. bracteata suggests that the sap flow was significantly related to diameter. The peak sap flow of 9-mm A. bracteata stems varied in the range of 60-80 g h-1; in contrast, that of 16-mm A. bracteata stems varied in the range of 100-210 g h-1.
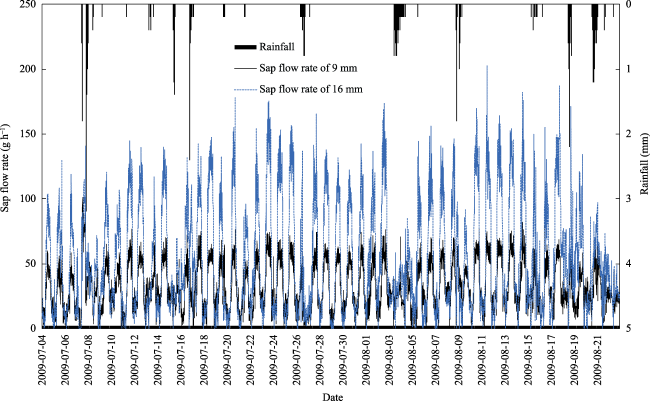
Fig. 3 Variations in sap flow rate in A. bracteata during July and August 2009
Nocturnal sap flow was observed in A. bracteata and the diurnal and nocturnal sap flow in July and August was plotted in Fig. 4. A similar tendency could be seen for both 9- and 16-mm-diameter stems of A. bracteata; that is, the daily and nocturnal sap flow varied conversely. A decrease in daily sap flow caused by rainy weather was usually followed by an increase in nocturnal sap flow. While daily sap flow increased on sunny days, the following nocturnal sap flow usually decreased, although its variation was relatively small.
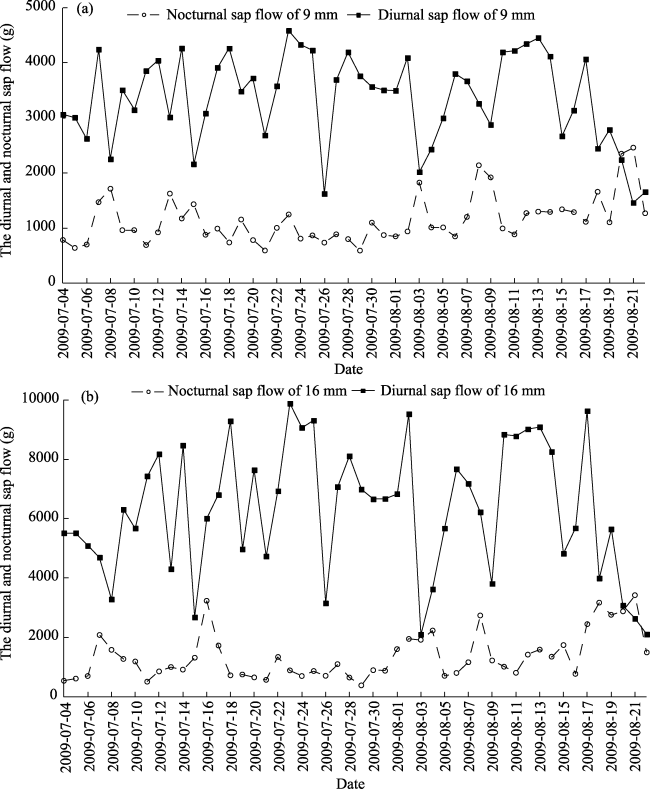
Fig. 4 Diurnal and nocturnal sap flow ratesin A. bracteata during July and August 2009
Figure 5 shows the how ratio of nocturnal to daily sap flow varied in July and August for 9- and 16-mm-diameter A. bracteata stems. The ratio for 9-mm-diameter Atraphaxis bracteata stems was obviously larger than that for 16-mm-diameter stems. On sunny days, the ratio of nocturnal to daily sap flow for 9-mm-diameter A. bracteata stems varied in the range between 0.2-0.4. However, for 16-mm-diameter A. bracteata stems the ratio of nocturnal to daily sap flow varied in the range between 0.1-0.3. On rainy days, the ratio changed significantly and was even larger than 1.0, which means the nocturnal sap flow was larger than daytime sap flow.
Fig. 5 Ratio of nocturnal to diurnal sap flow in A. bracteata during July and August 2009

3.1.3 Sap flow on an hourly scale

Figures 6 and 7 show the hourly dynamics of sap flow for 9- and 16-mm-diameter A. bracteata stems from 22 to 25 July and from 11 to 14 August, respectively. These two periods were chosen to represent typical conditions of dry and wet soil, respectively. Figures 6 and 7 indicate that the hourly sap flow rate changed with a similar tendency under both dry and wet soil conditions; therefore, as mentioned above the variation of sap flow was not associated with soil moisture.
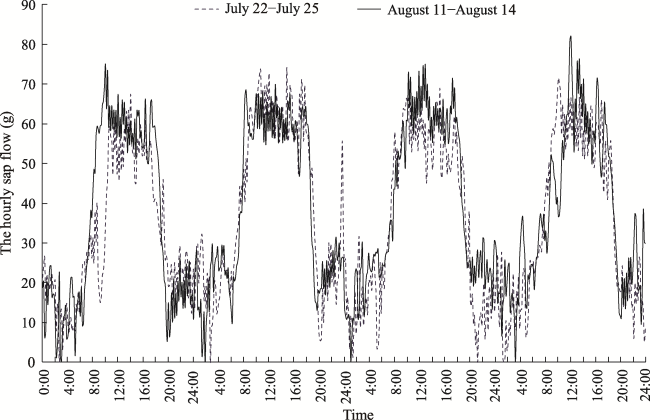
Fig. 6 Hourly sap flow of 9-mm-diameter A. bracteata stems from 22 to 25 July 2009, where soil mass water content changed from 1.67% to 2.21%; and from 11 to 14 August 2009, where soil mass water content changed from 4.98% to 4.21%

Note: The horizontal axis displays four days time periods (from 0 am to 12 pm every day) in two months, from 22 to 25 July, and from 11 to 14 August.

There was an obvious rhythm in the hourly dynamics of sap flow, and the hourly sap flow rate varied as a polymodal curve. Both Figures 6 and 7 indicate that the onset of sap flow increased at about 6:00, which was also the time of sunrise. From this time, the sap flow rate increased rapidly until it reached a peak at about 8:00, and then relatively small fluctuations were observed for about 10 hours. From about 18:00, the sap flow rate decreased rapidly, and reached its minimum value at about 21:00.
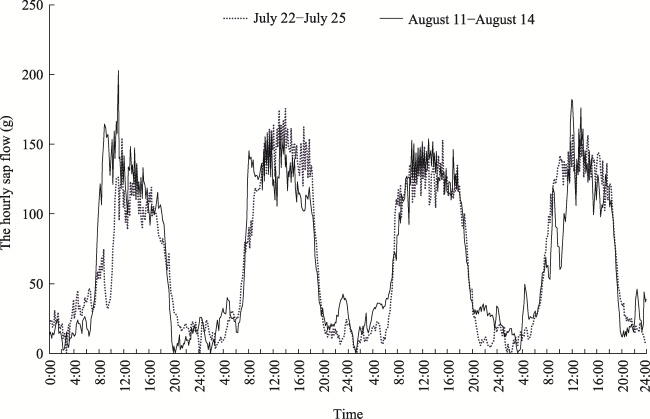
Fig. 7 Hourly sap flow of 16-mm-diameter A. bracteata from 22 to 25 July 2009, where soil mass water content changed from 1.67% to 2.21%; and from 11 to 14 August 2009, where soil mass water content changed from 4.98% to 4.21%

Note: The horizontal axis displays four days time periods (from 0 am to 12 pm every day) in two months, from 22 to 25 July, and from 11 to 14 August.

Figures 6 and 7 show the sap flow also occurred at night, although it was much smaller than that by day. In addition, the nocturnal sap flow rate also fluctuated and followed a regular pattern in that it increased again after 21:00 and peaked at about 00:00. Next, it decreased to an almost zero point between 2:00 and 3:00, and then increased again and reached another peak value at about 5:00, about one hour before sunrise. The nocturnal sap flow rate then decreased to some extent until sunrise.
Although the onset of sap flow was roughly consistent with the time of sunrise, a time lag still existed between transpiration and sap flow, either large or small. For the wet soil period, a time lag between transpiration and sap flow is plotted in Fig. 8a; this figure shows that transpiration started at 6:10 on 11 August 2009, as solar radiation was larger than 0; however, the increase in the sap flow rate started at 6:40 for 9-mm-diameter A. bracteata stems. In contrast, the onset of sap flow in 16-mm-diameter A. bracteata stems occurred at 7:00, which means the time lag between transpiration and sap flow is larger for thicker plant stem than that of thinner plant stems.
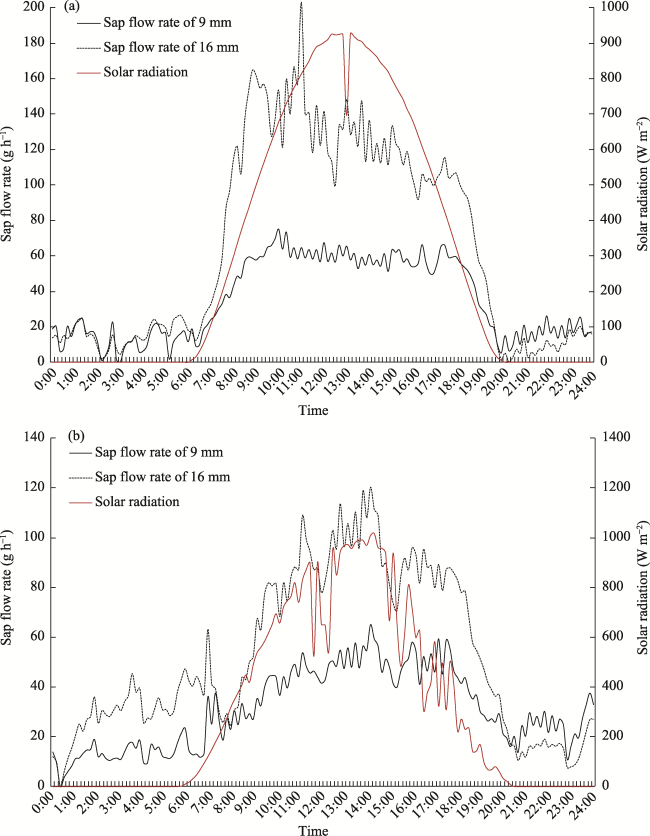
Fig. 8 Sap flow rate from 0:00 to 23:50 on 11 August (wet soil) and on 9 July (dry soil) 2009

Note: The time lag between transpiration and sap flow is plotted in this figure, since the onset of transpiration occurred as solar radiation was larger than 0; however, the sap flow did not increase correspondingly.

A larger time lag between transpiration and sap flow occurred during the dry soil period compared with the wet soil period (Fig. 8b); this figure shows that transpiration started at 5:40 on 9 July, and the increase in the sap flow rate started at 7:30 for 9-mm-diameter A. bracteata stems; in contrast, the onset of sap flow of 16 mm diameter A. bracteata stems occurred at 7:50.

3.2 Environmental factors affecting the sap flow rate

3.2.1 Collinearity diagnosis

Solar radiation, temperature, wind speed and VPD are usually thought of as the most important environmental factors affecting sap flow rate. Before conducting regression analysis, we compared collinearity statistics among these explanatory variables. The VIF of variables are plotted in Table 1.
Table 1 VIF of the explanatory variables based on collinearity statistics
Explanatory variables Collinearity statistics
Tolerance VIF
Solar radiation 0.539 1.854
Temperature 0.231 4.327
Wind speed 0.647 1.545
Vapor pressure deficit (VPD) 0.195 5.128
A general rule is that the VIF should not exceed 10 (Marquardt and Snee, 1970; Belsley et al., 1980). The results of collinearity analysis show that the VIF of four explanatory variables are less than 10; therefore, multicollinearity does not exist among solar radiation, temperature, wind speed and VPD, and by extension, no variable needed to be excluded when establishing the model.

3.2.2 Effect of environmental factors on sap flow

Using solar radiation, temperature, wind speed and VPD as explanatory variables and sap flow rate as a dependent variable, a regression model was developed. To analyze the environmental factors affecting sap flow rate during the day and night individually, regression models were established for both diurnal and nocturnal sap flow.

3.2.3 Environmental factors related to diurnal sap flow

Table 2 shows that the results of regression model for examining diurnal sap flow. The models established for diurnal sap flow of 9- and 16-mm A. bracteata stems passed a T test for significance; therefore, the degree of fitting for the two models is close to optimal. The adjusted R2 of the two models were 0.606 and 0.735, respectively; this indicated that the variables, including solar radiation, wind speed, temperature and VPD, can explain 60.6% and 73.5% of the change in the diurnal sap flow rate, respectively. Therefore, the explanatory ability of the models is relatively high and the performance of the model for 16-mm A. bracteata stems is better that that of 9-mm stems.
Table 2 Results of the regression model for diurnal sap flow
Variable Model of 9 mm A. bracteata Model of 16 mm A. bracteata
Coefficient Standardized coefficient P Coefficient Standardized coefficient P
Constant 1.295 0.415 -2.709 0.372
Solar radiation 0.031 0.539 <0.001 0.081 0.599 <0.001
Wind speed 1.299 0.367 <0.001
Temperature 0.561 0.059 <0.001 1.956 0.232 <0.001
VPD -1.174 -0.069 0.012 4.994 0.123 <0.001
R2 0.606 - <0.001 0.735 - <0.001
The results of the regression model for diurnal sap flow of 16-mm A. bracteata stems indicate that, with the exception of wind speed, the effects of solar radiation, temperature and VPD on the sap flow rate were significant (P < 0.05). In addition, all three variables had a positive effect on the sap flow rate. Based on standardized coefficients, the effects of solar radiation on the sap flow rate were the largest among the four variables (0.599), followed by the effects of temperature (0.232) and VPD (0.123).

3.2.4 The effects of environmental factors of nocturnal sap flow

The results of examining the regression model for nocturnal sap flow are shown in Table 3.
Table 3 Results of the regression model for nocturnal sap flow
Variable Model of 9-mm A. bracteata Model of 16-mm A. bracteata
Coefficient Standardized coefficient P Coefficient Standardized coefficient P
Constant 25.296 0.000 33.419 0.000
Wind speed 1.232 0.158 0.000 2.090 0.157 0.000
Temperature -0.408 -0.131 0.000 -0.404 -0.076 0.011
VPD -8.408 -0.259 0.000
R2 0.038 - 0.000 0.130 - 0.000
Table 3 shows the results of examining the regression model for nocturnal sap flow. The models establish for nocturnal sap flow of 9- and 16-mm A. bracteata stems also passed a T test for significance; therefore, the degree of fitting for the two models is close to optimal. The adjusted R2 values of the models were 0.038 and 0.130, respectively, indicating that only 3.8% and 13%, respectively, of the change in the nocturnal sap flow rate could be explained by the independent variables (i.e., wind speed, temperature and VPD). The explanatory ability is relatively low, which implies that the nocturnal sap flow is affected and determined with other unknown factors, creating a topic that needs to study further.
The results of the analysis of the performance of the 16-mm A. bracteata stems show that wind speed, temperature and VPD had significant effects on the nocturnal sap flow rate (P<0.05). Based on the standardized coefficients in the model, we can conclude that wind speed has a positive effect on the sap flow rate, while temperature and VPD have a negative effect; this means a greater wind speed resulted in an increased sap flow rate, and an increase in the temperature and VPD resulted in a decreased sap flow rate.
When weighing standardized coefficients, VPD appeared to have the largest effect on sap flow rate (-0.259), followed by wind speed (0.157) and temperature (-0.076).

4 Discussion

4.1 Scaling

In this study, 9- and 16-mm-diameter stems of A. bracteata were selected as study material. The results shows that although the change in the sap flows rates of the two sizes of shrub stems followed a similar tendency, the magnitude of the sap flow rate was significantly related to the diameter of the plant stem; as plotted in Fig. 2d, the sap flow rate of 16-mm A. bracteata stems was always larger than that of 9-mm A. bracteata stems. These results are consistent with other studies conducted in forests (Hatton et al., 1995; Granier et al., 1996).
Some studies have indicated that sap flow is not positively correlated with stem diameters but with leaf area (Zhang et al., 2011). We measured the leaf area index monthly; however, Fig. 2 illustrate that the monthly sap flow was not related to leaf area but to solar radiation.
The sap flow pattern on sunny days differed significantly from that on rainy days. On rainy days, the sap flow decreased obviously; however, the following nocturnal sap flow increased or even exceeded the diurnal sap flow on rainy days.

4.2 Soil moisture

The effects of soil moisture on dewfall were also observed in the present study. When comparing the sap flow rate from 22 to 25 July 2009 (a dry period) with that from 11 to 14 August 2009 (a wet period), the results showed that the sap flow rate in wet soil period was almost similar to that in dry soil period. This suggested that soil moisture within a depth of 1 m had insignificant effects on sap flow rate of A. bracteata. The results of the present study are inconsistent with the previous findings (Stewart, 1988; Irvine et al., 1998; Granier et al., 2000; Ewers et al., 2001).
Previous studies indicated the relationship between sap flow rate and soil moisture can be expressed as a piecewise regression with a turnover point. When soil moisture fell below the turnover point, sap flow decreased linearly; however, above this point, the sap flow rate maintained saturation instead of increasing linearly (Zhang et al., 2011). From this finding, we can conclude that A. bracteata is really a drought-resistant species; even during the dry soil period, soil moisture still did not reach the turnover point for A. bracteata.
There are perhaps other explanations for the effects of soil moisture on sap flow in A. bracteata. Some studies found that the roots of A. bracteata are mainly (68.29% of the total root mass) distributed within the depths of 0-80 cm, although some may penetrate as deep as 180 cm (Zhao et al., 2010). In our study, we measured the soil mass water content within a depth of 1 m.The results showed that the sap flow rate is similar between wet soil period and dry soil period. This suggested that some A. bracteata with deep roots can also uptake water from deep soil, so the upper soil within a depth of 1 m had limited water availability.

4.3 Time lag

We found that there were time lags in the range of 30-130 minutes between the initiation of transpiration and the initiation of sap flow, which is consistent with the results of previous studies (Hogg and Hurdle, 1997; Goldstein et al., 1998; Phillips et al., 1999). Some researchers indicated that the time lags are related to the stem size and are based on stem water storage (Goldstein et al., 1998); this result was verified in our study as well, and the time lag for thicker stems was obviously larger than for thinner.
Some previous studies indicated that the time lags were associated with limited water conditions (Caspari et al., 1993; Loustau et al., 1996). The results also varied in our study; the time lag in dry soil was 110-130 minutes, and was much larger than that in wet soil (30-50 minutes).
When exploring the reasons for the effects of soil moisture on time lags, some researchers have shown that a decline in soil moisture resulted in an increase in hydraulic resistance. This in turn caused an increasing time lag because the water uptake decreased at a given water potential difference between the soil and leaves due to the increased hydraulic resistance (Sperry and Pockman, 1993; Cienciala et al., 1994; Wullschleger et al., 1998; Kumagai, 2001).

4.4 Nocturnal sap flow

The amount of nocturnal sap flow in A. bracteata and its contribution to daily water consumption is still not widely recognized, and nocturnal sap flow itself is still poorly understood. However, nocturnal sap flow was observed in A. bracteata in our study.
On sunny days, the ratio of nocturnal to diurnal sap flow varied in the range of 0.1-0.4, which represent significant nighttime water loss. The results are in agreement with previous studies; a total of 98 species were analyzed to calculate this ratio on average, which was 12.03% of the highest average ratio in the dataset of 69.00% (Forster, 2014). In addition, night-time rates of sap velocity were as high as 25% for a range of species (Fisher et al., 2007), the proportion of nocturnal sap flow as a percentage of total daily flow as high as 39% in Quercus ilex (Barbeta et al., 2012).
On rainy days, diurnal sap flow decreased significantly; after rainfall, the nocturnal sap flow increased significantly such that the ratio of nocturnal to diurnal sap flow increased and was even larger than 1.0. The results partly proved that rainfall pulses can result in a rapid increase in sap velocity (Schwinning and Sala, 2004; Zeppel et al., 2008).
Figure 4 shows that, compared with 16-mm A. bracteata stems, the ratio for thinner stems was relatively larger. Sap flow is the fluid flowing within the sapwood of a plant root, stem or branch, and nocturnal sap flow was related to either nocturnal stomatal conductance or stem refilling (Daley and Phillips, 2006; Forster, 2014). Because proportion of sapwood of younger and thinner stems is larger than that of older and thicker stems, the ratio for 9-mm A. bracteata stems was larger.

4.5 Environmental factors

The effects of environmental factors on diurnal and nocturnal sap flow were assessed, respectively, in this study. In the daytime, the effects of solar radiation, temperature, and VPD on the sap flow rate were significant. The effects of solar radiation on the sap flow rate were largest and followed by the effects of temperature and VPD. At night, wind speed, temperature and VPD also had a significant effect on the nocturnal sap flow rate; VPD had the largest effect on the sap flow rate, followed by wind speed and temperature.
In the daytime, solar radiation is the main driver for sap flow; this finding is consistent with the results previous studies which indicated that the daily sap flow rate increased linearly with solar radiation, and the diurnal course of sap flow followed that of solar radiation (Tarara and Ferguson 2001; Dragoni et al., 2006; Zhang et al., 2011).
At night, our study found the sap flow rate decreased with VPD; a previous study explained that the pattern of transpiration rate decreasing with VPD is related to stomatal regulation (Granier et al., 1996). In addition, some other studies found also an exponential decay function, including the vapor pressure deficit, accounted for variation in tree conductance. (Granier et al., 1996; Chang et al., 2006).
Through regression analysis, results showed solar radiation, wind speed, temperature, and Vpd can explain 60.6% and 73.5% of the change in the diurnal sap flow rate. We can conclude that in the daytime the environmental factors affecting sap flow mainly include solar radiation, wind speed, temperature and VPD. However, only 3.8% and 13% of the change in the nocturnal sap flow rate could be explained by wind speed, temperature and VPD; this means that at night there are certainly some other factors affecting sap flow; what those factors are remains uncertain and will require further study.

5 Conclusions

This paper discussed that sap flow variation of A. bracteata with different diameters over an entire growing season. The results showed that the sap flow rate is related to the diameter of the plant and soil moisture, but it had limited water availability within a depth of 1 m. This may be because it can obtain water from deeper soil. We also found that there were time lags in the range of 30-130 minutes between the initiation of transpiration and the initiation of sap flow, which the time lag in dry soil was larger than that in wet soil.
The ratio of nocturnal to diurnal sap flow varied in the range of 0.1-0.4. The diurnal sap flow decreased significantly on rainy days, and the nocturnal sap flow increased significantly after rainfall. These will all lead the ratio of nocturnal to diurnal sap flow increased. From the perspective of structure, the ratio of nocturnal to diurnal sap flow for thinner stems was relatively, because the sapwood ratio for 9-mm A. bracteata stems was larger. This proved that differences in wood anatomy may also influence xylem sap flow rates.
We found that the effects of solar radiation on the sap flow rate were largest and followed by the effects of temperature and VPD in the daytime. At night, VPD had the largest effect on the sap flow rate which correlated with the sap flow rate negatively, followed by wind speed and temperature. However, only 3.8% and 13% of the change in the nocturnal sap flow rate could be explained by wind speed, temperature and VPD through regression analysis; this means that at night there are certainly some other factors affecting sap flow.
[1]
Allen S J, Wallace J S, Gash J H C, et al. 1994. Measurements of albedo variation over natural vegetation in the Sahel. International Journal of Climatology, 14(6): 625-636.

DOI

[2]
Assaf G, Zieslin N. 1996. Night water consumption by rose plants. Journal of Horticultural Science, 71(5): 673-678.

DOI

[3]
Baker J M, van Bavel C H M. 1987. Measurement of mass flow of water in the stems of herbaceous plants. Plant, Cell & Environment, 10(9): 777-782.

[4]
Barbeta A, Ogaya R, Peñuelas J. 2012. Comparative study of diurnal and nocturnal sap flow of Quercus ilex and Phillyrea latifolia in a Mediterranean holm oak forest in Prades (Catalonia, NE Spain). Trees, 26(5): 1651-1659.

DOI

[5]
Batho P F. 1993. Comparative measurements of sap flow and mass loss in a young apple tree. Diss., Slaig, UK: Silsoe College, Cranfield University.

[6]
Batho P F, Weibel F P, Souch C A. 1994. Construction manual for a sap flow meter on the basis of the stem heat balance method. Internal Report, Slaig, UK: Silsoe College, Cranfield University.

[7]
Belsley D A, Kuh E, Welsch R E. 1980. Regression diagnostics:Identifying influential data and sources of collinearity. Hoboken, USA: John Wiley & Sons Inc.

[8]
Caspari H W, Green S R, Edwards W R N. 1993. Transpiration of well-watered and water-stressed Asian pear trees as determined by lysimetry, heat-pulse, and estimated by a Penman-Monteith model. Agricultural and Forest Meteorology, 67(1-2): 13-27.

DOI

[9]
Chabot R, Bouarfa S, Zimmer D, et al. 2005. Evaluation of the sap flow determined with a heat balance method to measure the transpiration of a sugarcane canopy. Agriculture Water Management, 75: 10-24.

DOI

[10]
Chang X, Zhao W, Zhang Z, et al. 2006. Sap flow and tree conductance of shelter-belt in arid region of China. Agriculture Forest Meteorology, 138: 132-141.

DOI

[11]
Chirino E, Bellot J, Sánchez J R. 2011. Daily sap flow rate as an indicator of drought avoidance mechanisms in five Mediterranean perennial species in semi-arid southeastern Spain. Trees, 25(4): 593-606.

[12]
Cienciala E, Eckersten H, Lindroth A, et al. 1994. Simulated and measured water uptake by Picea abies under non-limiting soil water conditions. Agricultural and Forest Meteorology, 71(1): 147-164.

DOI

[13]
Daley M J, Phillips N G. 2006. Interspecific variation in nighttime transpiration and stomatal conductance in a mixed New England deciduous forest. Tree Physiology, 26(4): 411-419.

DOI PMID

[14]
Donovan L A, Grisé D J, West J B, et al. 1999. Predawn disequilibrium between plant and soil water potentials in two cold-desert shrubs. Oecologia, 120(2): 209-217.

DOI PMID

[15]
Dragoni D, Lakso A N, Piccioni R M, et al. 2006. Transpiration of grapevines in the humid northeastern United States. American Journal of Enol Viticult, 57(4): 460-467.

DOI

[16]
Ewers B E, Oren R, Phillips N, et al. 2001. Mean canopy stomatal conductance responses to water and nutrient availabilities in Picea abies and Pinus taeda. Tree Physiology, 21(12-13): 841-850.

PMID

[17]
Fernández J E, Palomo M J, Díaz-Espejo A, et al. 2001. Heat-pulse measurements of sap flow in olives for automating irrigation: Tests, root flow and diagnostics of water stress. Agricultural Water Management, 51: 99-123.

DOI

[18]
Fisher J B, Baldocchi D D, Misson L, et al. 2007. What the towers don't see at night: Nocturnal sap flow in trees and shrubs at two AmeriFlux sites in California. Tree Physiology, 27(4): 597-610.

PMID

[19]
Forster M A. 2014. How significant is nocturnal sap flow? Tree Physiology, 34(7): 757-765.

DOI PMID

[20]
Freund R, Littell R, Creighton L. 2003. Regression using JMP. Technometrics, 46: 370-371.

[21]
Giorio P, Giorio G. 2003. Sap flow of several olive trees estimated with the heat-pulse technique by continuous monitoring of a single gauge. Environmental and Experimental Botany, 49(1): 9-20.

DOI

[22]
Goldhamer D A, Fereres E. 2001. Irrigation scheduling protocols using continuously recorded trunk diameter measurements. Irrigation Science, 20(3): 115-125.

DOI

[23]
Goldstein G, Andrade J L, Meinzer F C, et al. 1998. Stem water storage and diurnal patterns of water use in tropical forest canopy trees. Plant, Cell & Environment, 21(4): 397-406.

[24]
Gonzalez-Altozano P, Pavel E W, Oncins J A. et al. 2008. Comparative assessment of five methods of determining sap flow in peach trees. Agricultural Water Management, 95(5): 503-515.

DOI

[25]
Granier A. 1987. Evaluation of transpiration in a Douglas-fir stand by means of sap flow measurements. Tree Physiology, 3(4): 309-320.

DOI PMID

[26]
Granier A, Biron P, Breda N, et al. 1996. Transpiration of trees and forest stands: Short and long-term monitoring using sapflow methods. Global Change Biology, 2(3): 265-274.

DOI

[27]
Granier A, Loustau D, Bréda N. 2000. A generic model of forest canopy conductance dependent on climate, soil water availability and leaf area index. Annals of Forest Science, 57(8): 755-765.

DOI

[28]
Grime V L, Morison J I L, Simmonds L P. 1995. Including the heat storage term in sap flow measurements with the stem heat balance method. Agricultural and Forest Meteorology, 74(1-2): 1-25.

DOI

[29]
Guo Y, Ding G, Wu B, et al. 2010. Stem sap flow dynamics of Atraphaxis bracteata in Mu Us sandy area. Bulletin of Soil and Water Conservation, 30: 22-25. (in Chinese)

[30]
Hacke U G, Sperry J S. 2001. Functional and ecological xylem anatomy. Perspectives in Plant Ecology Evolution and Systematics, 4: 97-115.

DOI

[31]
Hatton T J, Moore S J, Reece P H. 1995. Estimating stand transpiration in a Eucalyptus populnea woodland with the heat pulse method: Measurement errors and sampling strategies. Tree Physiology, 15(4): 219-227.

PMID

[32]
Hogg E H, Hurdle P A. 1997. Sap flow in trembling aspen: Implications for stomatal responses to vapor pressure deficit. Tree Physiology, 17(8-9): 501-509.

DOI

[33]
Huang L, Zhang Z S, Li X R. 2010. Sap flow of Artemisia ordosica and the influence of environmental factors in a revegetated desert area: Tengger Desert, China. Hydrological Processes, 24(10): 1248-1253.

[34]
Irvine J, Perks M P, Magnani F, et al. 1998. The response of Pinus sylvestris to drought: Stomatal control of transpiration and hydraulic conductance. Tree Physiology, 18(6): 393-402.

PMID

[35]
Ishida T, Campbell G S, Calissendorff C. 1991. Improved heat balance method for determining sap flow rate. Agricultural and Forest Meteorology, 56(1-2): 35-48.

DOI

[36]
Jones H G. 1999. Use of infrared thermometry for estimation of stomatal conductance as a possible aid to irrigation scheduling. Agricultural and Forest Meteorology, 95(3): 139-149.

DOI

[37]
Jones H G. 2004. Irrigation scheduling: Advantages and pitfalls of plant-based methods. Journal of Experimental Botany, 55(407): 2427-2436.

DOI PMID

[38]
Kumagai T. 2001. Modeling water transportation and storage in sapwood-model development and validation. Agricultural and Forest Meteorology, 109(2): 105-115.

DOI

[39]
Kume T, Takizawa H, Yoshifuji N, et al. 2007. Impact of soil drought on sap flow and water status of evergreen trees in a tropical monsoon forest in northern Thailand. Forest Ecology and Management, 238(1-3): 220-230.

DOI

[40]
Link S O, Thiede M E, van Bavel M G. 1998. An improved strain—gauge device for continuous field measurement of stem and fruit diameter. Journal of Experimental Botany, 49: 1583-1587.

DOI

[41]
Loustau D, Berbigier P, Roumagnac P, et al. 1996. Transpiration of a 64-year-old maritime pine stand in Portugal. Oecologia, 107(1): 33-42.

DOI PMID

[42]
Marquardt D W, Snee R D. 1970. Generalized in inverses, Ridge regression, Biased linear estimation. Technometrics, 12(3): 591-612.

[43]
Matyssek R, Günthardt-Goerg M S, Maurer S, et al. 1995. Nighttime exposure to ozone reduces whole-plant production in Betula pendula. Tree Physiology, 15(3): 159-165.

PMID

[44]
Möller M, Alchanatis V, Cohen Y, et al. 2007. Use of thermal and visible imagery for estimating crop water status of irrigated grapevine. Journal of Experimental Botany, 58: 827-838.

PMID

[45]
Neter J, Kutner M, Wasserman W, et al. 1996. Applied linear statistical models. New York, USA: McGraw Hill/Irwin.

[46]
Noy-Meir I. 1973. Desert ecosystems: Environment and producers. Annual Review of Ecology and Systematics, 4: 25-51.

DOI

[47]
Phillips N, Oren R, Zimmermann R. 1996. Radial patterns of xylem sap flow in non-, diffuse- and ring-porous tree species. Plant, Cell & Environment, 19(8): 983-990.

[48]
Phillips N, Oren R, Zimmermann R, et al. 1999. Temporal patterns of water flux in trees and lianas in a Panamanian moist forest. Trees, 14(3): 116-123.

DOI

[49]
Rawson H M, Clarke J. 1988. Nocturnal transpiration in wheat. Functional Plant Biology, 15(3): 397-406.

DOI

[50]
Sakuratani T. 1981. A heat balance method for measuring water flux in the stem of intact plants. Journal of Agricultural Meteorology, 37: 9-17.

DOI

[51]
Sakuratani T. 1984. Improvement of the probe for measuring water flow rate in intact plants with the stem heat balance method. Journal of Agricultural Meteorology, 40(3): 273-277.

DOI

[52]
Sakuratani T. 1987. Studies on evapotranspiration from crops: Separate estimation of transpiration and evaporation from a soybean field without water shortage. Journal of Agricultural Meteorology, 42: 309-317.

DOI

[53]
Schwinning S, Sala O E. 2004. Hierarchy of responses to resource pulses in arid and semi-arid ecosystems. Oecologia, 141(2): 211-220.

PMID

[54]
Smith D, Allen S. 1996. Measurement of sap flow in plant stems. Journal of Experimental Botany, 47(305): 1833-1844.

DOI

[55]
Snyder K A, Richards J H, Donovan L A. 2003. Night-time conductance in C-3 and C-4 species: Do plants lose water at night? Journal of Experimental Botany, 54: 861-865.

PMID

[56]
Sperry J S, Pockman W T. 1993. Limitation of transpiration by hydraulic conductance and xylem cavitation in Betula occidentalis. Plant, Cell & Environment, 16(3): 279-287.

[57]
Steinberg S, van Bavel C H M, McFarland M J. 1989. A gauge to measure mass flow rate of sap in stems and trunks of woody plants. Journal of the American Society for Horticultural Science, 114(3): 466-472.

DOI

[58]
Stewart J B. 1988. Modelling surface conductance of pine forest. Agricultural Forest Meteorology, 43(1): 19-35.

DOI

[59]
Swanson R H. 1994. Significant historical developments in thermal methods for measuring sap flow in trees. Agricultural Forest Meteorology, 72: 113-132.

DOI

[60]
Tarara J M, Ferguson J C. 2001. Device for simulating high rates of sap flow in grapevines. American Journal of Enology and Viticulture, 52: 260-265.

DOI

[61]
Weibel F, Boersma K. 1995. An improved stem heat balance method using analog heat control. Agricultural and Forest Meteorology, 75: 191-208.

DOI

[62]
Winner W E, Lefohn A S, Cotter I S, et al. 1989. Plant responses to elevational gradients of O3 exposures in Virginia. Proceedings of the National Academy of Sciences of USA, 86: 8828-8832.

DOI

[63]
Wullschleger S D, Meinzer F C, Vertessy R A. 1998. A review of whole-plant water use studies in tree. Tree Physiology, 18(8-9): 499-512.

DOI

[64]
Yamane T, Hamana Y, Nakano M. 2011. Detection of water-deficit stress from daily sap flow profiles in peach. Journal of the Japanese Society for Horticultural Science, 80(4): 383-389.

DOI

[65]
Yamane T, Shibayama K, Hamana Y, et al. 2009. Response of container-grown girdled grapevines to short-term water-deficit stress. American Journal of Enology and Viticulture, 60: 50-56.

DOI

[66]
Yan F, Wu B. 2013. Desertification progress in Mu Us Sandy Land over the past 40 years. Arid Land Geography, 36: 987-995. (in Chinese)

[67]
Yang X, Zhang K, Cao Y, et al. 2009. Plant diversity in the process of vegetation restoration in Yanchi County of Ningxia Hui Nationality Autonomous Region. Bulletin of Soil and Water Conservation, 29: 163-167. (in Chinese)

[68]
Yu Z H, Chen Y M, Du S. 2009. The sapflow dynamics of Platycladus orientali in the semi-arid Loess Plateau region. Acta Ecologica Sinica, 29(7): 3970-3976. (in Chinese)

[69]
Yue G Y, Zhao H L, Zhang T H, et al. 2008. Evaluation of water use of Caragana microphylla with the stem heat-balance method in Horqin Sandy Land, Inner Mongolia, China. Agricultural and Forest Meteorology, 148(11): 1668-1678.

DOI

[70]
Zeppel M, Macinnis-Ng C M O, Ford C R, et al. 2008. The response of sap flow to pulses of rain in a temperate Australian woodland. Plant and Soil, 305(1): 121-130.

DOI

[71]
Zhang Y, Kang S, Ward E J, et al. 2011. Evapotranspiration components determined by sap flow and microlysimetry techniques of a vineyard in northwest China: Dynamics and influential factors. Agricultural Water Management, 98(8): 1207-1214.

DOI

[72]
Zhao C Y, Si J H, Feng Q, et al. 2019. Nighttime transpiration of Populus euphratica during different phenophases. Journal of Forestry Research, 30(2): 435-444.

DOI

[73]
Zhao Y, Zhou W, Sun B, et al. 2010. Root distribution of three desert shrubs and soil moisture in Mu Us sand land. Research Soil Water Conservation, 17: 129-132. (in Chinese)

Outlines

/