
Journal of Resources and Ecology >
Effects of Seedling Methods on Germination and Growth of Sophora japonica L.
|
YAO Jingjing, E-mail: yaojing1989_lucky@163.com |
Received date: 2022-08-25
Accepted date: 2023-04-18
Online published: 2023-07-14
Supported by
Key Research and Development Program of China(2017YFC0504404)
The Key Research and Development Plan Projects of Ningxia Hui Autonomous Region(2018BFG02002)
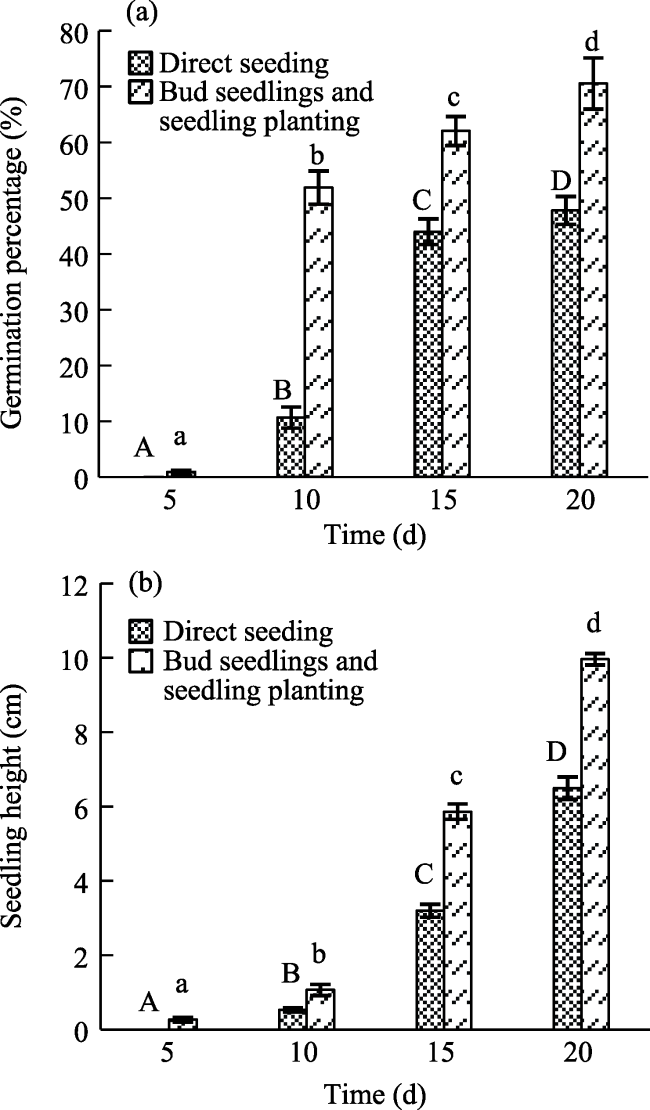
Bud seedlings were used in this study to overcome the disadvantages of the frequently-used active vegetation restoration methods such as direct seeding and plant seedlings for mining areas. Survival and growth characteristics of Sophora japonica L. by bud seedlings, seedling planting, and direct seeding methods were investigated through field plantation experiments in Changping District of Beijing, China. Nine plots (5 m×1 m) with slope of 25° were conducted and divided into 3 groups according to aspects of west, southwest, as well as south, and seeds were planted by following the three methods in each aspect. Germination, survival, seedling growth, and root parameters of each treatment were analyzed through one-way analysis of variance, paired-sample t test, repeated measures analysis of variance, and multivariate analysis of variance to evaluate the effectiveness of the three seedling methods. The results showed that seedling planting and bud seedlings promoted seeds germination and growth, with a germination percentage of 70.58% and seedling height of 9.97 cm before transplantation, which were 1.48 times and 1.53 times higher than direct seeding, respectively. Moreover, bud seedlings showed the largest survival rate, seedling height, and root biomass under all aspects after transplantation (P<0.05), and at the end of the study, the largest values of the above indicators were 88.33 % in BW (the plot with seedling method of bud seedlings in aspect west), 158.36 cm in BS (the plot with seedling method of bud seedlings in aspect west south), and 131.5 g in BS, respectively. The effect of seedling method on seedling growth was most significant and increased with time, with effect sizes of 0.290 and 0.199 on seedling height and growth rate in 2020, respectively. Overall, bud seedlings could extract the advantages and overcome the disadvantages of seedling planting and direct seeding, which can be considered as a better method for vegetation restoration in the mining areas.
YAO Jingjing , ZHANG Chengliang , HAN Shuang , LIU Mengfan , WANG Yan , CAO Wenbo . Effects of Seedling Methods on Germination and Growth of Sophora japonica L.[J]. Journal of Resources and Ecology, 2023 , 14(4) : 868 -879 . DOI: 10.5814/j.issn.1674-764x.2023.04.019
Table 1 Plots characteristics |
| Plots/Treatment | Slope (°) | Aspect | Seedling methods |
|---|---|---|---|
| DW | 25 | West | Direct seeding |
| BW | 25 | West | Bud seedlings |
| SW | 25 | West | Seedling planting |
| DSW | 25 | Southwest | Direct seeding |
| BSW | 25 | Southwest | Bud seedlings |
| SSW | 25 | Southwest | Seedling planting |
| DS | 25 | South | Direct seeding |
| BS | 25 | South | Bud seedlings |
| SS | 25 | South | Seedling planting |
Fig. 1 Plant germination percentage and seedling height of different seedling methodsNote: (a) Germination percentage, and different letters of a given seedling method indicate that germination percentage varies significantly (0.05 level) with time; (b) Seedling height, and different letters of a given seedling method indicate that seedling height varies significantly (0.05 level) with time. |
Table 2 Paired-sample t test results of germination percentage and seedling height at a given time across sowing methods |
| Days after sowing | P | |
|---|---|---|
| Germination percentage | Seedling height | |
| 5 | 0.032 | 0.015 |
| 10 | 0.010 | 0.003 |
| 15 | 0.007 | 0.004 |
| 20 | 0.003 | 0.005 |
Table 3 Seedling height and survival rate of different seedling methods |
| Treatment | Seedling height (cm) | Survival rate (%) | ||||||
|---|---|---|---|---|---|---|---|---|
| 2018 | 2019 | 2020 | 2018 | 2019 | 2020 | |||
| All | Surviving in September, 2020 | All | Surviving in September, 2020 | Surviving in September, 2020 | ||||
| DW | 47.47±9.00a | 47.94±9.33aA | 73.78±9.01a | 73.73±9.10aB | 100.71±12.61aC | 95.00 | 83.33 | 81.67 |
| BW | 55.48±13.21b | 56.21±13.42bA | 94.38±17.94bc | 94.38±17.94bcB | 133.58±25.70dC | 96.67 | 88.33 | 88.33 |
| SW | 48.87±9.32a | 49.10±9.47aA | 77.24±13.81a | 77.38±13.92aB | 107.06±17.76aC | 90.00 | 81.67 | 80.00 |
| DSW | 47.58±7.50a | 48.93±7.38aA | 78.51±7.47a | 78.68±7.61aB | 104.52±10.59aC | 91.67 | 78.33 | 73.33 |
| BSW | 58.31±11.89bc | 60.18±11.89bA | 102.51±18.39d | 103.42±18.75dB | 136.56±24.37dC | 91.67 | 81.67 | 75.00 |
| SSW | 47.79±9.21a | 49.51±9.09aA | 89.04±15.11b | 89.91±15.59bB | 117.26±19.56bC | 86.67 | 80.00 | 71.67 |
| DS | 48.73±8.22a | 50.24±8.17aA | 93.17±14.85bc | 95.15±13.89bcB | 123.80±16.63bcC | 85.00 | 76.67 | 68.33 |
| BS | 61.98±16.04c | 66.30±14.29cA | 115.13±25.37e | 117.48±24.00eB | 158.36±35.57eC | 90.00 | 78.33 | 73.33 |
| SS | 57.74±11.34bc | 60.61±10.04bA | 97.22±20.17cd | 99.68±19.36cdB | 131.90±26.76cdC | 83.33 | 75.00 | 68.33 |
Note: (a) Different lowercase letters indicate that seedling height of a given year varies significantly (0.05 level) with treatments. (b) Different capital letters indicate that seedling height of a given plot varies significantly (0.05 level) with time. |
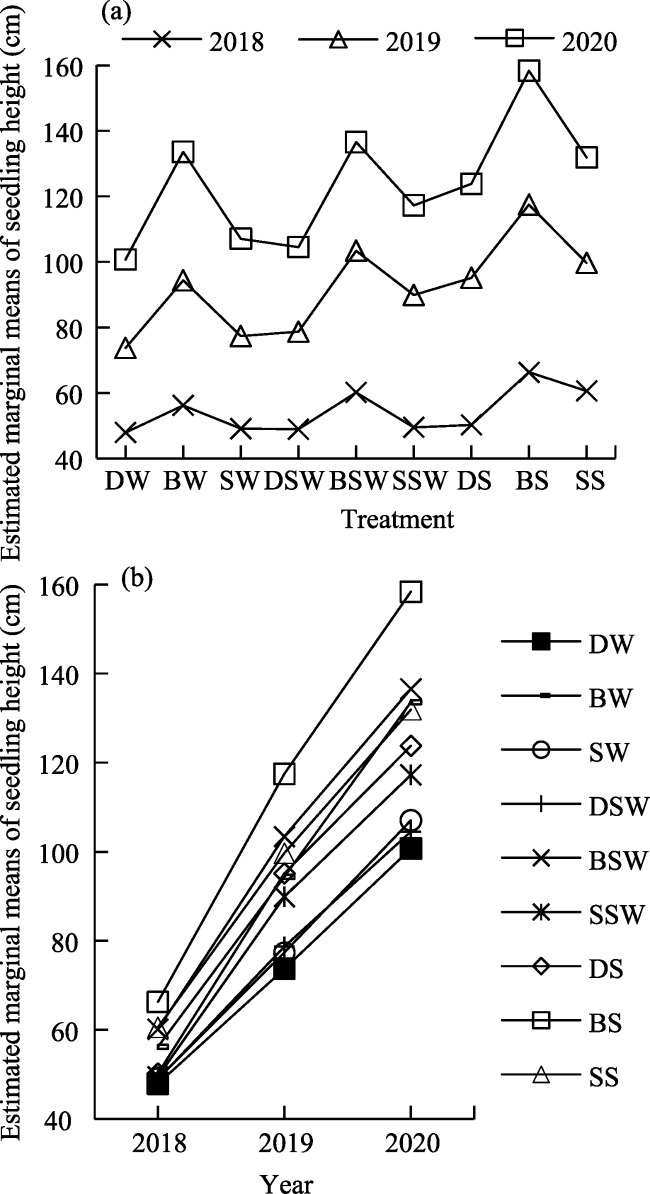
Table 4 Multivariate tests for the effects of time and treatment on seedling height based on repeated measures analysis of variance a |
| Effect | Inspection methods | Multivariate tests | F | Hypothesis df | Error df | Sig. | Partial eta squared |
|---|---|---|---|---|---|---|---|
| Time | Pillai’s Trace | 0.949 | 3681.474b | 2.000 | 398.000 | <0.001 | 0.949 |
| Wilks’ Lambda | 0.051 | 3681.474b | 2.000 | 398.000 | <0.001 | 0.949 | |
| Hotelling’s Trace | 18.500 | 3681.474b | 2.000 | 398.000 | <0.001 | 0.949 | |
| Roy’s Largest Root | 18.500 | 3681.474b | 2.000 | 398.000 | <0.001 | 0.949 | |
| Time × Treatment | Pillai’s Trace | 0.524 | 17.702 | 16.000 | 798.000 | <0.001 | 0.262 |
| Wilks’ Lambda | 0.535 | 18.239b | 16.000 | 796.000 | <0.001 | 0.268 | |
| Hotelling’s Trace | 0.757 | 18.778 | 16.000 | 794.000 | <0.001 | 0.275 | |
| Roy’s Largest Root | 0.558 | 27.845c | 8.000 | 399.000 | <0.001 | 0.358 |
Note: The within-subjects variables are seedling height data in 2018, 2019, and 2020 of seedlings surviving in 2020. The between-subjects variable is treatment. a. Design: Intercept + treatments, and within subjects design: time. b. Exact statistic. c. The statistic is an upper bound on F that yields a lower bound on the significance level. |
Fig. 2 Estimated marginal means of seedling height based on repeated measures analysis of variance |
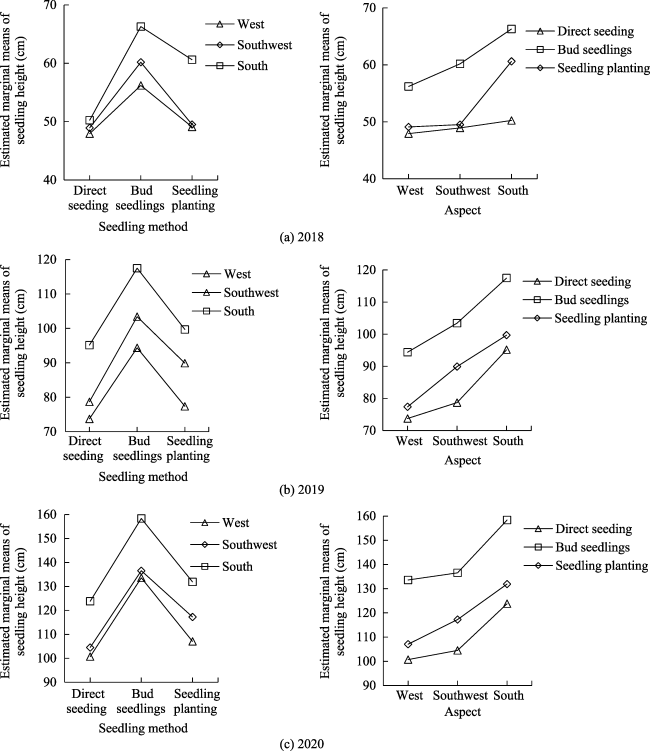
Table 5 Tests of between-subjects effects for the effects of seedling method and aspect on seedling height based on multivariate analysis of variance |
| Source | Sig. | Partial eta squared | ||||
|---|---|---|---|---|---|---|
| 2018 | 2019 | 2020 | 2018 | 2019 | 2020 | |
| Corrected model | <0.001 | <0.001 | <0.001 | 0.260a | 0.406b | 0.388c |
| Intercept | <0.001 | <0.001 | <0.001 | 0.964 | 0.970 | 0.969 |
| Seedling method | <0.001 | <0.001 | <0.001 | 0.181 | 0.261 | 0.290 |
| Aspect | <0.001 | <0.001 | <0.001 | 0.093 | 0.244 | 0.178 |
| Seedling method×Aspect | 0.011 | 0.562 | 0.775 | 0.032 | 0.007 | 0.004 |
Note: The dependent variables are seedling height data in 2018, 2019, and 2020 of seedlings surviving in 2020, respectively. The fixed variables are seedling method and aspect. a. R2=0.260 (adjusted R2=0.245). b. R2=0.406 (adjusted R2=0.394). c. R2=0.388 (adjusted R2 = 0.376). |
Fig. 3 Estimated marginal means of seedling height in 2018, 2019, and 2020 based on multivariate analysis of variance |
Table 6 Annual growth (cm) of seedlings under different seedling methods |
| Treatment | 2018 | 2019 | 2020 | ||
|---|---|---|---|---|---|
| All | Surviving in September, 2020 | All | Surviving in September, 2020 | ||
| DW | 47.47±9.00a | 47.94±9.33aB | 25.76±6.52a | 25.80±6.58aA | 26.98±7.36aA |
| BW | 55.48±13.21b | 56.21±13.42bB | 38.17±11.70b | 38.17±11.70bA | 39.21±11.54dA |
| SW | 48.87±9.32a | 49.10±9.47aB | 28.43±8.76a | 28.27±8.78aA | 29.69±7.91abcA |
| DSW | 47.58±7.50a | 48.93±7.38aB | 29.79±6.00a | 29.75±5.69aA | 25.84±5.53aA |
| BSW | 58.31±11.89bc | 60.18±11.89bC | 42.80±12.06bc | 43.24±12.49cdB | 33.13±8.87cA |
| SSW | 47.79±9.21a | 49.51±9.09aC | 40.35±10.60bc | 40.40±11.10bcdB | 27.35±6.42aA |
| DS | 48.73±8.22a | 50.24±8.17aB | 43.63±9.77c | 44.90±9.30dB | 28.66±7.17abA |
| BS | 61.98±16.04c | 66.30±14.29cC | 50.00±17.55d | 51.18±17.29eB | 40.89±13.91dA |
| SS | 57.74±11.34bc | 60.61±10.04bC | 38.27±13.33b | 39.07±13.64bcB | 32.22±10.47bcA |
Note: (a) 2018 annual growth values are equal to seedling height values in Table 3. (b) Different lowercase letters indicate that annual growth of seedlings in a given year varies significantly (0.05 level) with treatments. (c) Different capital letters indicate that annual growth of seedlings in a given plot varies significantly (0.05 level) with time. |
Table 7 Multivariate tests for the effects of time and treatment on annual growth based on repeated measures analysis of variancea |
| Effect | Inspection methods | Multivariate tests | F | Hypothesis df | Error df | Sig. | Partial eta squared |
|---|---|---|---|---|---|---|---|
| Time | Pillai’s Trace | 0.831 | 979.207b | 2.000 | 398.000 | <0.001 | 0.831 |
| Wilks’ Lambda | 0.169 | 979.207b | 2.000 | 398.000 | <0.001 | 979.207b | |
| Hotelling’s Trace | 4.921 | 979.207b | 2.000 | 398.000 | <0.001 | 979.207b | |
| Roy’s Largest Root | 4.921 | 979.207b | 2.000 | 398.000 | <0.001 | 979.207b | |
| Time×Treatment | Pillai’s Trace | 0.291 | 8.477 | 16.000 | 798.000 | <0.001 | 0.145 |
| Wilks’ Lambda | 0.726 | 8.649b | 16.000 | 796.000 | <0.001 | 0.148 | |
| Hotelling’s Trace | 0.355 | 8.821 | 16.000 | 794.000 | <0.001 | 0.151 | |
| Roy’s Largest Root | 0.273 | 13.638c | 8.000 | 399.000 | <0.001 | 0.215 |
Note: The within-subjects variables are annual growth data in 2018, 2019, and 2020 of seedlings surviving in 2020. The between-subjects variable is treatment. a. Design: Intercept + treatments, and within subjects design: time. b. Exact statistic. c. The statistic is an upper bound on F that yields a lower bound on the significance level. |
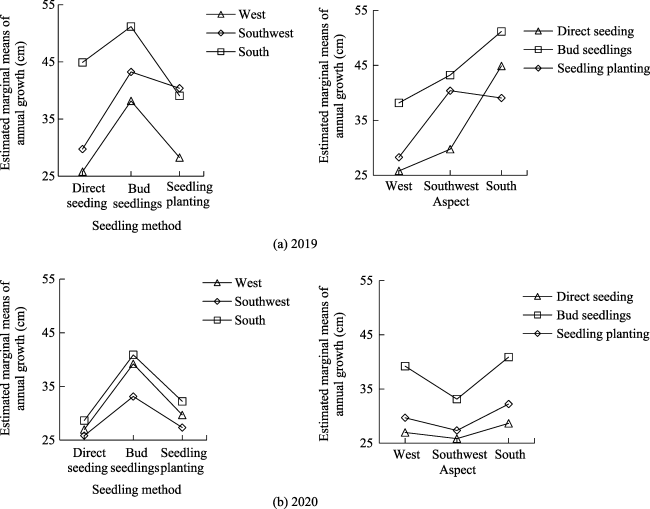
Table 8 Tests of Between-Subjects Effects for the effects of seedling method and aspect on annual growth based on multivariate analysis of variance |
| Source | Sig. | Partial eta squared | ||
|---|---|---|---|---|
| 2019 | 2020 | 2019 | 2020 | |
| Corrected model | <0.001 | <0.001 | 0.341a | 0.242 |
| Intercept | <0.001 | <0.001 | 0.921 | 0.923 |
| Seedling method | <0.001 | <0.001 | 0.148 | 0.199 |
| Aspect | <0.001 | <0.001 | 0.219 | 0.049 |
| Seedling method× Aspect | <0.001 | 0.325 | 0.057 | 0.012 |
Note: The dependent variables are annual growth data in 2018, 2019, and 2020 of seedlings surviving in 2020, respectively. The fixed variables are seedling method and aspect. Values in 2018 are by definition identical to those in Table 5. a. R2= 0.341 (adjusted R2 = 0.328). b. R2= 0.242 (adjusted R2=0.227). |
Fig. 4 Estimated marginal means of annual growth based on repeated measures analysis of variance |
Fig. 5 Estimated marginal means of annual growth in 2019 and 2020 based on multivariate analysis of variance |
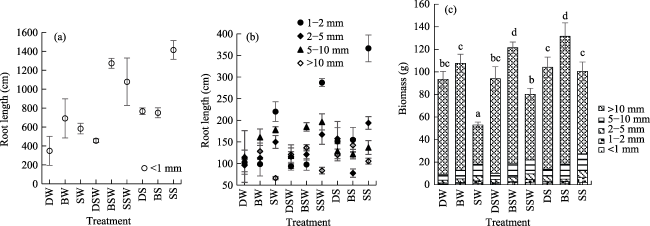
Fig. 6 Biomass and length of roots under different seedling methodsNote: (a) Root length of < 1 mm under different seedling methods; (b) Root length of 1-2 mm, 2-5 mm, 5-10 mm and > 10 mm under different seedling methods; (c) Biomass of below-ground, and different letters indicate that biomass above-ground varies significantly (0.05 level) with treatments. |
| [1] |
|
| [2] |
|
| [3] |
|
| [4] |
|
| [5] |
|
| [6] |
|
| [7] |
|
| [8] |
|
| [9] |
|
| [10] |
|
| [11] |
|
| [12] |
|
| [13] |
|
| [14] |
|
| [15] |
|
| [16] |
|
| [17] |
|
| [18] |
|
| [19] |
|
| [20] |
|
| [21] |
|
| [22] |
|
| [23] |
|
| [24] |
|
| [25] |
|
| [26] |
|
| [27] |
|
| [28] |
|
| [29] |
|
| [30] |
|
| [31] |
|
| [32] |
|
| [33] |
|
| [34] |
|
| [35] |
|
| [36] |
|
| [37] |
|
| [38] |
|
| [39] |
|
| [40] |
|
| [41] |
|
| [42] |
|
| [43] |
|
| [44] |
|
| [45] |
|
| [46] |
|
| [47] |
|
| [48] |
|
| [49] |
|
| [50] |
|
| [51] |
|
| [52] |
|
| [53] |
|
/
| 〈 |
|
〉 |
