Revegetation and Management of Mines

Analysis of Salinization Characteristics of Artificial Greenland Stratified Soils and Their Influencing Factors in the Eastern Part of the Arid Desert Region of Northwest China

  • FAN Shiqi , 1 ,
  • ZHANG Panyue , 2, * ,
  • YANG Jianying , 1, * ,
  • BAI Weijie 3 ,
  • MA Wenzhang 1 ,
  • ZHANG Ben 1 ,
  • LI Jiajing 1
Expand
  • 1. School of Soil and Water Conservation, Beijing Forestry University, Beijing 100083, China
  • 2. School of Environmental Science and Engineering, Beijing Forestry University, Beijing 100083, China
  • 3. Haibowan Branch, Forestry and Grassland Bureau, Wuhai, Inner Mongolia 016000, China
*ZHANG Panyue, E-mail: ;
YANG Jianying, E-mail:

FAN Shiqi, E-mail:

Received date: 2022-10-31

  Accepted date: 2023-03-30

  Online published: 2023-07-14

Supported by

Key Research and Development Program of China(2017YFC0504405)

The Inner Mongolia Autonomous Region Science and Technology Major Project(2020ZD0021-03)

The Key Research and Development Program of Ningxia Hui Autonomous Region(2018BFG02002)

Abstract

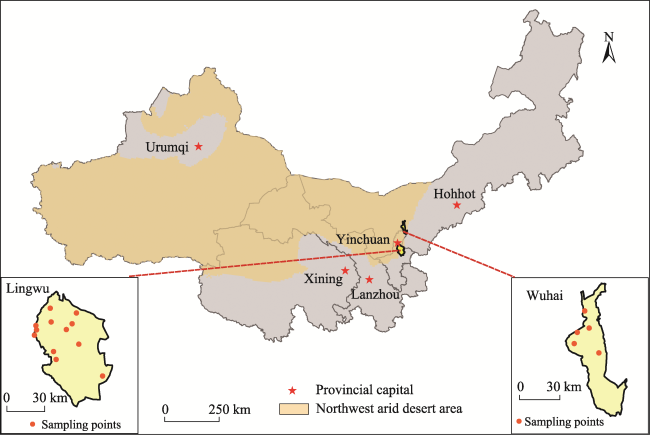
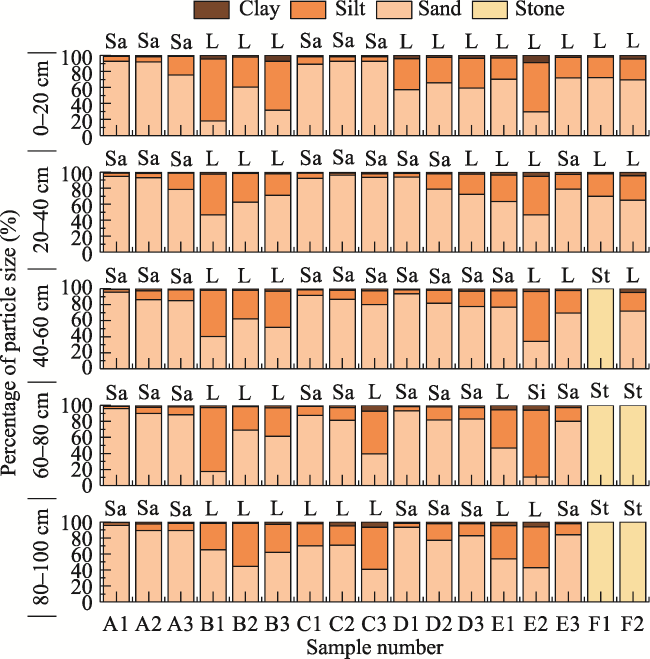
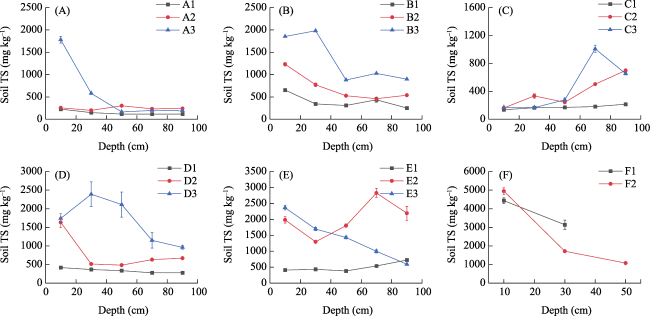
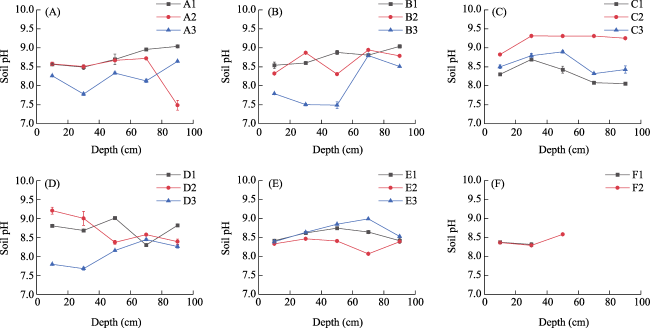
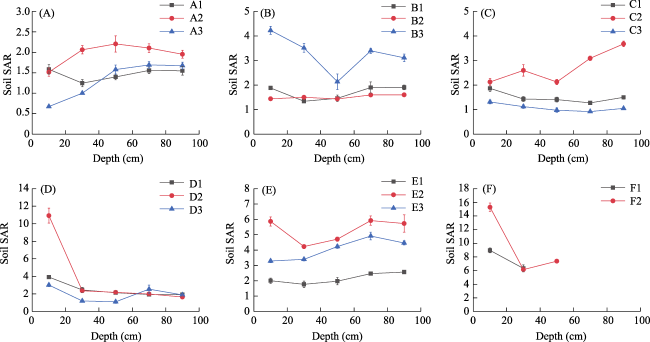
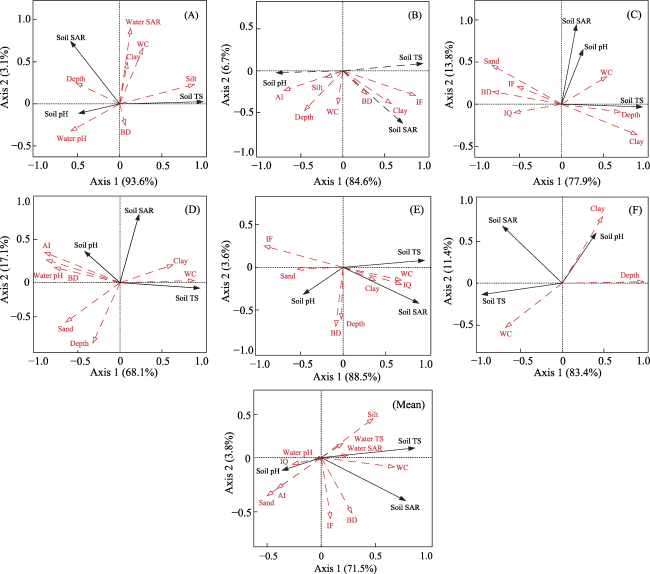
In this study, Wuhai in Inner Mongolia and Lingwu in Ningxia in the eastern part of the northwest arid desert region were used as the study area, and six types of soil profiles were selected on artificial green areas to study their salinization characteristics, namely, homogeneous sandy soil (A), homogeneous loamy soil (B), upper sand lower loam (C), upper loam lower sand (D), sandwich type (E) (loam-sand-loam (E1), loam-powder-loam (E2), sand-loam-sand-loam (E3)), and upper loam lower stone (F). In addition, the effects of irrigation, soil physical, and soil depth factors on soil salinization were investigated using redundancy analysis (RDA). The results showed that: (1) the total salt (TS) of soil profiles ranged from 115.5 to 4945.5 mg kg-1. Moreover, 6.7%, 26.7%, 6.7%, 20.0%, 33.3%, and 40.0% of the soils in profile types A, B, C, D, E, and F, respectively, reached light salinization; 13.3%, 20.0%, and 20.0% of the soils in profile types D, E, and F, respectively, reached moderate salinization; in addition, only profile type F showed heavy salinization with a high percentage of 40.0%. On the other hand, soil profile types A, B, D, and F were predominantly surface accumulation type, while soil profile type C was bottom accumulation type. In addition, profiles E1 and E2 in the E-type soil profile were bottom accumulation type, while profile E3 was surface accumulation type; (2) Soil pH and soil SAR ranged from 7.49 to 9.31 and 0.67 to 15.28, respectively; (3) The results of the RDA analysis showed that the first two axes explained more than 74.0% of the soil salinity variance, indicating the obvious relationship between soil salinity and the influencing factors. Silt content, irrigation frequency, clay content, annual irrigation volume, irrigation frequency, and soil depth were the major factors influencing soil salinity in soil profile types A, B, C, D, E, and F, respectively, while soil water content and soil salinity had highly significant co-spatial characteristics (P < 0.01).

Cite this article

FAN Shiqi , ZHANG Panyue , YANG Jianying , BAI Weijie , MA Wenzhang , ZHANG Ben , LI Jiajing . Analysis of Salinization Characteristics of Artificial Greenland Stratified Soils and Their Influencing Factors in the Eastern Part of the Arid Desert Region of Northwest China[J]. Journal of Resources and Ecology, 2023 , 14(4) : 856 -867 . DOI: 10.5814/j.issn.1674-764x.2023.04.018

1 Introduction

Soil salinization is a land degradation phenomenon that commonly occurs in arid and semi-arid regions globally, changing the soil environment and affecting the growth and reproduction of soil microorganisms and plants (Li et al., 2016; Li et al., 2020). Indeed, data from the second soil census of China showed that the saline soil area in China was about 3.6 × 10⁷ ha, of which the saline soil area in the arid and semi-arid northwest region accounted for about 70.0% of the soil saline area (Liu et al., 2013; Xu et al., 2019a). The arid desert region of Northwest China belongs to the typical temperate continental arid climate, which is characterized by high evaporation rates, high contents of soil parent materials, high groundwater mineralization, scarce freshwater resources, and strong dependence of artificial green and arable lands on irrigation (Dou et al., 2022).
In recent years, the rapid development of urban ecological construction, the increased irrigation water consumption, and unreasonable human land use and water management practices have resulted in significant secondary soil salinization (Yu et al., 2015). Soil salinization is the process of soluble salt accumulation in the soil surface layer from deeper soil layers, with the occurrence of the water evaporation process. However, in the case of irrigation practices, soluble salts can be transported downward following the infiltration of irrigation water. Therefore, irrigation water quality and irrigation practices can significantly influence soil salinization (Lekakis and Antonopoulos, 2015; Guo et al., 2017; Cui et al., 2018; Zheng et al., 2020). Nevertheless, their effects vary depending on topographic, pedological, and land cover classes. Irrigation water contains a certain amount of dissolved substances, such as salt ions and toxic elements, of which the type and contents can result in different effects on soil physicochemical properties, plant growth, and reproduction depending on soil, salt, content, plant species, plant growth stage, and other characteristics (Ghazaryan and Chen, 2016). In this paper, the cities of Wuhai in Inner Mongolia and Lingwu in Ningxia were chosen as the study areas, where irrigation water mainly comes from the Yellow River water, and partly from groundwater and domestic sewage treatment water. The quality of Yellow River water varies when transported to the sample sites due to a variety of factors, such as salinity from irrigation drainage leads to increased salinity of Yellow River water along the Yellow River; Yellow River water constantly interacts with rocks and soil during transport, leading to changes in water quality with changes in migration path and residence time; and precipitation dilutes Yellow River water. Fan et al. (2022) investigated the water quality of surface and groundwater in Ningxia and revealed that ditch water and the Yellow River had the highest and lowest salinity levels, respectively, while lake, pond, canal, and groundwater values exhibited moderate salinity levels. The development of a reasonable irrigation system needs to take into account the problem of the effect of irrigation water on soil salinity on the one hand, and the requirements of plants for soil moisture on the other. With inadequate drainage systems, excessive irrigation tends to cause a rise in the water table and an increase in the amount of saline, shallowly buried groundwater rising through capillary pores, leading to increased soil salinization. The drainage system was installed in the study area except for the plain area in Lingwu City, and the rest of the artificial green space sample sites were not equipped with drainage measures.
At present, research on soil salinization in arid desert areas of northwest China has mainly focused on cultivated land, while only a few studies have focused on artificial Greenland. Artificial Greenland includes artificial grassland and artificial woodland, which can improve the environment, microclimate, and salinized soil, as well as prevent soil erosion, wind damage, and sand disasters and improve salinized soil. Cultivated land is mainly distributed in plain areas, where low topography, uniform soil quality, and fertile soils are observed, while artificial Greenland is widely distributed in areas where different soil types are present, with partial irrigation practices and maintenance conditions as compared with cultivated land. Moreover, plant species in artificial woodland are characterized by deeper roots than those in Greenland, resulting in considerable differences in soil salinization between these landscapes. Currently, only a few researchers have studied the spatial and temporal variability of soil salinity in artificial greenland in the northwest arid desert region (Zhou et al., 2002), the characteristics of soil salinization in different land use types (Wang et al., 2016; Gu et al., 2021), and the water and salt transport pattern of soil under irrigation conditions (Huang et al., 2003; Yang et al., 2010; Liu et al., 2020). Stratified soils are often found in nature, and their stratified characteristics can significantly affect the soil water holding capacity (Ren et al., 2013), soil water infiltration (Li et al., 2012), upward capillary water movement (Wang et al., 2019), groundwater recharge (Xie, 1989), and soil solute migration (Ning et al., 2015), which may, therefore, influencing soil salinization. Currently, there are few studies on the salinization of stratified soils in artificial green areas in China. Therefore, it is important to assess the relationships between soil texture, texture stratification, and soil salinization.
The objective of the present study is to investigate the soil salinization characteristics and the main factors influencing salinization in six typical soil profiles in artificial Greenland in Wuhai City of Inner Mongolia Autonomous Region and Lingwu City of Yinchuan City of Ningxia Autonomous Region in the eastern part of Northwest Arid Desert Region in China. This study provides a theoretical and scientific basis for ensuring effective control of soil salinization in the artificial Greenland of the study areas.

2 Methods

2.1 Overview of the study area

The study area is located in Wuhai City, Inner Mongolia Autonomous Region, and Lingwu City, Ningxia Hui Autonomous Region, both in the eastern part of the northwest arid desert region of China (Fig. 1). The study areas are characterized by a temperate continental arid climate, with many soil types and artificial green areas dependent on irrigation practices. Wuhai City is located at 106°36′25″-107°08′05″E and 39°02′30″-39°54′55″N, with an altitude of 1183-1396 m. Lingwu City is located at 106°16′17″-106°21′53″E and 37°57′11″-38°16′10″N, with an altitude of of 1348-1373 m. The topographic features in Wuhai City consist of three mountains, two valleys, and one river. In addition, the average annual precipitation, annual evaporation, and average annual temperature of <160 mm, 3500 mm, and 9.2 ℃, respectively. The main soil type in the study area is indifferent calcareous soil, with the presence of other soil types, such as gray indifferent soil, brown calcium soil, and others. Plant species are mostly drought-resistant and wind-resistant, with sparse vegetation, mainly in the irrigation-grass structure. Indeed, several plant species are present in Wuhai City, including Tetraena mongolica, Zygophyllum xanthoxylum, and Artemisia ordosica. On the other hand, Lingwu is an arid and wind-eroded landscape, with its topography higher in the southwest and lower in the northeast. In addition, the average annual precipitation, the average annual evaporation, and the average annual temperature in Lingwu are 192.9 mm, 2513 mm, and 10.4 ℃, respectively. Precipitation in Lingwu City increases from the northwestern to the southeast parts. The main soil types in Lingwu City include gray calcium soil and wind-sand soil. In addition, most plant species are drought-resistant, including Platycladus orientalis, Medicago sativa, Melilotus officinalis, and Kali collinum.
Fig. 1 Geographic location of the study areas and sampling sites

2.2 Sample site setup and survey

In this study, field surveys were conducted during the July-August 2021. Based on the soil particle classification system of the U.S. Department of Agriculture system (Guo et al., 2013; Wu and Zhao, 2019), powder loam and sandy loam were classified in the present study as loamy, while loamy sandy soils and sandy soils as sandy soils. Afterward, homogeneous sandy soils (A) and homogeneous loamy soils (B), upper sand and lower loam (C), upper loam and lower sand (D), sandwich type (E), and upper loam and lower stone (F), were selected in this study. Two and three soil profiles were selected for the profile type F and each of the remaining soil profiles. The basic conditions of each sample plot are shown in Table 1, and the texture of each soil profile is shown in Fig. 2. In addition, irrigation data, namely, irrigation quota (IQ), irrigation frequencies (IF), annual irrigation volume (AI), and irrigation water sources, were obtained through data inquiries and field investigations.
Table 1 Basic information of sample sites
Soil profile type Sample number Profile depth (cm) Main plant species
A A1 100 Pinus sylvestris var. mongolica
A2 100 Pinus sylvestris var. mongolica, Sophora japonica
A3 100 Pinus sylvestris var. mongolica
B B1 100 Malus spectabilis
B2 100 Pinus sylvestris var. mongolica, Robinia pseudoacacia
B3 100 Amygdalus davidiana, Elaeagnus angustifolia
C C1 100 Pinus sylvestris var. mongolica
C2 100 Robinia pseudoacacia, Platycladus orientalis
C3 100 Pinus tabuliformis, Elaeagnus angustifolia
D D1 100 Armeniaca vulgaris
D2 100 Ulmus pumila, Elaeagnus angustifolia
D3 100 Ulmus pumila
E E1 100 Populus alba var. pyramidalis
E2 100 Salix matsudana
E3 100 Robinia pseudoacacia
F F1 40 Tamarix hohenackeri
F2 60 Elaeagnus angustifolia
Fig. 2 Particle size distribution of soil profiles

Note: Si, L, Sa and St represent silt, loam, sand and stony soil, respectively.

2.3 Soil sample collection and index determination methods

In this study, one soil profile of 100 cm depth was first dug between two irrigation periods in each sample plot, then classified into five soil layers, namely 0-20, 20-40, 40-60, 60-80, and 80-100 cm. Three replicate soil samples of the original shape were taken for each soil layer with cutting rings, and additional mixed soil samples were taken in plastic bags for each soil layer and brought back to the laboratory for air-drying to determine the physical and chemical properties of the soil index. The original soil samples collected by cutting rings were dried to determine soil water contents and soil bulk densities, while the composite soil samples were used to determine the soil mechanical composition using a Malvern 3000 laser particle size analyzer, as well as soil salinity indexes and pH at the distilled water: soil ratio of 5:1. On the other hand, pH was determined using a suspension that had been left for more than 2 h by Remag MP522 instrument), while soil conductivity was determined by centrifuging soil-water suspension for 4 min at 3500 r min-1 followed by filtration and measurement using Sansin MP521 instrument. In addition, a total of 20 leachates with different conductivity gradients were used to determine the total salt (TS) using the gravimetric method. The linear relationship between conductivity and total salt showed a determination coefficient (R2) of 0.98, according to the following regression equation, which was used to calculate the total salt of all soil samples:
y=4.1411x-71.4399
where y denotes the total salt, mg kg‒1, and x denotes and conductivity, uS cm‒1.
In addition, Na+, Ca2+ and Mg2+ were determined using an atomic absorption spectrometer SpectrAA-220.
Sodium adsorption ratio (SAR) is the relative amount of Na+ to Ca2+ and Mg2+ in irrigation water or soil solutions and is calculated as follows:
$SAR=\frac{{{C}_{\text{N}{{\text{a}}^{\text{+}}}}}}{\sqrt{{1}/{2\left( {{C}_{\text{C}{{\text{a}}^{\text{2+}}}}}+{{C}_{\text{M}{{\text{g}}^{\text{2+}}}}} \right)}\;}}$
where CNa+, CCa2+ and CMg2+ are the concentrations of Na+, Ca2+ and Mg2+ in the soil leachate, respectively, mmol L-1.

2.4 Water sample collection and index determination method

Besides soil samples, irrigation water samples were collected before beginning irrigation at the soil sampling sites. Irrigation water samples were collected from each sampling site in duplicate, according to “Water quality: Technical regulation of the preservation and handling of samples” (HJ493-2009), using 500 mL bottles and stored in thermal boxes, then sent to the laboratory in time. A total of 18 irrigation water samples were collected from the sampling sites, of which the sampling site D1 was irrigated by Yellow River water and groundwater, with proportions of 20.0 and 80.0% of the total water irrigation supply, respectively. C2 was irrigated from mine domestic sewage treatment water, while the remaining sampling sites were irrigated from the Yellow River. The pH was determined using pH meter YQE-014, the total salt amount was determined by weight method, and Na+, Ca2+ and Mg2+ were determined by atomic absorption spectrophotometer YQA-035. In addition, the sodium adsorption ratio of water was calculated using Eq.2.

2.5 Data processing

In this study, cluster analysis of soil salinity profiles was performed using SPSS 26.0, while soil profile particle size and soil salinity index profile distribution maps were obtained using Origin 2021. In addition, redundancy analysis (RDA) was performed to assess the effects of irrigation water, soil physical properties, and soil depths on soil salinity using Canoco software v.5.0.

3 Results and analysis

3.1 Analysis of irrigation system and water quality characteristics

The irrigation quotas in the study area were mainly 10 mm and 23 mm, with 11.67 mm, 90 mm and 150 mm in some sample plots. The irrigation frequency was 2-24 times yr-1, and the irrigation quotas could be mainly classified as 92-240 mm, 600 mm and 1050 mm, as shown in Table 2.
Table 2 Irrigation system and water quality
Water sample number Water total salt
(mg L-1)
Water pH Water SAR Irrigation quota (mm) Irrigation frequency Annual irrigation volume (mm) Source of irrigation water
A1 1277.5±7.8 8.69±0.12 0.41±0.0 10 17 170 Yellow River water
A2 1133.5±7.8 8.43±0.11 1.37±0.01 10 11 110 Yellow River water
A3 984.5±9.2 8.27±0.15 0.59±0.00 10 11 110 Yellow River water
B1 979.0±10.2 8.24±0.13 0.31±0.01 150 4 600 Yellow River water
B2 1212.0±6.2 8.53±0.14 1.60±0.02 23 5 115 Yellow River water
B3 2000.0±18.3 8.03±0.13 1.68±0.01 23 5 115 Yellow River water
C1 894.0±3.2 8.10±0.15 0.39±0.00 150 7 1050 Yellow River water
C2 5040.0±45.1 8.31±0.15 10.11±0.35 23 5 115 Domestic sewage treatment water
C3 8050.0±33.0 8.32±0.12 11.89±0.02 23 4 92 Yellow River water
D1a 993.0±4.2 8.89±0.13 0.78±0.00 11.67 18 210 Yellow River water
D1b 1128.0±15.6 8.64±0.15 2.00±0.04 Groundwater
D2 2550.0±13.2 8.27±0.13 3.07±0.03 23 7 161 Yellow River water
D3 948.0±6.5 8.12±0.19 0.51±0.03 23 5 115 Yellow River water
E1 1309.0±5.5 8.47±0.16 1.34±0.07 23 7 161 Yellow River water
E2 985.0±4.9 8.19±0.13 0.43±0.01 90 2 180 Yellow River water
E3 1354.0±3.1 8.33±0.21 1.65±0.01 23 4 92 Yellow River water
F1 7906.5±128.0 9.42±0.13 14.23±0.05 10 24 240 Yellow River water
F2 556.0±1.4 7.62±0.16 0.84±0.00 10 13 130 Yellow River water
The TS of irrigation water ranged from 556.0 to 8050.0 mg L-1, as shown in Table 2. The TS results suggested that 38.9%, 44.4%, and 16.7% of the collected irrigation water samples were freshwater, brackish water, and saline water, respectively, the classification criteria in Table 3. On the other hand, the water irrigation pH ranged from 7.6 to 9.4, of which 72.2% and 27.8% of the collected samples were alkaline and strongly alkaline, respectively. The results showed a considerable relationship between the SAR values of irrigation water and the degree of sodium sorption by the soil. Indeed, low Ca2+ and high Na+ contents in irrigation water may result in saturated cation exchange with sodium (Ghazaryan and Chen, 2016). The SAR values of water in the study area ranged from 0.31 to 14.23. Indeed, Yellow River water is affected by soil, precipitation and evaporation before it enters the sampling site. In some areas, Yellow River water is piped into reservoirs or lakes for storage and then regularly irrigated as needed. Therefore, it results in the same Yellow River water, but different water quality at the time of entering the sample sites.
Table 3 Irrigation water quality and soil salinization grade classification criteria
Water total salt (mg L-1) Type Soil total salt (mg kg-1) Type
<1000 Fresh water <1000 Non-saline soil
1000-3000 Brackish water 1000-2000 Mildly saline soil
3000-10000 Salt water 2000-4000 Moderately saline soil
10000-50000 Saline 4000-6000 Strength saline soil
>50000 Brine >6000 Salt soil

3.2 Characterization of soil bulk density (BD) and water content (WC)

As shown in Table 4, soil bulk density and soil water content ranged from 1.30 to 1.68 g cm-3 and 1.4% to 10.0%, respectively. In addition, the BD and WC of the loamy soil were generally lower and significantly higher, respectively, than those of the sandy soil. The results revealed increases in the WC of profile types A, C, and E with increasing soil depth, while profile type D revealed the highest WC in the upper soil layers. However, no obvious differences in WC values were observed in profile type B has no obvious pattern in the profile, which was more affected by irrigation, precipitation, and groundwater levels.
Table 4 Soil capacity and water content of different profile types
Index Depth (cm) A B C D E F
BD
(g cm-3)
0-20 1.56±0.06 1.39±0.06 1.53±0.04 1.57±0.06 1.30±0.10 1.56±0.04
20-40 1.64±0.10 1.55±0.10 1.59±0.05 1.61±0.07 1.46±0.04 1.63±0.06
40-60 1.60±0.09 1.53±0.13 1.61±0.06 1.60±0.08 1.57±0.04 1.61
60-80 1.63±0.05 1.56±0.09 1.50±0.20 1.54±0.04 1.55±0.09 -
80-100 1.68±0.10 1.55±0.09 1.45±0.15 1.56±0.07 1.58±0.11 -
WC
(%)
0-20 2.39±2.29 6.61±4.24 1.68±1.40 4.06±1.68 5.32±5.50 10.01±2.90
20-40 2.47±0.90 6.54±3.88 1.67±1.35 2.75±3.16 6.35±7.57 8.07±4.31
40-60 3.13±1.66 4.21±1.18 1.36±0.92 2.49±2.50 8.22±7.40 5.86
60-80 4.79±2.59 8.19±5.85 3.06±0.65 2.76±1.48 9.70±11.52 -
80-100 4.94±1.78 4.47±0.77 6.27±2.12 2.88±1.27 7.92±10.14 -

3.3 Characteristics of soil salinization in different soil profile types

The distribution of soil salinity in the soil profile is reflected by the combined effect of climate, topography, soil types, and anthropogenic factors on water salinity transport (Zhou et al., 2017), showing temporal dynamic characteristics. The 0-100 cm soil profile was divided into the surface, middle, and bottom soil layers, namely 0-20, 20-60, and 60-100 cm. For the TS of the three soil profiles, systematic cluster analysis of Q-type was performed with Pearson correlation as the discriminant, and the results were classified as surface accumulation type, middle accumulation type and bottom accumulation type. Profiles F1 and F2 were not used in the clustering analysis since soil samples in these sampling sites were not collected from the deeper soil layer (60-100 cm). However, as can be seen in Fig. 3, they are also characterized by surface aggregation.
The profile types A and B belonged to surface accumulation type, with TS values of soil layers ranging from 115.5 to 1781.6 mg kg-1 and from 251.5 to 1854.1 mg kg-1, referring to the classification criteria of Wang et al. (1993) (Fig. 3), of which 6.7% and 26.7% of soil layers exhibited slight salinization, respectively. The profile type C belonged to bottom accumulation type, with TS values of soil layers ranging from 135.9 to 1009.3 mg kg-1, of which 6.7% exhibited slight salinization. Profiles D1 and D2 in profile type D belonged to surface accumulation type, while profile D3 belonged to middle accumulation type, with TS values of soil layers ranging from 278.8 to 2388.3 mg kg-1, of which 20.0% and 13.3% of sampling sites revealed slight and moderate salinization, respectively. Profile D3 is an artificially modified park with fragmented concrete slabs present at approximately 40 cm, which may have led to temporary accumulation of water-salt transport being blocked here. Profiles E1 and E2 in profile type E belonged to bottom accumulation type, while profile E3 belonged to surface accumulation type. The TS in the soil layer ranged from 382.3 to 2827.3 mg kg-1, of which 33.3% and 20.0% of sampling sites revealed slight and moderate salinization. Profile type F had surface accumulation, with TS values ranging from 1079.7 to 4945.5 mg kg-1 in the soil layer, of 40.0%, 20.0% and 40.0% of the sampling sites exhibited slight, moderate, and severe salinization, respectively. Profile F1 is located in an artificial wetland, near the Yellow River and surrounded by natural wetlands. However, the results revealed severe soil salinization at F1. Profile F2 is located at a mine ecological restoration site, which is artificially greened after being covered (about 60 cm) at the original coking plant. Therefore, the salinity of the guest soil may lead to salinization of the local soil. In addition, the sampling site is located mainly at the lower part of the hill, resulting in an accumulation of salt of soil mine following the migration of irrigation water from the upper to the lower parts of the hill and, consequently, leading to a high salinity level at the sample site.
Fig. 3 Characteristics of the vertical distribution of soil TS in different profile types
According to the obtained results, the soil pH ranged from 7.49 to 9.31 (Fig. 4). In addition, 3.8%, 43.8%, and 52.5% of the collected samples were neutral, alkaline, and strongly alkaline, respectively. The SAR values of soil layers in this study ranged from 0.67 to 15.28 (Fig. 5). Indeed, soil sodicity leads to dispersion of agglomerates and sticky particles, destruction of large and small pores, poor permeability and poor structure. Finally, it shows shrinkage hard slab when dry and swollen mud when wet, which seriously hampers the normal growth of plants (Li et al., 2004).
Fig. 4 Characteristics of the vertical distribution of soil pH in different profile types
Fig. 5 Characteristics of the vertical distribution of soil SAR in different profile types

3.4 Analysis factors influencing soil salinization

To assess the effects of irrigation, soil physical, and soil depth on soil salinity, soil salinity indexes, namely soil TS, soil pH, and soil SAR of each layer, were used as explanatory variables, while irrigation factors, namely IQ, water pH, water TS, water SAR, and soil physical factors (WC, BD, sand contents, silt contents, and clay contents) as response variables. The evaluation was performed separately and redundantly for different soil profile types. In addition, the mean values of soil salinity indicators for the entire profiles were used as explanatory variables, and the mean values of irrigation factors and soil physical factors were used as response variables to perform redundancy analysis for soil profile salinity. The results showed that the correlation coefficients between soil salinity and each factor on both axis 1 and axis 2 were ≥0.75. In addition, these two ranking axes cumulatively explained more than 74.0% of the soil salinity characteristics and more than 99.8% of the soil salinity in relation to the influencing factors, demonstrating that both axes can well explain the relationships between soil salinity, irrigation factors, soil physical factors, and soil depth, more particularly by axis 1.
In soil profile types A, B, C, D and E, clay content and were all positively correlated with soil TS, and a similar pattern was found for silt content, while the opposite was true for sand content. The higher the clay and silt contents, the greater the soil capillary porosity. Indeed, capillary porosity is a channel for the upward transport of salts in the subsoil under the effect of evaporation, thereby suggesting that the greater the capillary porosity, the more significant the surface aggregation of salts and the higher the salinity of the upper soil. Except for soil profile type B, WC was positively correlated with soil TS and soil SAR. The relationship between BD and the three salinity indicators varies among the profile types and there is no clear pattern. Indeed, the reduction of soil capacitance can result in an increase in soil porosity, thereby improving the homogeneity and connectivity of soil pore space and, consequently (Yang et al., 2019).
On the other hand, according to the results of the analysis of irrigation water, the water quality of irrigation water only affects the A and D soil profiles to a certain extent, and has less influence on other soil profiles. In soil profile A, the arrows of both water SAR and water pH were longer, indicating that they had a greater effect on soil salinization. Among them, water SAR has a good positive correlation with soil SAR, and water pH has a good negative and positive correlation with soil TS and soil pH, respectively. In soil profile type D, water pH was the only irrigation water quality factor shown, with strong negative and positive correlations with soil TS and soil pH, respectively. As for the irrigation regime, it only affected soil profile types B, C, D and E to some extent, and had less effect on soil profile types A and F. AI only appeared in soil profile types B and D, and both were negatively correlated with soil TS and soil SAR, and positively correlated with soil pH, indicating that increasing annual irrigation had a leaching effect on salinity in these two types of profiles.
The mean values of soil salinity indicators for the whole soil profile were used as explanatory variables and irrigation factors and soil physical factors for the whole soil profile were used as response variables for redundancy analysis, and the results were consistent with the synthesis of the main factors of soil salinization in the study area. Soil TS and soil SAR were positively correlated with WC, silt content, and BD and negatively correlated with sand contents. In addition, soil TS and soil SAR were positively correlated with water TS, water SAR and IF, and negatively correlated with water pH, IQ and AI. The results obtained showed that silt content, bulk density, salinity and SAR of irrigation water have positive effects on increasing soil salinity and sodicity, and that increasing sand content, irrigation quota and irrigation quota can alleviate soil salinity problems.
Monte Carlo tests of the nine influencing factors showed that silt content, irrigation frequency, clay content, annual irrigation volume, irrigation frequency, and soil depth were the highest explanatory factors for soil profile types A, B, C, D, E, and F, respectively, and reached highly significant levels (P < 0.01) for all but soil profile type F. This indicates that these factors are the main drivers of soil salinity in all types of profiles. Overall, irrigation water quality had a small effect on soil salinization. Soil water content was the highest explanatory factor for the profile means, indicating that soil water content and soil salinity had highly significant co-temporal characteristics (P < 0.01).
Fig. 6 RDA analysis results

4 Discussion

The water and salt transport processes in the soil profile during the irrigation events are complex. Indeed, the soil salt distribution has obvious temporal dynamic characteristics, which are strongly influenced by natural and anthropogenic factors, including rainfall, drought, and irrigation. When Shi et al. (2007) studied soil salinization in the northern part of Yinchuan City, they showed that there were two to four evaporation concentration overlapping generations during irrigation drenching. In this study, the soil and water irrigation samples were collected in the July-August 2021 period, during which several precipitation events occurred, thereby resulting in a leaching effect of soil salt from the soil surface to deeper soil layers. In addition, the soil leaching process might result in insignificant surface aggregation of soil salinity or temporarily exhibiting other types of soil salinity profiles in some sampling sites.
Saline soils are mostly distributed in arid or semi-arid areas, and these areas usually have low topography, poor drainage, and high groundwater table. As the main carrier of salt transport, accumulation and excretion, soil salinity is significantly influenced by the water table, and when the burial depth of the water table is less than the critical depth, the salts in the groundwater will continuously migrate to the plant rhizosphere and the ground surface with capillary water, when the shallower the burial depth of the water table is, the higher the risk of soil salinization occurs (Xu et al., 2019b). In this paper, the groundwater level in the study area was not measured because the groundwater level in each site was uneven, and the groundwater level in some sample sites was very deep, which made it difficult to measure, and the relatively abundant precipitation during the sampling period and the large amount and frequency of irrigation easily affected the groundwater level. Therefore, this paper adopts the method of data inquiry and visit survey to get a rough understanding of the groundwater level in the study area. Both Wuhai and Lingwu are characterized by shallow groundwater levels near the Yellow River area, where the shallowest groundwater level sampling site in Lingwu is located in the plain area near the Yellow River with a groundwater level of about 15 m, and the shallowest groundwater level sampling site in Wuhai is also near the Yellow River with a shallow groundwater level of about 3m. The sampling sites in the plain area of Lingwu are mostly loamy sandy soils and sandy loamy soils with more capillary pores, while Wuhai is mostly sandy soils with stones or bricks at the bottom and less capillary pores, so the effect of groundwater level on soil salinization in Wuhai is relatively small compared to Lingwu.
The relationship between each influencing factor and soil salinity index was assessed in the present study using the RDA two-dimensional ranking diagram. The main factors affecting soil salinity in the study areas were determined using the correlation coefficients between each environmental factor and the study object on the first two ranking axes. Indeed, the RDA could reveal more clearly the main factors affecting soil salinity compared with traditional statistical methods (Dou et al., 2022). The soil profile types of the artificial green areas in the study area were fertile. The six soil profile types were classified based on the soil texture, namely homogeneous sandy soils and homogeneous loamy soils, upper sand and lower loam, upper loam and lower sand, sandwich type, and upper loam and lower stone. Soil texture can reflect the hydraulic properties of the soil, including water holding capacity, water permeability, and wetting front advancement distance (Li et al., 2012; Ren et al., 2013). The finer the soil texture, the greater the total porosity and capillary porosity, the greater the water holding capacity, and the poorer the soil permeability. Previous related studies have shown that clay and sand contents are the main soil texture components influencing soil salinity. Indeed, the clay layer can inhibit the transport of water and salt to deeper soil layers, thereby resulting in an accumulation of soil salt (Yu et al., 2011; Chen et al., 2012), while the sand layer can inhibit the rise of capillary water, which is beneficial to inhibit the upward migration of soil salt to the soil surface (Zhai et al., 2014; Salvati and Ferrara, 2015). Ren et al. (2013) revealed increases in the water-holding capacity of the laminated soil column with decreasing stratification layer thickness until reaching a certain level of the water-holding capacity of the soil column. This critical stratification thickness depends on the relative magnitude between the suction of the lower coarse-textured soil layer and the upper fine-textured soil layer. For sandy soils, the increase in the clay contents and powder particles and the decrease in the soil capacity can result in an increase in the soil capillary porosity and water retention capacity and, consequently, increase soil salinization in the upper soil layer. Thus, in the homogeneous sandy soil type, profile A3, which has a higher content of powder particles, has a higher and significantly surface aggregated soil salt content, and the salts from the upper sand and lower loam also accumulate in the loamy part of the bottom layer.
In the case where the irrigation water salinity is lower than that of the soil, the salts in the upper soil layer can be dissolved in irrigation water and transported downward through the leaching process. However, the salt transport distance and time can vary depending on soil texture. The type and content of solutes in water affect the density, surface tension, and viscosity coefficient of water and, consequently, affect the transport of soil water (Xu et al., 2022). Guo et al. (2017) showed significant effects of irrigation water with different salt compositions on soil water diffusion rate, horizontal migration of soil HCO3- and SO42-, and soil sodium adsorption ratios. During the inter-irrigation period, water irrigation salts can be leached from the upper to lower soil layers. However, under strong evaporation, water salts can be transported upward through capillary pores, leading to a salt accumulation in the soil surface layer and, consequently, resulting in a secondary salinization. This salinization process can occur more particularly in the northwest arid desert area during the early spring irrigation period.

5 Conclusions

The TS ranged from 115.5 to 4945.5 mg kg-1 for each soil profile type. 6.7%, 26.7%, 6.7%, 20.0%, 33.3%, and 40.0% of the soils in profile types A, B, C, D, E, and F, respectively, reached light salinization; 13.3%, 20.0%, and 20.0% of the soils in profile types D, E, and F, respectively, reached moderate salinization; in addition, only profile type F showed heavy salinization with a high percentage of 40.0%. On the other hand, soil profile types A, B, D, and F were predominantly surface accumulation type, while soil profile type C was bottom accumulation type. In addition, profiles E1 and E2 in the E-type soil profile were bottom accumulation type, while profile E3 was surface accumulation type. Soil pH and soil SAR ranged from 7.49 to 9.31 and 0.67 to 15.28, respectively.
The results of RDA analysis showed that the first two ranking axes cumulatively explained more than 74.0% of the soil salinity characteristics and more than 99.8% of the soil salinity influencing factors, indicating a clear relationship between soil salinity and the three types of influencing factors. In addition, silt content, irrigation frequency, clay content, annual irrigation volume, irrigation frequency, and soil depth were the major factors influencing soil salinity in soil profiles A, B, C, D, E, and F, respectively, while soil water content and soil salinity had highly significant co-spatial characteristics (P<0.01).
[1]
Chen L J, Feng Q, Wang Y, et al. 2012. Water and salt movement under saline water irrigation in soil with clay interlayer. Transactions of the Chinese Society of Agricultural Engineering, 28(8): 44-51. (in Chinese)

[2]
Cui Y S, Wang F, Sun J S, et al. 2018. Effects of irrigation regimes on the variation of soil water and salt and yield of mechanically harvested cotton in Southern Xinjiang, China. Chinese Journal of Applied Ecology, 29(11): 3634-3642. (in Chinese)

DOI

[3]
Dou X, Shi H B, Li R P, et al. 2022. Distribution characteristics of salinity and nutrients in salinized soil profile and estimation of salt migration. Transactions of the Chinese Society for Agricultural Machinery, 53(1): 279-290, 330. (in Chinese)

[4]
Fan G Q, Zhang D Z, Zhang J M, et al. 2022. Ecological environmental effects of Yellow River irrigation revealed by isotope and ion hydrochemistry in the Yinchuan Plain, Northwest China. Ecological Indicators, 135: 108574. DOI: 10.1016/j.ecolind.2022.108574.

DOI

[5]
Ghazaryan K, Chen Y. 2016. Hydrochemical assessment of surface water for irrigation purposes and its influence on soil salinity in Tikanlik oasis, China. Environmental Earth Sciences, 75(5): 383. DOI: 10.1007/s12665-016-5287-0.

DOI

[6]
Gu M H, Li M H, Liu D P, et al. 2021. Soil salinization characteristics of different land-use types in the Qingtu Lake area of Minqin County. Journal of Lanzhou University (Natural Sciences), 57(1): 117-121, 128. (in Chinese)

[7]
Guo Q E, Nan L L, Li B G, et al. 2017. Effect of salt ion composition of irrigation water on parameters of soil water and salt movement. Transactions of the Chinese Society of Agricultural Engineering, 33(23): 123-128. (in Chinese)

[8]
Guo Y B, Dai J, Feng H, et al. 2013. Standard mapping of soil textural triangle and automatic query of soil texture classes. Acta Pedologica Sinica, 50(6): 1221-1225. (in Chinese)

[9]
Huang Q, Li S X, Song Y D. 2003. The movement of water and salt in sandy land after irrigated with saline water. Acta Pedologica Sinica, 40(4): 547-553. (in Chinese)

[10]
Lekakis E H, Antonopoulos V Z. 2015. Modeling the effects of different irrigation water salinity on soil water movement, uptake and multicomponent solute transport. Journal of Hydrology, 530: 431-446.

DOI

[11]
Li M, Bi J T, Wang J. 2020. Bacterial community structure and key influence factors in saline soil of different sites in Ningxia. Acta Ecologica Sinica, 40(4): 1316-1330. (in Chinese)

[12]
Li X, Jiao Y, Dai G, et al. 2016. Soil bacterial community diversity under different degrees of saline-alkaline in the Hetao Area of Inner Mongolia. China Environmental Science, 36(1): 249-260. (in Chinese)

[13]
Li X G, Cao J, Li F M. 2004. Influence of salinity, sodicity and organic matter on some physical properties of salt-affected soils. Chinese Journal of Soil Science, 35(1): 64-72. (in Chinese)

[14]
Li Y, Ren X, Horton R. 2012. Influence of various soil textures and layer positions on infiltration characteristics of layered soils. Journal of Drainage and Irrigation Machinery Engineering, 30(4): 485-490. (in Chinese)

[15]
Liu G M, Wu Y K, Yang J S, et al. 2013. Regional 3-D soil salt spatial variability based on electromagnetic induction technology. Transactions of the Chinese Society for Agricultural Machinery, 44(7): 78-82, 66. (in Chinese)

[16]
Liu S H, Yang G, Zhang Q Y, et al. 2020. Experimental study on water and solute movement in soil grown with desert plant Haloxylon ammodendron under drip irrigation using saline water. Journal of Irrigation and Drainage, 39(1): 52-60. (in Chinese)

[17]
Ning N, Xu M, Duan Y X, et al. 2015. Research on the migration law of conservative ion in layered soil under unsaturated zone. Environmental Engineering, 33(5): 70-74. (in Chinese)

[18]
Ren L D, Hang M B, Fan J. 2013. Study on water retention capacity for drained soils with different textural layering. Transactions of the Chinese Society of Agricultural Engineering, 29(19): 105-111. (in Chinese)

[19]
Salvati L, Ferrara C. 2015. The local-scale impact of soil salinization on the socioeconomic context: An exploratory analysis in Italy. CATENA, 127(3): 312-322.

DOI

[20]
Shi X J, Wan L, Zhang Y T, et al. 2007. Simulation model for soil salinization in the northern region of the Yinchuan Plain. Hydrogeology & Engineering Geology, (6): 116-120. (in Chinese)

[21]
Wang S S, Zhai S X, Fu Y L, et al. 2019. Study on the variation characteristics of rising capillary water of layered soil under variation of sand layer and thickness. Journal of Irrigation and Drainage, 38(11): 49-57. (in Chinese)

[22]
Wang X M, Kang X, Zhao F. 2016. Analysis on characteristics of soil salinization in the Weigan-Kuqa River Delta oasis under different land use patterns. Research of Soil and Water Conservation, 23(1): 160-164. (in Chinese)

[23]
Wang Z Q, Zhu S Q, Yu R P, et al. 1993. Saline soil in China. Beijing, China: Science Press. (in Chinese)

[24]
Wu K N, Zhao R. 2019. Soil texture classification and its application in China. Acta Pedologica Sinica, 56(1): 227-241. (in Chinese)

[25]
Xie G C. 1989. Infiltration into layered soil and its relation to groundwater recharge. Engineering Journal of Wuhan University, 22(4): 62-68. (in Chinese)

[26]
Xu C D, Wang R R, Chen H, et al. 2019a. Spatial-temporal distribution of water and salt in artificial oasis irrigation area in arid area based on remote sensing analysis. Transactions of the Chinese Society of Agricultural Engineering, 35(2): 80-89. (in Chinese)

[27]
Xu Y, Ge Z, Wang J, et al. 2019b. Study on relationship between soil salinization and groundwater table depth based on indicator Kriging. Transactions of the Chinese Society of Agricultural Engineering, 35(1): 123-130. (in Chinese)

[28]
Xu Z Q, Chen Y, Mao X M. 2022. Influences of salt adsorption ratio and salt concentration on the physical properties of typical sandy loam in Xinjiang. Transactions of the Chinese Society of Agricultural Engineering, 38(20): 86-95. (in Chinese)

[29]
Yang C, Chen H Y, Li J S, et al. 2019. Soil improving effect of Suaeda salsa on heavy coastal saline-alkaline land. Chinese Journal of Eco-Agriculture, 27(10): 1578-1586. (in Chinese)

[30]
Yang H M, Xu H L, Niu J Y. 2010. Soil water and salt transport in secondary salinized soil ender shelterbelt using drip irrigation in arid zone. Acta Pedologica Sinica, 47(5): 1023-1027. (in Chinese)

[31]
Yu S P, Yang J S, Liu G M, et al. 2011. Effect of clay interlayers on soil water-salt movement in easily-salinized regions. Advances in Water Science, 22(4): 495-501. (in Chinese)

[32]
Yu W J, Sun D F, Qu W. 2015. Study of the characteristics of soil salinization based on redundancy analysis in Pingluo, Ningxia. Journal of China Agricultural University, 20(5): 103-110. (in Chinese)

[33]
Zhai P H, Yang L J, Li S Y, et al. 2014. Study on dynamic characteristics of soil water-saline of different interlavers under evaporation. Journal of Soil and Water Conservation, 28(4): 273-277. (in Chinese)

[34]
Zheng H X, Cao X S, Chang L M, et al. 2020. Research on optimized irrigation schedule of winter wheat in different saline soils in Hetao Irrigation Area. Journal of Water Resources and Water Engineering, 31(4): 152-156. (in Chinese)

[35]
Zhou X X, Wang W H, Wang J L, et al. 2017. Time-spatial revolution characteristics of soil salinity in the Yellow River Delta under different land cultivation and natural conditions. Journal of Soil and Water Conservation, 31(2): 309-316. (in Chinese)

[36]
Zhou Z B, Li P J, Xu X W, et al. 2002. Effect of artificial green belt on salt distribution in sand land in hinterland of Taklimakan desert. Journal of Soil and Water Conservation, 16(2): 16-19. (in Chinese)

Outlines

/