
Journal of Resources and Ecology >
Study on the Effect of Topsoil Storage Mode on Topsoil Availability
|
LIN Yachao, E-mail: 939563498@qq.com |
Received date: 2022-10-20
Accepted date: 2023-02-20
Online published: 2023-07-14
Supported by
Key Research and Development Program of China(2017YFC0504406)
The Inner Mongolia Autonomous Region Science and Technology Major Projects(2020ZD0021-03)
Topsoil resources are important resources for ecological restoration in mining areas, although the topsoil stripped in practical projects can not be used for ecological restoration immediately. The changes that occur in topsoil after a certain period of storage in arid areas are not clear, so we have no insight on how to make the best use topsoil for ecological restoration after storage in the mining areas. Therefore, this study investigated the effects of topsoil accumulation on seed density and topsoil nutrient content in seed banks, which could provide a technical basis for vegetation reconstruction of coal mine damaged land in desert areas and theoretical support for ecological restoration practices. In this study, two storage methods of round table piles (hereafter referred to as YT) and cube ton bags (hereafter referred to as DD) were used to preserve uniformly mixed topsoil samples, and the loss of the soil seed bank and nutrient depletion under different topsoil storage methods were analyzed. In the two storage modes, the soil seed density loss on the surface of the pile was the largest, and the loss rate was 79.30%-83.65%. At a given sampling location, soil seed density increased significantly with soil depth (P<0.05). Compared with the change in seed density, soil nutrient loss was less pronounced, and the loss rate was between 8.92% and 16.62%. The seed density loss of the topsoil was the highest in both stacking modes. With the increase in the soil layer, soil seed density was significantly increased (P<0.05). At the same time, there was no significant difference in seed loss between the two storage modes. In the process of preservation, shrub seeds were the most seriously lost in the pile. The nutrient preservation effect of the ton bag storage mode (DD) was better than that of the round table storage mode (YT), and the soil nutrient loss of the top layer of the pile was the greatest, while the soil nutrient losses of other soil layers were lower.
Key words: soil seed bank; opencast coal mine; topsoil stockpile; seed bank density
LIN Yachao , FENG Changdong , GUO Xiaoping , LUO Chao , LI Wenye , XUE Guolian , ZHANG Wei , YANG Fan . Study on the Effect of Topsoil Storage Mode on Topsoil Availability[J]. Journal of Resources and Ecology, 2023 , 14(4) : 847 -855 . DOI: 10.5814/j.issn.1674-764x.2023.04.017
Table 1 Stacking modes and specifications |
| Item | Round table storage mode (YT) | Big bag storage mode (DD) |
|---|---|---|
| Size | H=1 m R=1.67 m r=0.3 m Slope 35° | The specification is 1 m × 1 m× 1 m |
| Coverage measures | Fiber mesh thatch cover | None |
| Volume | About 3.54 m³ | About 1 m³ |
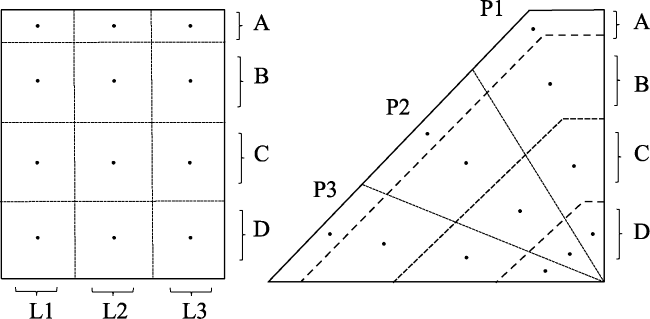
Fig. 1 Locations of sampling points inside the soil pile |
Table 2 Assay methods |
| Index | pH | Organic matter | Total nitrogen | Total phosphorus | Total potassium |
|---|---|---|---|---|---|
| Method | Potentiometric method | Potassium dichromate method | Sulfuric acid-hydrogen peroxide digestion, diffusion absorption method | Sulfuric acid-hydrogen peroxide digestion, vanadium molybdenum yellow colorimetry | Sulfuric acid-hydrogen peroxide digestion, flame photometry |
| Standard | NY/T 1121.2-2006 | NY/T 1121.6-2006 | NY/T 53-1987 | HJ 632-2011 | NY/T 87-1988 |
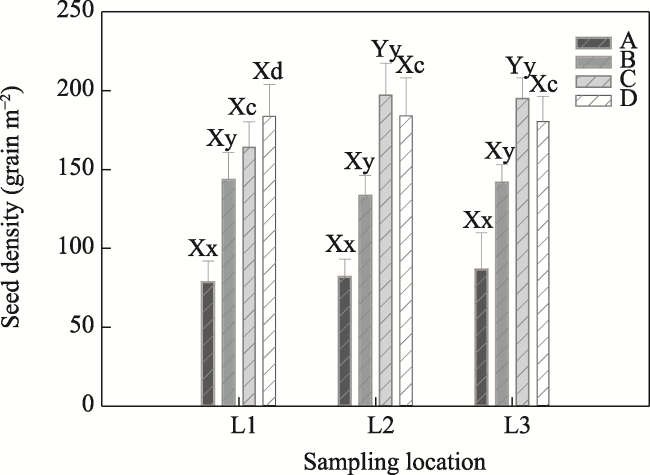
Fig. 2 Seed density inside the DD pileNote: A, B, C and D are the sampling depths of the stacked topsoil, which are 0-10 cm, 10-40 cm, 40-70 cm and 70-100 cm respectively. Different capital letters represent significant differences in seed densities between sampling points in the same soil layer (P<0.05), and different lowercase letters represent significant differences in seed densities between different soil depths in the same sampling point (P<0.05); and L1, L2 and L3 are sampling areas. The same annotations apply to subsequent figures. |
Table 3 Variation characteristics of seed density levels inside the DD pile |
| Soil layer | Volume of each soil layer (m3) | Average seed density before stockpiling (grain m-2) | Average seed density of germination test (grain m-2) | Average loss rate (%) |
|---|---|---|---|---|
| A | 0.1 | 398.33 | 82.45 | 79.30 |
| B | 0.3 | 139.78 | 64.91 | |
| C | 0.3 | 185.44 | 53.44 | |
| D | 0.3 | 182.67 | 54.14 | |
| Total | 62.95 |
Note: A, B, C and D are the sampling depths of the stacked topsoil, which are 0-10 cm, 10-40 cm, 40-70 cm and 70-100 cm respectively, and the same annotations are used in subsequent tables. |
Table 4 Average losses of plant seeds in each soil layer of the DD pile |
| Latin name | Seed loss rate of each soil layer (%) | |||
|---|---|---|---|---|
| A | B | C | D | |
| Eragrostis minor | 65.93 | 29.90 | 11.52 | 16.42 |
| Bassia dasyphylla | 90.48 | 100.00 | 42.86 | 76.19 |
| Tribulus terrestris | 83.87 | 79.57 | 12.90 | 17.74 |
| Halogeton glomeratus | 76.97 | 78.79 | 12.12 | 3.03 |
| Agriophyllum squarrosum | 100.00 | 85.72 | 100.00 | 100.00 |
| Salsola ruthenica | 100.00 | 100.00 | 100.00 | 100.00 |
| Stipa krylovii | 49.01 | 27.44 | 60.78 | 60.78 |
| Achnatherum splendens | 88.76 | 74.91 | 60.67 | 52.81 |
| Stipa glareosa | 74.56 | 53.50 | 39.90 | 40.34 |
| Cleistogenes | 68.83 | 41.99 | 18.61 | 31.17 |
| Allium tenuissimum | 90.24 | 77.23 | 98.37 | 100.00 |
| Artemisia desertorum | 91.61 | 85.17 | 83.83 | 84.03 |
| Artemisia frigida | 41.49 | 19.38 | 12.24 | 19.72 |
| Agropyron cristatum | 67.95 | 46.16 | 62.82 | 21.80 |
| Melilotus officinalis | 76.19 | 59.52 | 88.09 | 85.71 |
| Chenopodium strictum | 100.00 | 97.44 | 100.00 | 100.00 |
| Salsola collina | 100.00 | 100.00 | 100.00 | 100.00 |
| Leymus secalinus | 98.72 | 94.87 | 96.15 | 97.43 |
| Reaumuria songarica | 93.33 | 93.33 | 96.67 | 96.67 |
| Oxytropis aciphylla | 100.00 | 100.00 | 100.00 | 100.00 |
Fig. 3 Seed density inside the YT pile |
Table 5 Changes in the seed characteristics inside the YT pile |
| Soil layer | Volume of each soil layer (m3) | Average seed density before stockpiling (grain m-2) | Average seed density of germination test (grain m-2) | Average loss rate (%) |
|---|---|---|---|---|
| A | 0.35 | 398.33 | 66.22 | 83.65 |
| B | 1.06 | 135.89 | 65.89 | |
| C | 1.06 | 159.33 | 60.00 | |
| D | 1.06 | 199.67 | 49.87 | |
| Total | 61.07 |
Table 6 Average loss rates of plant seeds in each soil layer of the YT pile |
| Latin name | Seed loss rate of each soil layer (%) | |||
|---|---|---|---|---|
| A | B | C | D | |
| Eragrostis minor | 67.40 | 38.48 | 37.99 | 30.64 |
| Bassia dasyphylla | 100.00 | 71.43 | 71.43 | 23.81 |
| Tribulus terrestris | 87.63 | 64.52 | 67.20 | 66.67 |
| Halogeton glomeratus | 89.09 | 78.79 | 70.30 | 62.42 |
| Agriophyllum squarrosum | 71.43 | 71.43 | 28.57 | 23.81 |
| Salsola ruthenica | 100.00 | 20.00 | 13.33 | 40.00 |
| Stipa krylovii | 80.39 | 54.90 | 37.25 | 11.76 |
| Achnatherum splendens | 91.76 | 84.27 | 81.27 | 76.78 |
| Stipa glareosa | 86.84 | 62.72 | 54.82 | 60.53 |
| Cleistogenes | 89.18 | 54.55 | 60.17 | 64.50 |
| Allium tenuissimum | 90.24 | 90.24 | 79.67 | 77.23 |
| Artemisia desertorum | 91.21 | 80.00 | 69.07 | 51.76 |
| Artemisia frigida | 55.10 | 33.67 | 37.41 | 36.39 |
| Agropyron cristatum | 61.54 | 69.23 | 66.67 | 41.03 |
| Melilotus officinalis | 83.33 | 76.19 | 73.80 | 59.52 |
| Chenopodium strictum | 100.00 | 64.10 | 64.10 | 38.46 |
| Salsola collina | 93.75 | 75.00 | 77.08 | 70.83 |
| Leymus secalinus | 96.15 | 73.08 | 73.08 | 61.50 |
| Reaumuria songarica | 100.00 | 93.33 | 90.00 | 73.32 |
| Oxytropis aciphylla | 96.16 | 84.62 | 84.62 | 80.78 |
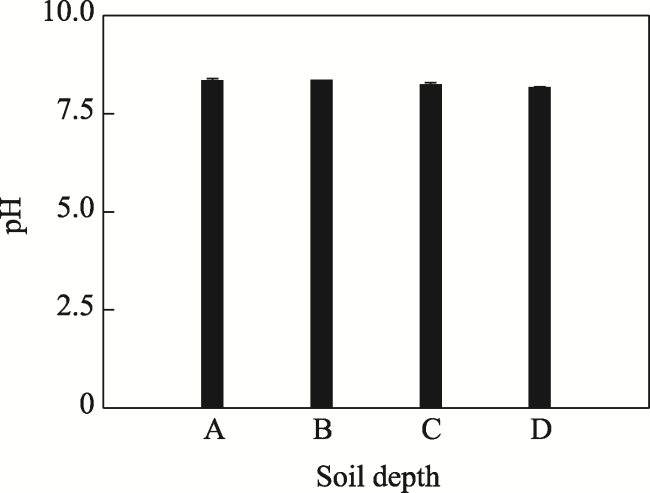
Fig. 4 Soil pH inside the DD pile |
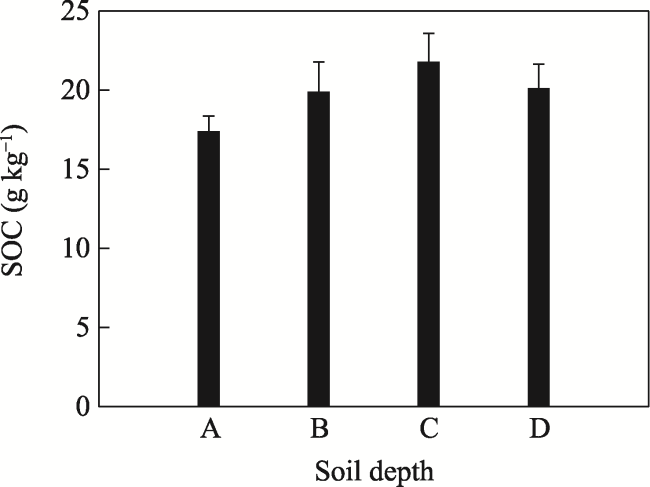
Fig. 5 Soil SOC inside the DD pile |
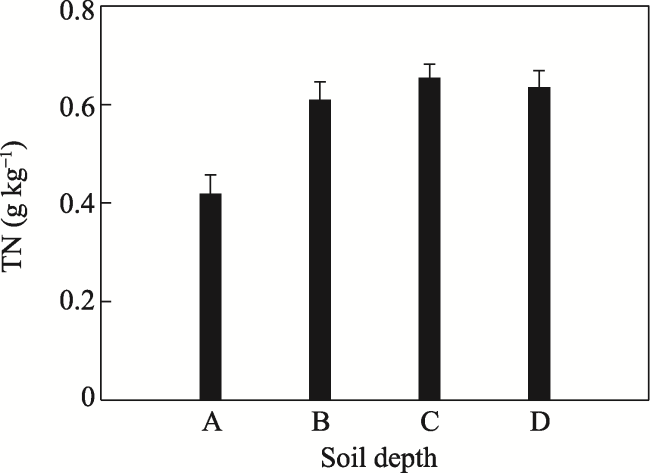
Fig. 6 Soil TN inside the DD pile |
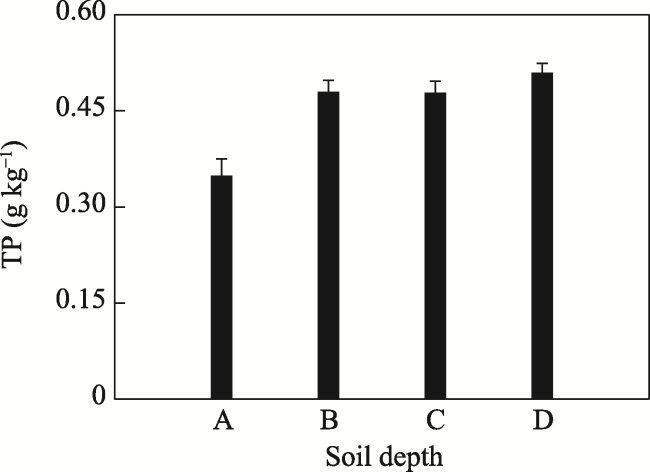
Fig. 7 Soil TP inside the DD pile |
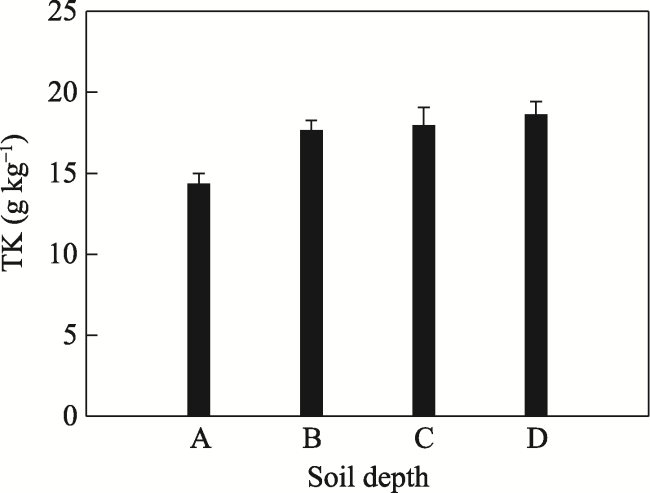
Fig. 8 Soil TK inside the DD pile |
Fig. 9 Soil pH inside the YT pile |
Fig. 10 Soil SOC inside the YT pile |
Fig. 11 Soil TN inside the YT pile |
Fig. 12 Soil TP inside the YT pile |
Fig. 13 Soil TK inside the YT pile |
Table 7 Depletion of soil nutrient structure under the two storage modes |
| Type | Percentage decrease in soil nutrient contents | |||
|---|---|---|---|---|
| SOC | TN | TP | TK | |
| DD | 8.92 | 9.93 | 10.43 | 9.57 |
| YT | 14.50 | 12.58 | 12.63 | 16.62 |
| YT-DD | 5.58 | 2.65 | 2.19 | 7.05 |
| [1] |
|
| [2] |
|
| [3] |
|
| [4] |
|
| [5] |
|
| [6] |
|
| [7] |
|
| [8] |
|
| [9] |
|
| [10] |
|
| [11] |
|
| [12] |
|
| [13] |
|
| [14] |
|
| [15] |
|
| [16] |
|
| [17] |
|
| [18] |
|
| [19] |
|
| [20] |
|
| [21] |
|
| [22] |
|
| [23] |
|
| [24] |
|
| [25] |
|
| [26] |
|
| [27] |
|
| [28] |
|
| [29] |
|
/
| 〈 |
|
〉 |


