Revegetation and Management of Mines

Effects of Ecological Restoration Modes on Runoff and Erosion Reduction and Vegetation Restoration of Waste Dump Slopes in Lingwu

  • LI Wenye , 1, # ,
  • YE Jinpeng , 2, # ,
  • GUO Xiaoping , 1, * ,
  • LIN Yachao 1 ,
  • XUE Dongming 3 ,
  • LI Guoqi 4 ,
  • YANG Fan 1 ,
  • ZHANG Wei 1 ,
  • GU Qingmin 5
Expand
  • 1. School of Soil and Water Conservation, Beijing Forestry University, Beijing 100083, China
  • 2. Survey Engineering Company, China Energy Engineering Group, Yunnan Electric Power Design Institute Co., Ltd, Kunming 650500, China
  • 3. Chongqing Branch, China Three Gorges Construction Engineering Corporation, Chongqing 401320, China
  • 4. School of Ecology and Environment, Ningxia University, Yinchuan 750021, China
  • 5. Yangchangwan Coal Mine of Ningxia Coal Industry Co., Ltd, China Energy Group, Lingwu, Ningxia 751411, China
*GUO Xiaoping, E-mail:

#The authors contribute equally to the article.

LI Wenye, E-mail: ;

YE Jinpeng, E-mail:

Received date: 2022-09-19

  Accepted date: 2023-03-20

  Online published: 2023-07-14

Supported by

Key Research and Development Program of China(2017YFC0504406)

Abstract

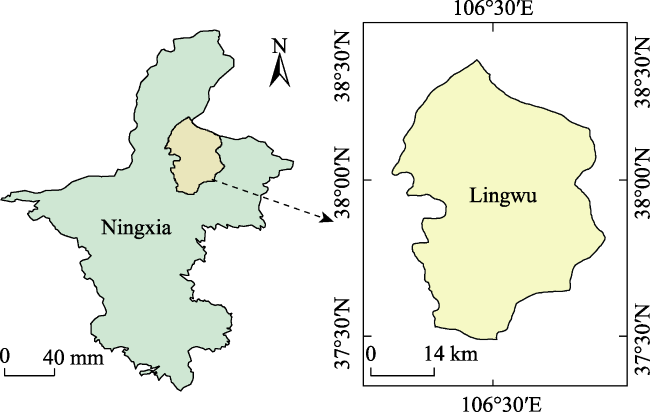
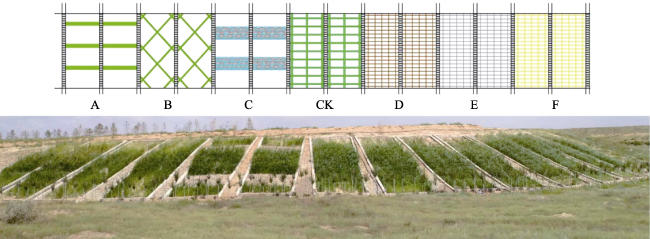
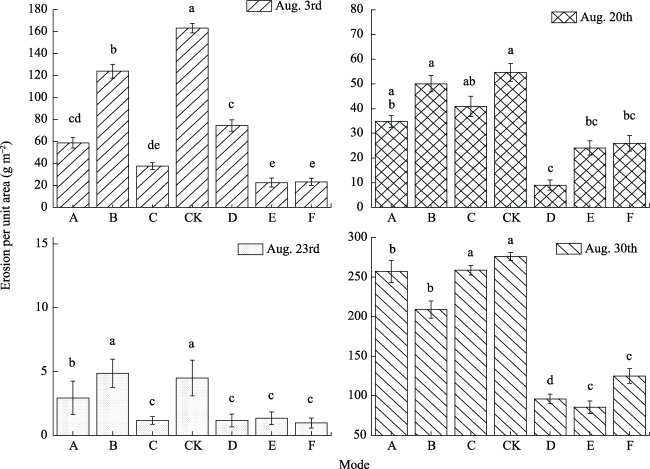
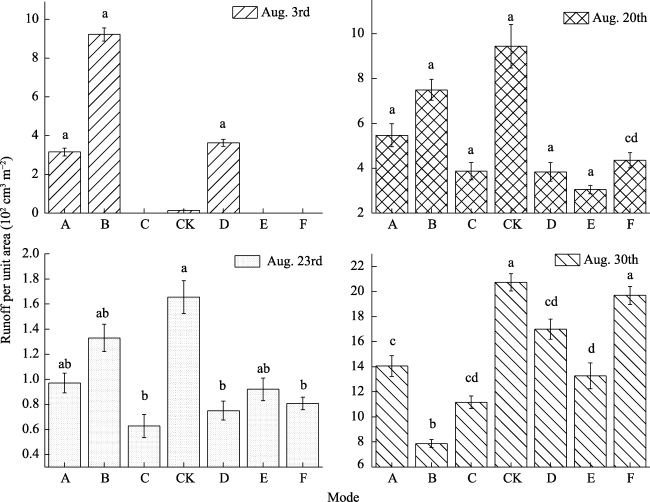
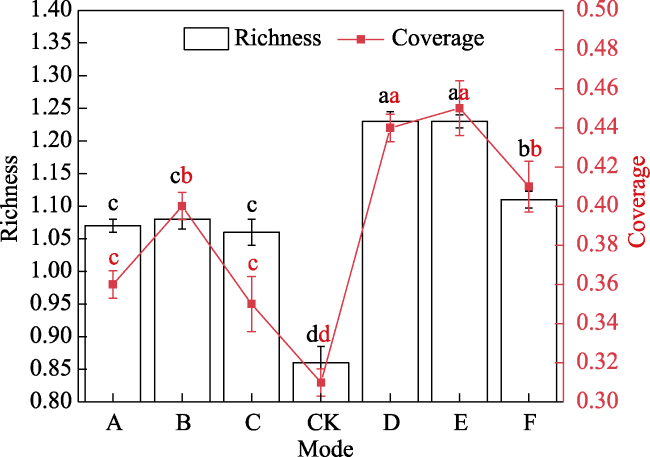
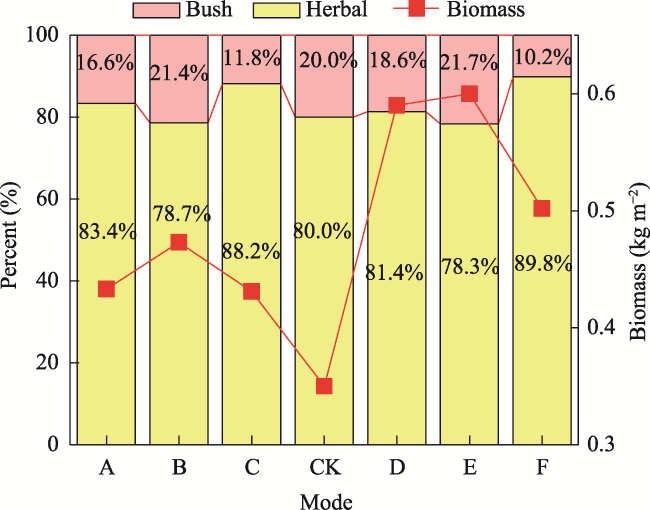
In the coal base of Ningdong, there are many ecological problems associated with the existing local technologies, such as the imperfect technical system, a poor engineering effect, limited generalization value, and the lack of monitoring and evaluation. Based on the screening and integration of the existing technologies in the coal base of Ningdong, we have designed and constructed 14 ecological restoration plots in this study. The 14 plots were composed of two replicates for each of six technical modes and CK treatment (nothing treatment). These technical modes include ecological bag, ecological rod, wire gabion, gravel sand barrier, living sand barrier and wheat straw sand barrier modes. The 14 plots were all constructed in the slope of Yangchangwan waste dump of Ningdong. Several monitoring indicators were selected for vegetation growth observation and data collection, including erosion amount, runoff amount, runoff depth, richness, coverage, herbal biomass, bush biomass and total biomass. Furthermore, the TOPSIS (Technique for Order Preference by Similarity to Ideal Solution) method was utilized to evaluate the effects of the six ecological restoration modes. The results showed that the wheat straw sand barrier mode area had the best vegetation restoration effect, with coverage of 45%, richness of 1.23 and an aboveground biomass of 0.60 kg m-2. Its monitoring results were 45.16%, 43.02%, and 71.43% higher than in the CK, respectively. The gravel sand barrier model presented the least runoff and erosion yield, and its total erosion was 133.46 g m-2 which was only 26.80% of the CK. The runoff amount was 863.32 cm3 m-2, even 50.00% less than CK. The TOPSIS results show that the living sand barrier, gravel sand barrier, and wire gabion modes are the three best ecological restoration modes overall.

Cite this article

LI Wenye , YE Jinpeng , GUO Xiaoping , LIN Yachao , XUE Dongming , LI Guoqi , YANG Fan , ZHANG Wei , GU Qingmin . Effects of Ecological Restoration Modes on Runoff and Erosion Reduction and Vegetation Restoration of Waste Dump Slopes in Lingwu[J]. Journal of Resources and Ecology, 2023 , 14(4) : 822 -832 . DOI: 10.5814/j.issn.1674-764x.2023.04.015

1 Introduction

Coal is one of the most important sources of energy for China and the world (Hu et al., 2017). In China’s total energy structure, coal resources account for more than 70% of the total, and will remain a dominant component in the next few decades (Yang et al., 2019). As the essential coal base in Ningxia, the Ningdong coal base uses underground operations as the primary coal extraction method. During the process of coal mining and washing, coal gangue accounts for approximately 10%-15% of the total coal production.
Thus, it is normally regarded as a solid waste (Guo et al., 2021). Currently, it has even become one of the largest industrial residues (Wang et al., 2017). In the northwestern arid desert region of China, the comprehensive utilization rate of coal gangue is only 30% and it is limited by the low regional development and economic level (Ren, 2017). After it is mined, the gangue is directly transported to waste dumps, resulting in the large-scale accumulation of coal gangues and formation of huge gangue hills. These stockpiles have the potential for spontaneous and uncontrollable combustion, even leading to environmental hazards, especially in low-temperature areas (Peng et al., 2019; Geng et al., 2020). Thus, large amounts of SO2, NOx, CO and other harmful gases are released into the atmosphere (Li and Wang, 2019). In addition, as it is soaked by surface and ground water, toxic elements are released from the coal gangue, which harms humans via bioaccumulation (Yang et al., 2021).
As another significant problem, the development of coal resources has led to a sharp decline in regional vegetation coverage. Severe damage to the ecosystem has exceeded its ability to self-repair, and the vegetation cannot be restored over time. The mining process also destroys the soil structure, which hinders the absorption of water and nutrients by vegetation. In addition to directly causing destruction of the vegetation landscape, the development of coal resources also leads to changes in the groundwater level, as well as increases in the area of soil erosion and water and soil loss. When rainstorms strike, the disorderly stacking of coal gangue may trigger serious geological disasters, such as debris flow and landslides. These geological disasters always threaten the ecological environment, and can even cause tremendous economic losses (Querol et al., 2008). Generally, the extensive development and utilization of coal resources seriously threatens the region’s fragile ecological environment in Western China (Yang et al., 2019). Therefore, ecological restoration is an inevitable choice when dealing with these environmental problems.
Since the end of the 1950s, scattered small-scale restoration experiments have been carried out. Land reclamation in Ningdong focuses on land restoration, with the aim of achieving pre-disturbance productivity (Li et al., 2022). Currently, some ecological restoration technologies, such as slope cutting, soil covering and greening, have be applied in the Ningdong coal base. However, the ecological restoration capacity is relatively weak (Chen et al., 2022), and some problems are gradually exposed during implementation. Of the all problems to be resolved three are the most crucial. Firstly, the platform and slope in the waste dump lack interception and drainage facilities, so there are no protection and greening measures on the slopes, and they are vulnerable to erosion. Secondly, sandy soil is used in most restoration areas. However, because of its poor fertility, vegetation restoration is ineffective. Lastly, the existing ecological restoration engineering technology mode in the Ningdong coal base is unreasonable, which leads to a poor engineering effect. Furthermore, the project lacks a long-term monitoring and implementation effect evaluation (Ye, 2020). Thus, the ecological restoration technology of the waste dump in this area urgently needs to be improved.
Ecosystem deterioration has been severely exacerbated by mining activities in the arid zone of Northwest China. Based on previous scattered small-scale restoration experiments, the existing effective ecological restoration technologies need to be integrated and the suitable ecological restoration technologies need to be optimized. Then, an integrated demonstration area of ecological restoration technology at the gangue hill should be established in this area. To the best of our knowledge, the effects of different restoration modes still need to be determined, and their soil and water conservation effects have not been reported. In this regard, variations in the vegetation growth in the arid area need to be the primary consideration. In order to fill this knowledge gap, this study aims to i) assess the runoff and erosion reduction effects under various restoration measures, ii) determine the vegetation spatial type after one year of restoration in an arid area, and iii) evaluate the ecological restoration effect of the mining area comprehensively. This study monitored the key technical indicators which affect the effectiveness of the ecological restoration project for the first time. The ecological restoration effect was evaluated and the value of the demonstration project is promoted. Then, the most suitable ecological restoration technology mode in the northwest arid desert area is put forward, which is of great significance for ensuring the ecological safety of the mining area.

2 Materials and methods

2.1 Study area

As is shown in Fig. 1, Yangchangwan Coal Mine is situated in Ningdong Town, Lingwu City, Ningxia Autonomous Region. The mine is located at the southwestern edge of Maowusu Desert, with Ordos Plateau in the northeastern part. Its average altitude is about 1270 m (Zhang et al., 2021). Ningdong mining area, which is affiliated with the Yangchangwan Coal Mine, is one of the 14 largest coal mine bases in China. Its known coal reserves are more than 27 billion tones (Wang et al., 2019). This area has an arid temperate zone climate, with sparse rainfall and strong evaporation. The annual and daily temperature ranges are variable and its annual average temperature is 8.9 ℃, while annual average precipitation is 192.9 mm, which is concentrated from July to September. The average evaporation is 1762.9 mm annually, and the wind speed is 2.6 m s-1 in Yangchangwan Coal Mine. Most soil types in this area are calcareous soil and aeolian sandy soil, and the contents of soil water and nutrients belong to the low level. Native vegetation includes mainly desert grassland and grassland belt sandy vegetation species, which are mostly annual or perennial shrubs and herbs. The vegetation community has characteristics of drought tolerance, cold tolerance and barren tolerance, and can survive in harsh environments. Common plants are Artemisia desert, Achnatherum splendens, Hedysarum scoparium, Setaria viridis and Chenopodium acuminatum. In the natural condition, vegetation coverage is generally between 40% and 50% (Ye, 2020).
Fig. 1 Maps of the geographical location of the study area

2.2 Experiment layout and monitoring

2.2.1 Experiment layout

The demonstration project in this study was built on the west slope of Yangchangwan waste dump, with a slope of 22°, slope length of 20-25 m and height of 10 m. Twelve ecological restoration communities and two CK plots were established. The periphery of the experiment area was constructed with concrete, with a height of 0.3 m. There was a 0.5 m wide space between the two adjacent communities for the masonry of water falling steps. Each community had a specification of 5 m width and 20 m length. There were six ecological restoration modes using the same soil improvement model. The specific mode types were as follows: A. Ecological bag mode, B. ecological rod mode, C. wire gabion mode, D. living sand barrier mode, E. gravel sand barrier mode, and F. wheat straw sand barrier mode. The soil improvement mode adopted ordinary aeolian sandy soil with shrub seeds (such as Haloxylon ammodendron, Reaumuria songarica, Apocynum venetum, Hedysarum scoparium, Calligonum mongolicum, Caragana korshinskii, Artemisia annua and Sophora alopecuroides). The slope layout and repair mode are shown in Fig. 2.
Fig. 2 Layout of the ecological restoration area
The restoration area was constructed in April, 2019. The detailed layout method for each mode is described as follows.
Mode A: The ecological bag is filled with planting soil, and a group of ecological bags are stacked with a vertical spacing of 5 m on the slope, and each group of shaped bags is stacked in three lines. The bag itself is made of high molecular polypropylene and other materials with strong corrosion resistance.
Mode B: The ecological stick is 10 cm in diameter. It is distributed in a diamond shape that is 5 m×5 m in size. The rod is filled with planting soil, sealed with sewing thread using a hand-held sewing machine, anchored with soil nails every 1.0-1.5 m, and the overlap is supported with anchorage.
Mode C: The wire gabion is 5 m long, 5.5 m wide and 0.3 m high. The wire gabion is laid horizontally and distributed at the interval of 3 m on the slope surface to ensure that the wire gabion is close to the slope surface without gaps. The exposed wire gabion is 0.15 m and the burial depth is 0.15 m.
Mode D: The gravel sand barrier mode is based on the slope surface spacing of 1 m. It is laid with sand barriers in a flat orientation. Coal gangue blocks with a diameter of 5-10 cm are selected as gravel. The coal gangue is ridged with a width of 10-15 cm and a height of 5-10 cm, and the sand barriers are closely connected.
Mode E: The wheat straw sand barrier mode is based on the slope spacing of 1 m. Sand barriers are laid in a flat orientation. High quality long wheat straw is selected as the wheat straw in this mode. The stacking thickness is 5-10 cm high, and the sand barriers are closely connected.
Mode F: The living sand barrier mode is mainly made of cutting seedlings. They form a grid which is 2 m×2 m.
In this experiment, red willow was selected for cutting, and the seedlings were pretreated before cutting. The pretreatment procedure included pruning, cutting soaking, and rooting powder soaking in three steps.

2.2.2 Monitoring indicators

Indicators were selected from the three aspects of rainfall, soil erosion, and vegetation restoration effect.
(1) Cumulative rainfall and rainfall intensity of monitored rainfall
The above data were monitored by meteorological stations, which can automatically monitor under various weather conditions, including during rainfall time.
(2) Runoff amount and erosion amount
Runoff amount was measured by the volume method, and erosion was measured by the sampling method.
The ultimate content of runoff depends on the amount of water in the collection device. All devices were arranged at the bottom of the plot. The collecting bucket and the water receiving tank were connected with inverted pipes.
After measuring the runoff amount in the collecting bucket, the mud samples in the collecting bucket were fully stirred with a wooden stick to mix the mud and water thoroughly. Then three mud samples within the sampling bottle were collected. Each of the bottles had a volume of 1000 ml, and they were taken back to the laboratory for erosion analysis.
The outside of the sampling bottle was wiped with a mud water sample in the laboratory, then the whole mud water sample was poured into the measuring cylinder to measure the volume (V) and it was filtered with quantitative filter paper. Then the filter paper and the erosion on the filter paper were placed into an oven at 105 ℃ in order to dry them to a constant weight prior to the calculations.
(3) Richness, coverage and biomass
① Richness: H'= Σ Pi lnPi (1)
where H' represents richness, and Pi represents relative importance.
② Coverage: The percentage of the vertical projection area of aboveground plant parts in the area of the sample plot.
③ Biomass
Herb biomass: The sample method was adopted for calculation, and the sample size was 50 cm×50 cm. The random sampling method was used for sampling. After sampling, all plants in the plot were harvested, dried and weighed to obtain the aboveground biomass. The aboveground biomass in the whole restoration area can be obtained by conversion.
Shrub biomass: Calculating the aboveground biomass of the shrub layer used the relative growth method. First, a 50 cm×50 cm quadrat was randomly selected in the plot, and then each shrub in the quadrat was checked, and the tree height, diameter and other curves were drawn according to the measurement results. After determining the standard trees of each diameter class, a certain number of trees were selected and cut down. Next, the biomass of stem, leaf and branch of standard trees were calculated, and finally the regression relationship between their biomass and corresponding standard trees were established. The aboveground biomass of the shrub layer in the quadrat was obtained by this regression model.

2.3 Data analysis

All indicators measured in this study are quantitative, and the impacts of subjective factors on the results should be avoided. Therefore, TOPSIS was used as the evaluation method for the ecological restoration effect of this demonstration project, which was mainly calculated by MATLAB software.

3 Results and discussion

3.1 Rainfall characteristics

In arid areas, water is the main factor for plant growth and rainfall is the main source of water, so the relevant research is necessary here. According to the analysis of the statistical data from the meteorological station, the rainfall in study area in 2019 was 266 mm, which was 180 mm higher than the regional average level, indicating that 2019 was a special year with lots of rainwater. The data from the meteorological station could provide information on the accumulated rainfall within 24 h that was less than 10.0 mm, 10.0-25.0 mm, 25.0-50.0 mm and ≥ 50.0 mm, which are respectively regarded as light rain, moderate rain, heavy rain and rainstorm (Qin, 2018). The rainy season in this region is mainly from June to September. In 2019, the rainfall here was mainly moderate and light rain, with 43 light rains, 18 moderate rains, only one heavy rain, and no rainstorms. The number of light rain events accounted for 69% of the annual rainfall, with 29% as moderate rain, and 2% as heavy rain. The total amount of moderate and light rain accounted for 91% of the annual rainfall. These data show that light rain is the most common in Ningdong, and that medium and light rain constitute the main source of rainfall here. Based on the records above, the results for the division of each rainfall category are shown in Fig. 3. This figure shows that light rain is most common, and medium light rain is the main source of rainfall in this area. Combining this with the rainfall intensity grading results in Fig. 4, the secondary rainfall intensity in 2019 was mainly below 5 mm h-1, accounting for 95% of the total annual rainfall. In runoff area, there were five rainfall events that generated runoff in 2019, four of which occurred in August. Focusing on the four rainfall events in August, they occurred on Aug. 3rd, Aug. 20th, Aug. 23rd and Aug. 30th. The first three rains belong to the moderate rain category, with 1.34 mm h-1, 1.39 mm h-1, and 1.13 mm h-1 rainfall intensity for the events. By contrast, the fourth rain was a heavy rain, which even had a violent rainfall intensity of 16.27 mm h-1. The rainfall lasted only for a short time, with a huge rainfall, so the damage to the slope from that one event was tremendous.
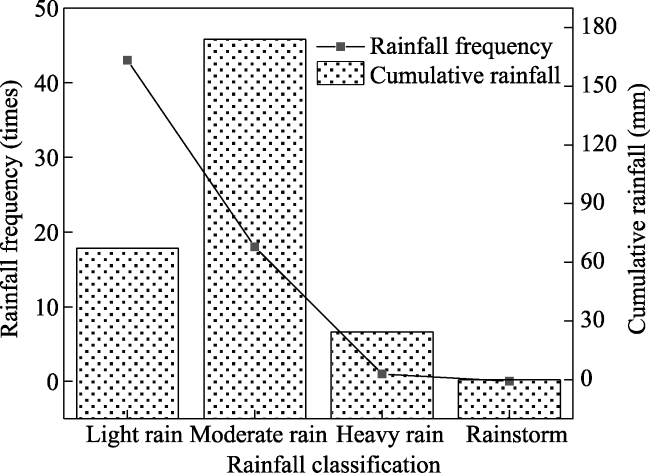
Fig. 3 The division of each rainfall category
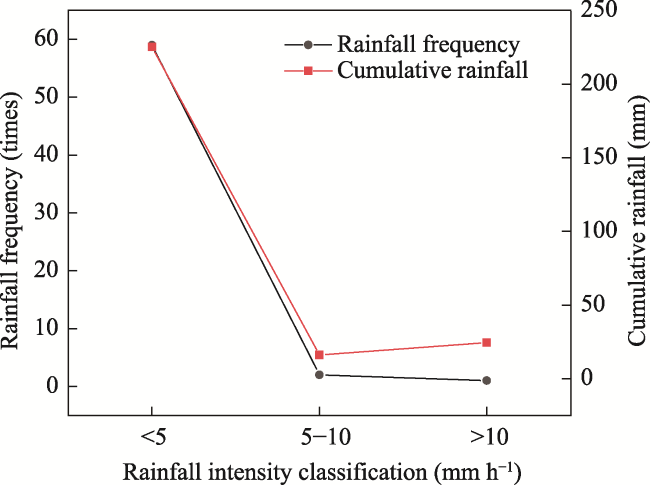
Fig. 4 Regional rainfall intensity and cumulative rainfall

3.2 Effects of different restoration modes on erosion and runoff reduction

3.2.1 Effects of different restoration modes on soil erosion resistance

Rainfall in the flood season is the critical cause of runoff and erosion in the waste dump slope area, and the occurrence of erosive rainfall in the rainy season is much more frequent than in the dry season (Xue et al., 2021). In August 2019, there were four rainfall events that produced runoff and erosion, with a total rainfall of 62.2 mm. As is shown in Fig. 5, the erosion extents for the different restoration modes in the four rainfall events show diverse characteristics, specifically that erosion yield varied from 9.03 g m-2 to 259.05 g m-2. Among all restoration mode plots in the main precipitation events in August, the largest erosion amount emerged in the CK group, followed by the ecological rod mode. By contrast, the two modes of wheat straw sand barrier mode and gravel sand barrier mode had the least erosion, and their yields were only 35.16% and 26.80% of CK. Due to the diversity of rainfall in the four events, the runoff and erosion yield were also different. The third rainfall event in August led to less erosion, so the erosion status of each mode was the weakest among the four events, and there were significant differences between each mode plot and CK (P<0.01).
Fig. 5 Erosion amounts of rainfall in August for the different modes
There are significant differences between the plots with various ecological restoration modes and CK on the slope (P<0.01), implying that each mode has a certain ability to prevent runoff and erosion production. The slope mode can not only intercept runoff and erosion caused by rainfall, but also increase the rainfall infiltration rate, increase the soil water conservation effect, benefit vegetation growth and even enhance slope stability (Ma et al., 2022). However, there are significant differences in the prevention and control effects of the different modes on runoff and erosion (P<0.01). These differences may be caused by the following two factors. One is the nature of each slope mode, and different ecological materials have various interception effects (Yang et al., 2017). The second reason is that the density of pattern arrangement is different on each slope (Xia et al., 2022). A denser arrangement of ecological measures leads to less erosion yield and a better protection effect. The results of this study show that the gravel sand barrier mode and wheat straw sand barrier mode had the least erosion yields. They were designed with slope spacing by 1 m for each unit. Next are the living sand barrier and wire gabion sand barrier, with slope spacing of 2-3 m, which had intermediate erosion yields. Lastly, the slope spacing of the ecological bag mode and ecological rod mode were both 5 m, and they showed abundant erosion yield.

3.2.2 Runoff characteristics of different ecological restoration modes

The precipitation and rainfall intensity on Aug. 30th were extremely high, which reached the level of a rainstorm. Both erosion amount and runoff were far more than during the other rainfall events. The erosion amount under the wire gabion mode showed the highest value. Rainfall intensity on that day even reached 16.27 mm h-1. Except for the ecological rod mode, the runoff levels of the other measures exceeded 1000 cm3 m-2, and the maximum for the CK treatment reached 2073.3 cm3 m-2 (Fig. 6). There were no significant differences among the various restoration modes in the runoff produced by heavy rain. On Aug. 3rd, the rainfall was at a relatively low intensity, and there was no runoff except for the modes of ecological bag, ecological rod and gravel sand barrier. There were no significant differences among these three modes, suggesting that the ecological restoration mode had little impact on preventing runoff in that case.
Fig. 6 Runoff amounts of rainfall in August 2019 for the different modes
The variations in vegetation coverage may be related to the differences in soil erosion and nutrient loss extent caused by the mode types. The N, P and K in the soil will migrate and transform with surface runoff and soil erosion, but the extent of element migration is related to the amount of soil erosion and surface runoff (Wang et al., 2022). The data in Fig. 5 show that the runoff and soil erosion of ecological bags, wire gabions and CK were all intense, so the vegetation growth of these three modes is poor and the coverage rates are low. In each ecological restoration area, the diversity of species richness is significant, which is due to a variety of reasons. First, the different modes lead to certain differences in the microenvironment, which can have strong effects on the seed germination rate, survival rate, mortality rate and seedling growth of different plant species (Chen et al., 2013). Second, the distribution of seed banks in aeolian sandy soil is uneven. Finally, the seeds of surrounding plants can fly into the restoration area due to the wind force, and the seeds falling in each plot area are random.

3.3 Effects of different restoration modes on vegetation restoration

3.3.1 Vegetation richness and coverage results

The vegetation coverage of each restoration plot in 2019 is shown in Fig. 7. The vegetation coverage of different modes varied from 35% to 45%, which were significantly higher than that of CK (P<0.05). This indicates that these modes did play a certain role in improving the vegetation coverage, but the effect varies among the diverse modes. The coverage rates of wheat straw sand barrier, gravel sand barrier, living sand barrier and ecological rod were relatively high, ranging from 40% to 45%, or basically the same as the 40%-50% coverage of natural vegetation outside the CK area. In contrast, the coverage rates of ecological bag, wire gabion and CK were lower than the coverage of natural vegetation outside the CK area. The coverage of wheat straw sand barrier mode was the highest, and there was no significant difference between gravel sand barrier and wheat straw sand barrier mode (P<0.05), indicating that these two have similar effects on vegetation coverage.
Fig. 7 Richness and coverage under the different ecological restoration modes
The data in Fig. 7 show that the species richness levels for the different modes were all more than 1 and significantly different from CK (P<0.05). When the seed types and aeolian soil sources are identical, the species richness of each of the ecological restoration plots are still significantly different. The richness was 1.23-1.43 times higher than that of CK. The levels of abundance in the gravel sand barrier and wheat straw sand barrier ecological restoration areas were higher, both reaching 1.23. These values were 1.43 times higher than that of CK, and there were significant differences between these two models and the other models (P<0.05), indicating that the community stability of these two models is better. However, the richness levels of ecological bag, ecological rod, wire gabion and living sand barrier community were 1.07, 1.08, 1.06 and 1.11, respectively. The differences between wire gabion, ecological rod and ecological bag were not significant, indicating that the community stability of these three models is similar. The lowest abundance was the CK plot at 0.86, which may be related to the location of the CK area.

3.3.2 Vegetation biomass

Aboveground biomass indicates the growth trend, productivity and storage capacity of the vegetation community. The aboveground biomass levels of the different modes are shown in Fig. 8. In the horizontal structure, from high to low values, the aboveground biomass of each mode is in the order of wheat straw sand barrier, gravel sand barrier, living sand barrier, ecological rod, ecological bag, wire gabion and CK. The aboveground biomass of the model plots were significantly different from that of CK (P<0.05). The aboveground biomass of wheat straw sand barrier mode were the highest, reaching 0.6 kg m-2, or 1.71 times as much as in CK. There were significant differences in biomass among different modes (P<0.05), which may have been caused by the differences in vegetation coverage and growth due to different soil erosion levels in the various slope modes (Zhang et al., 2015; Zhang et al., 2022). There was no significant difference between gravel sand barrier mode and wheat straw sand barrier mode (P<0.05), indicating that these two models have similar effects on aboveground biomass. In the vertical structure, the biomass of the herbs was apparently higher than that of the shrubs. On the one hand, there are many different kinds of vegetation in herb layer, and the total number of plants is much higher than in the shrub layer (Rawlik et al., 2018). On the other hand, two reasons can cause the crown width of the shrub layer to be smaller than that of the herb layer, i.e., the slow growth of shrub species versus the rapid growth of herbs, and the nutrient content of the topsoil (Heineman et al., 2005; Aguiar et al., 2020).
Fig. 8 Comparison of aboveground biomass of vegetation among the different modes

Note: Percentages refer to the percentage of shrubs or herbs in the total biomass, and the line indicates the biomass values under the different ecological restoration modes.

3.3.3 Vegetation species

There were slight differences in vegetation type characteristics among different mode types, although almost all plots had eight types of vegetation except for the wheat straw sand barrier mode. The data in Fig. 9 show that there were three shrub species in the CK plot, namely Caragana korshinskii, Elaeagnus angustifolia and Sophora alopecuroides. However, the number of plants was small, so the vegetation type is classified as grassland. The remaining plots are classified as shrub grassland, indicating that the slope mode has a great impact on the vegetation type of the plot. There were four communities with Caragana korshinskii and Artemisia mongolica as the main vegetation species, namely ecological bag plot, wire gabion plot, gravel sand barrier plot and living sand barrier plot. Artemisia mongolica was the main herbaceous plant in all communities, and Caragana korshinskii was the main shrub in five communities. These findings indicate that Caragana korshinskii and Artemisia mongolica are significant plant species for vegetation restoration in the arid area. The wheat straw sand barrier restoration area was mainly planted with Calligonum angustifolia, in addition to Caragana korshinskii and Artemisia annua, and these three kind of plants had abundances of 23.94%, 19.51% and 54.93%, respectively. Aside from Caragana, the main vegetation species in the ecological rod mode were Artemisia annua and Calligonum angustifolia, with abundances of 42.11% and 32.89%, respectively. The species listed above are the main plant species in each restoration area, and there are still a few other minor species with some differences in each community, including Cauliflower, Calligonum angustifolia, Sophora alopecuroides, Chenopodium cuspidatum, Suaeda salsa and Echinochloa crusgali.
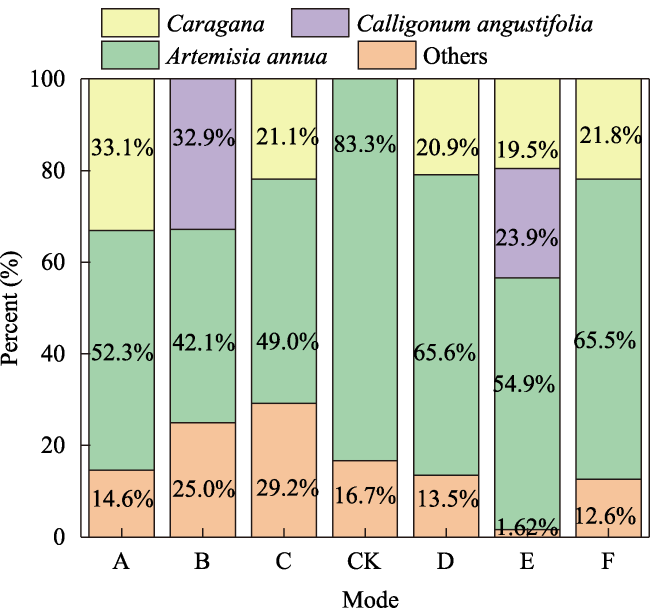
Fig. 9 Percentages of the main vegetation species under the different modes
The shrub layer includes two families and three species, with fewer vegetation species and poor species diversity. There are several reasons that can contribute to the phenomenon. On the one hand, the number of quadrats may be too small, so our investigation results could be based on relatively random findings of individual plants. On the other hand, the seedlings may die due to the continuous high temperatures after the grass curtain is uncovered (Weng et al., 2021; Luoranen et al., 2022). The three essential indexes—relative frequency, relative density and relative coverage—of leguminous Caragana were higher than those of the other two shrubs, showing that Caragana was the main tree species among the shrub tree types. The relative frequency and density of Calligonum angustifolia were higher than those of Sophora alopecuroides, but the relative coverage was smaller than that of Sophora, which indicates that the crown width of Calligonum angustifolia was obviously smaller than that of Sophora alopecuroides. The relative frequencies of Caragana and Elaeagnus angustifolia were relatively high, with importance values of 42.50% and 31.08%, respectively, which indicates that the distribution of these two plant species was relatively uniform. The relative frequency of Sophora alopecuroides was relatively low, which implies that the distribution of this plant species was poor.
The herbaceous layer includes five families and 11 species. There are many kinds of vegetation with extensive species diversity. More significantly, the area even has the emergence of some plant species that had not been sown. Therefore, there may be seed banks in the covered aeolian sand soil (Qian et al., 2021), and some plant seeds from outside the experimental area may fall into the plots due to wind force. Among the herbaceous plants, six species belong to Chenopodiaceae, demonstrating that most Chenopodiaceae plants are suitable for growing in the arid desert areas. The characteristic value of Artemisia (Compositae) is higher than those of other herbs, which indicates that Artemisia annua is the main tree species of herbs, and other herbs are less important than Artemisia annua. Although there is only one species in the purslane family, and only two in Setaria (Gramineae) and Pleuropsis (Chenopodiaceae), they are of great significance to the biodiversity of herbaceous plants. This diversity not only affects the richness of plant species, but also affects the stability of the community.

3.4 Evaluation of ecological restoration capacity based on TOPSIS

As we know, the ecological restoration effect is characterized in many aspects. In this study, TOPSIS was performed to evaluate the ecological restoration ability. The selection of evaluation indicators is the prerequisite for the evaluation of ecological restoration measures, and the different evaluation indicators directly affect the evaluation results. In this study, eight critical indexes were selected from the two aspects of reducing erosion intensity and increasing vegetation growth intensity of the reclaimed land. The indicators are erosion amount, runoff amount, runoff depth, richness, coverage, herbal biomass, bush biomass and total biomass. Among them, richness, coverage, herbal biomass, bush biomass and total biomass are positive indicators, that is, a larger indicator value indicates better restoration results. Erosion amount, runoff amount, runoff depth are negative indicators, which means a smaller indicator value indicates better restoration results. The negative indicators were positively processed when processed by TOPSIS. Since the units and magnitudes of each index value are diverse, it was necessary to normalize each index value. We obtained the weight values of each index from Table 1.
Table 1 Weight table of each monitoring index
Index Erosion amount Runoff amount Runoff depth Richness Coverage Herbal Bush Biomass
Weight 0.310 0.295 0.271 0.007 0.009 0.018 0.071 0.019
All indexes inferring the comprehensive effect were evaluated by TOPSIS, and a greater relative closeness indicates a better comprehensive evaluation effect. The data in Table 2 reveals the comprehensive restoration effect as follows: D (living sand barrier mode) > E (gravel sand barrier mode > C (wire gabion mode) >F (wheat straw sand barrier mode) > B (ecological rod mode) > A (ecological bag mode) > CK (no treatment). The final results show that the relative closeness of treatment E (gravel sand barrier mode) has the most ideal effect, with the result of 0.204. Several factors lead to this effect. First of all, this kind of mode is based on the slope spacing of a 1 m×1 m grid laying sand barrier, which is a relatively high density. Secondly, the gravel is selected stroma with a moderate diameter, mainly coal gangue stones with diameters between 5-10 cm. Most importantly, the sand barrier is closely connected, which largely avoids the hydraulic and wind erosion caused by sparse slope protection measures (Xu et al., 2021). Moreover, the coal gangue stones of different specifications are placed in an orderly manner, which forms a microclimate zone in the middle. This arrangement plays a buffer role and is more conducive to plant growth.
Table 2 Evaluation coefficients of the ecological restoration modes
Mode Relative closeness Rank
A Ecological bag mode 0.255 6
B Ecological rod mode 0.191 5
C Wire gabion mode 0.158 3
CK No treatment 0.158 7
D Living sand barrier mode 0.116 1
E Gravel sand barrier mode 0.104 2
F Wheat straw sand barrier mode 0.017 4

4 Conclusions

This study focused on the ecological restoration demonstration project of Yangchangwan waste dump in the northwest arid desert area of China. Based on investigating and screening the key indicators, the TOPSIS method was used to comprehensively evaluate the effects of diverse modes. This analysis led to three main conclusions.
(1) The different modes are all beneficial for promoting vegetation restoration. According to the indexes of coverage, richness and aboveground biomass, the wheat straw sand barrier mode area showed the best vegetation restoration effect, with coverage of 45%, richness of 1.23 and aboveground biomass of 0.60 kg m-2.
(2) The runoff and erosion yield of the different models are significantly different. The gravel sand barrier model plot presented the least runoff and erosion yield. During the whole observation period, its total erosion was 133.46 g m-2. The runoff amount was 863.32 cm3 m-2, which was 50.00% less than the CK.
(3) Based on the results obtained in this study, the living sand barrier, gravel sand barrier, and wire gabion modes can be preliminarily recommended for wide promotion in the local area.
[1]
Aguiar B A D S, Soares E S D S, Araujo V K R D, et al. 2020. The effect of reducing soil water availability on the growth and reproduction of a drought-tolerant herb. Acta Oecologica, 107: 103617. DOI: 10.1016/j.actao.2020.103617.

DOI

[2]
Bi Y L, Peng S P, Du S Z. 2021. Technological difficulties and future directions of ecological reconstruction in open pit coalmine of the arid and semi-arid areas of Western China. Journal of China Coal Society, 46(5): 1355-1364. (in Chinese)

[3]
Chen F, Xu Y, Wang C, et al. 2013. Effects of concrete content on seed germination and seedling establishment in vegetation concrete matrix in slope restoration. Ecological Engineering, 58: 99-104.

DOI

[4]
Chen Z X, Yang Y J, Zhou L, et al. 2022. Ecological restoration in mining areas in the context of the Belt and Road Initiative: Capability and challenges. Environmental Impact Assessment Review, 95(6): 106767. DOI: 10.1016/j.eiar.2022.106767.

DOI

[5]
Geng H, Wang F, Yan C, et al. 2020. Leaching behavior of metals from iron tailings under varying pH and low-molecular-weight organic acids. Journal of Hazardous Materials, 383: 121136. DOI: 10.1016/j.jhazmat.2019.121136.

DOI

[6]
Guo S J, Zhang J X, Li M, et al. 2021. A preliminary study of solid-waste coal gangue based biomineralization as eco-friendly underground backfill material: Material preparation and macro-micro analyses. Science of the Total Environment, 770(3): 145241. DOI: 10.1016/j.scitotenv.2021.145241.

DOI

[7]
Heineman J L, Simard S W, Sachs D L, et al. 2005. Chemical, grazing, and manual cutting treatments in mixed herb-shrub communities have no effect on interior spruce survival or growth in southern interior British Columbia. Forest Ecology and Management, 205(1): 359-374.

DOI

[8]
Hu Z Q, Shao F, McSweeney K. 2017. Reclaiming subsided land with Yellow River sediments: Evaluation of soil-sediment columns. Geoderma, 307(2): 210-219.

DOI

[9]
Li G S, Hu Z Q, Li P Y, et al. 2022. Innovation for sustainable mining: Integrated planning of underground coal mining and mine reclamation. Journal of Cleaner Production, 351(393): 131522. DOI: 10.1016/j.jclepro.2022.131522.

DOI

[10]
Li J Y, Wang J M. 2019. Comprehensive utilization and environmental risks of coal gangue: A review. Journal of Cleaner Production, 239: 117946. DOI: 10.1016/j.jclepro.2019.117946.

DOI

[11]
Luoranen J, Riikonen J, Saksa T. 2022. Factors affecting winter damage and recovery of newly planted Norway spruce seedlings in boreal forests. Forest Ecology and Management, 503(2): 119759. DOI: 10.1016/j.foreco.2021.119759.

DOI

[12]
Ma S, Wang H Y, Wang L J, et al. 2022. Evaluation and simulation of landscape evolution and its ecological effects under vegetation restoration in the northern sand prevention belt, China. CATENA, 218: 106555. DOI: 10.1016/j.catena.2022.106555.

DOI

[13]
Peng D D, Wang Y G, Liu X M, et al. 2019. Preparation, characterization, and application of an eco-friendly sand-fixing material largely utilizing coal-based solid waste. Journal of Hazardous Materials, 373(1): 294-302.

DOI

[14]
Qian J Q, Wang Z W, Klimešová J, et al. 2021. Belowground bud bank and its relationship with aboveground vegetation under watering and nitrogen addition in temperate semiarid steppe. Ecological Indicators, 125(7005): 107520. DOI: 10.1016/j.ecolind.2021.107520.

DOI

[15]
Qin L Y. 2018. Study on relation between runoff plot rainfall and sediment production under different soil and water conservation measures. Heilongjiang Hydraulic Science and Technology, 46(11): 51-54, 206. (in Chinese)

[16]
Querol X, Izquierdo M, Monfort E, et al. 2008. Environmental characterization of burnt coal gangue banks at Yangquan, Shanxi Province, China. International Journal of Coal Geology, 75(2): 93-104.

DOI

[17]
Rawlik M, Kasprowicz M, Jagodziński A M, et al. 2018. Canopy tree species determine herb layer biomass and species composition on a reclaimed mine spoil heap. Science of the Total Environment, 635: 1205-1214.

DOI

[18]
Ren S. 2017. Study on soil nutrients and heavy metal pollution on coal waste pile of different usetypes. Diss., Taiyuan, China: Shanxi Normal University. (in Chinese)

[19]
Vo T L, Nash W, Del Galdo M, et al. 2022. Coal mining wastes valorization as raw geomaterials in construction: A review with new perspectives. Journal of Cleaner Production, 336(2): 130213. DOI: 10.1016/j.jclepro.2021.130213.

DOI

[20]
Wang J M, Li X F, Bai Z K, et al. 2017. The effects of coal gangue and fly ash on the hydraulic properties and water content distribution in reconstructed soil profiles of coal-mined land with a high groundwater table. Hydrological Processes, 31(3): 687-697.

DOI

[21]
Wang L H, Yen H, Huang C H, et al. 2022. Erosion and covered zones altered by surface coverage effects on soil nitrogen and carbon loss from an agricultural slope under laboratory-simulated rainfall events. International Soil and Water Conservation Research, 10(3): 382-392.

DOI

[22]
Wang Z X, Guo J J, Xi M U, et al. 2019. Pollution characteristics and inhalation exposure risk of atmospheric PAHs in Ningdong Base. China Environmental Science, 39(7): 3102-3112.

[23]
Weng J Y, Li P L, Rehman A, et al. 2021. Physiological response and evaluation of melon (Cucumis melo L.) germplasm resources under high temperature and humidity stress at seedling stage. Scientia Horticulturae, 288(1): 110317. DOI: 10.1016/j.scienta.2021.110317.

DOI

[24]
Xia J Q, Zhu W T, Liu X B, et al. 2022. The effect of two types of grid transplantation on coral growth and the in-situ ecological restoration in a fragmented reef of the South China Sea. Ecological Engineering, 177: 106558. DOI: 10.1016/j.ecoleng.2022.106558.

DOI

[25]
Xu Q, Chen W L, Zhao K Y, et al. 2021. Effects of land-use management on soil erosion: A case study in a typical watershed of the hilly and gully region on the Loess Plateau of China. CATENA, 206: 105551. DOI: 10.1016/j.catena.2021.105551.

DOI

[26]
Xue D M, Guo X P, Zhang X X. 2021. Runoff and sediment reduction under different slope ecological restoration modes of waste dump in arid mining area. Journal of Soil and Water Conservation, 35(6): 15-21, 30. (in Chinese)

[27]
Yang B, Wang W L, Guo M M, et al. 2017. Study on runoff and sediment reducing effects of erosion control measures on slopes of slag dumps with simulated rainfall. Acta Pedologica Sinica, 54(6): 1357-1368. (in Chinese)

[28]
Yang F L, Yun Y, Li G K, et al. 2021. Heavy metals in soil from gangue stacking areas increases children health risk and causes developmental neurotoxicity in zebrafish larvae. Science of the Total Environment, 794(3): 148629. DOI: 10.1016/j.scitotenv.2021.148629.

DOI

[29]
Yang Z, Li W P, Li X Q, et al. 2019. Assessment of eco-geo-environment quality using multivariate data: A case study in a coal mining area of Western China. Ecological Indicators, 107: 105651. DOI: 10.1016/j.ecolind.2019.105651.

DOI

[30]
Ye J. 2020. Preliminary evaluation on the effect of ecological restoration demonstration project of waste dump in Yangchangwan Coal Mine in Ningdong. Diss., Beijing, China: Beijing Forestry University. (in Chinese)

[31]
Zhang L, Wang J M, Bai Z K, et al. 2015. Effects of vegetation on runoff and soil erosion on reclaimed land in an opencast coal-mine dump in a loess area. CATENA, 128: 44-53.

DOI

[32]
Zhang X L, Xu L, Liu Y, et al. 2021. Evaluation of the growth effect of 9 shrubs in coal gangue hills in Lingwu Mining Area. Journal of Green Science and Technology, 23(8): 4-6. (in Chinese)

[33]
Zhang X X, Song J X, Wang Y R, et al. 2022. Threshold effects of vegetation coverage on runoff and soil loss in the Loess Plateau of China: A meta-analysis. Geoderma, 412(2): 115720. DOI: 10.1016/j.geoderma.2022.115720.

DOI

Outlines

/