
Journal of Resources and Ecology >
CFD Simulation of Wind Field Characteristics in Mining Areas: A Case Study of the Xinxing Coal Mine in Wuhai City, Inner Mongolia, China
|
QI Haoran, E-mail: qihaoran0814@163.com |
Received date: 2022-12-14
Accepted date: 2023-04-30
Online published: 2023-07-14
Supported by
Key Research and Development Program of China(2017YFC0504403)
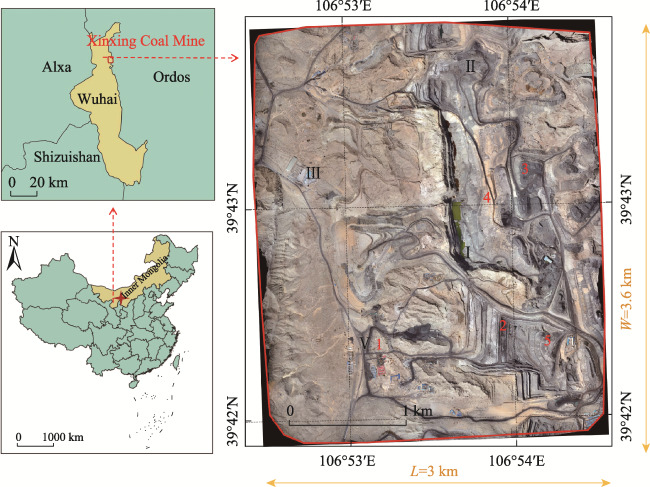
The large amount of coal mining activity in the arid region of northwestern China leads to vegetation degradation and a greater probability of strong winds. The characteristics of windy fields directly affect the sand-dust transportation process. To capture the wind field characteristics in a mining area, numerical simulation of computational fluid dynamics (CFD) was conducted using the Reynolds-Averaged Naiver-Stokes (RANS) turbulence model based on open source software OpenFOAM,taking Xinxing Coal Mine in Wuhai, Inner Mongolia, China as an example. The field test results at several observation points in the mining area were adopted for validating the numerical results. The distributions of mean wind speed and turbulence kinetic energy in the mining area for the W, NW and E wind directions are discussed. The results show that the mean wind speed distributions of the mining area are greatly affected by the raised mountains or hills on the eastern and western sides. When the approaching wind comes from the W and E directions, the mean wind speed is relatively low behind the raised terrain due to the wake effect. However, the magnitude of turbulent kinetic energy shows a relatively large value. The wake effect of mountains or hills is less pronounced as the approaching wind comes from the NW direction. The reduced mean wind speed and increased turbulence kinetic energy are also observed near the low-lying pits in the mining area. The results of this study can provide a theoretical basis for the prevention and control of aeolian sand and its construction in mining areas.
QI Haoran , WANG Jingxue , ZHAO Tingning , HU Ping , LI Feng , WANG Jinghua , ZHANG Yan , YAN Lei . CFD Simulation of Wind Field Characteristics in Mining Areas: A Case Study of the Xinxing Coal Mine in Wuhai City, Inner Mongolia, China[J]. Journal of Resources and Ecology, 2023 , 14(4) : 706 -716 . DOI: 10.5814/j.issn.1674-764x.2023.04.003
Table 1 Description of important functional areas in Xinxing Coal Mine |
| No. | Functional area | Underlying surface characteristics | Elevations relative to the lowest point (Z=0) |
|---|---|---|---|
| 1 | Coal transportation road | Vegetation cover low to medium, sub-clay, wet | Z1=120 m |
| 2 | Large pit | Breccia crust, dry | Z2=60 m |
| 3 | Coal gangue area | Gravel, dry | Z3=131 m |
| 4 | Coal storage yard | Round gravel, wet | Z4=152 m |
| 5 | Spoil area | Rock block, dry | Z5=148 m |
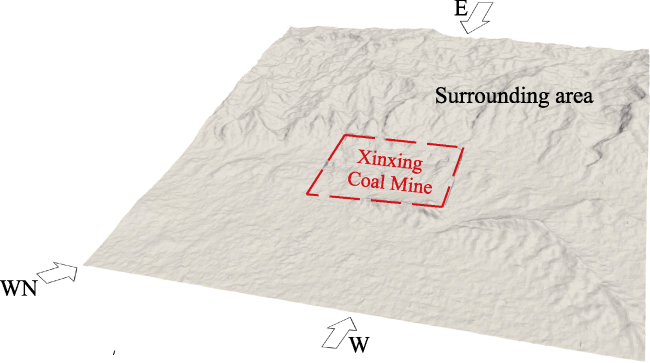
Fig. 1 Geographical location of the study areaNote: L is the east-west length and W is the north-south length. |
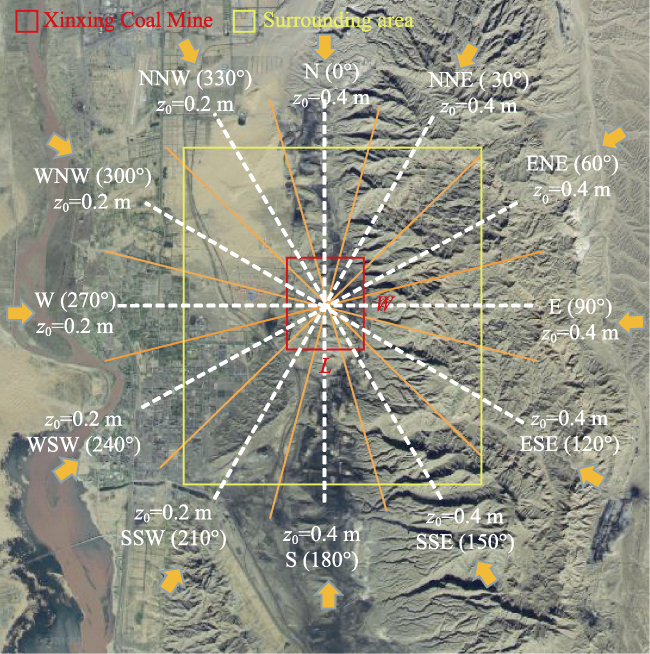
Fig. 2 Topographic characteristics around the Xinxing Coal Mine and aerodynamic roughness length z0 |
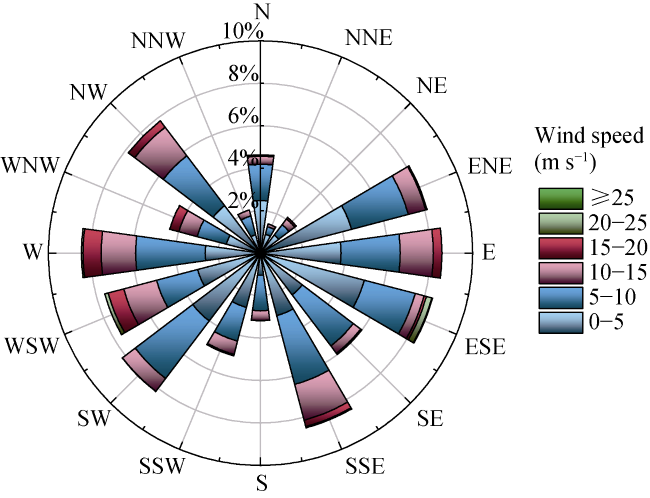
Fig. 3 Wind rose diagram of average wind speed at a height of 2 m in the mining area |
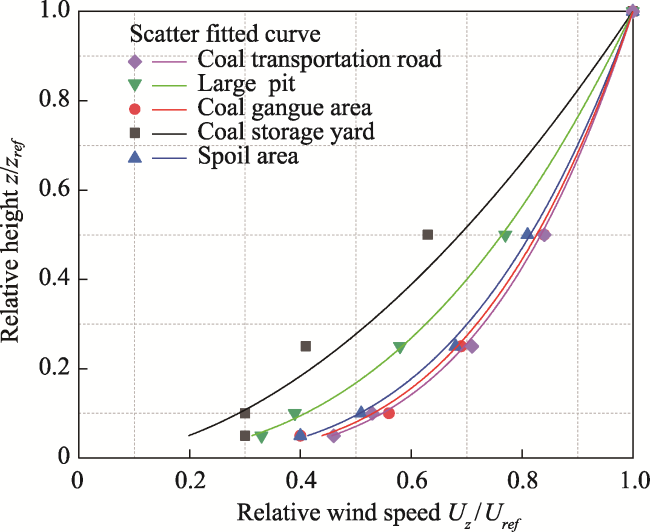
Fig. 4 Mean wind speed profiles in the different functional areas for the approaching wind in the W direction |
Fig. 5 Three dimensional geometric model |
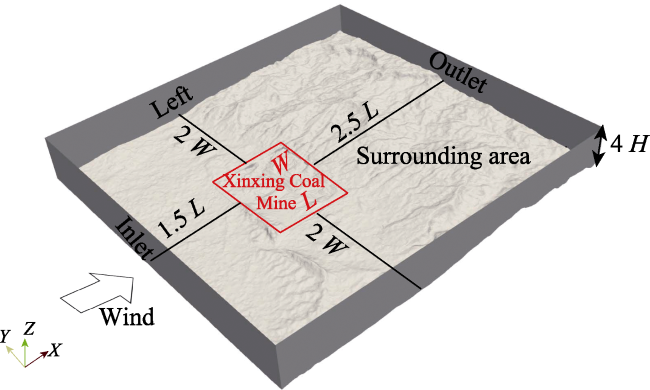
Fig. 6 Schematic diagram of the computational domain and boundary conditions for the approaching wind in the W directionNote: H is the altitude difference in Xinxing Coal Mine. |
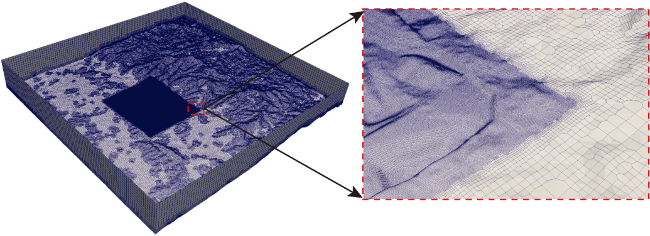
Fig. 7 Computational normal mesh for the approaching wind in the W direction |
Table 2 Default model coefficients for the k-ω SST model |
| Parameters | β* | β | γ | σk | σω |
|---|---|---|---|---|---|
| ${{\phi }_{1}}$ | 0.09 | 0.075 | 0.556 | 0.85 | 0.5 |
| ${{\phi }_{2}}$ | 0.09 | 0.0828 | 0.44 | 1 | 0.856 |
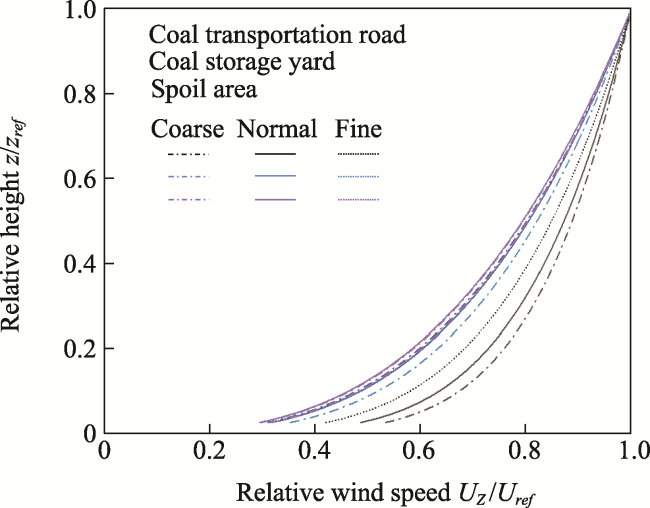
Fig. 8 Grid independence verification with the examples of three functional areas (No. 1, 4 and 5) in the mining area |
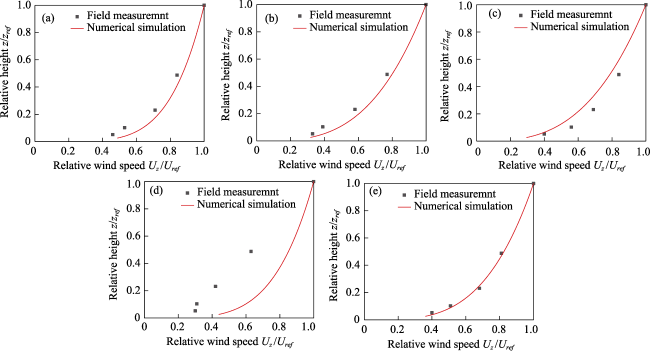
Fig. 9 Mean wind speed profiles obtained from field measurements and numerical simulations for the approaching wind in the W direction. (a) Coal transportation road; (b) large pit; (c) coal gangue area; (d) coal storage yard; (e) spoil area |
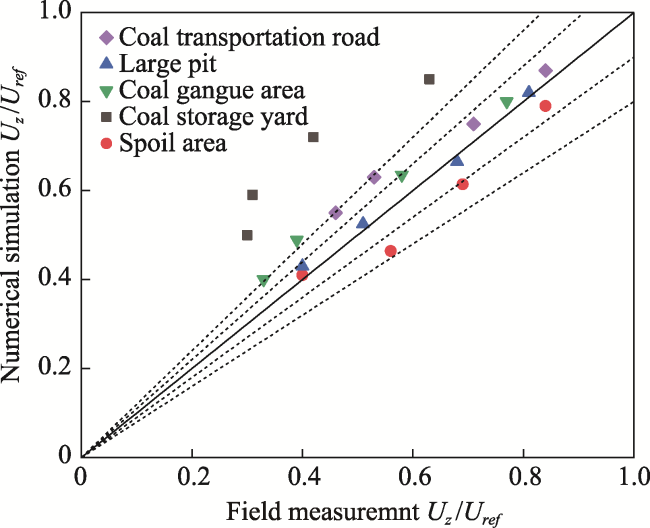
Fig. 10 Quantitative comparison of relative wind speeds between field measurements and numerical simulations for the approaching wind in the W direction |
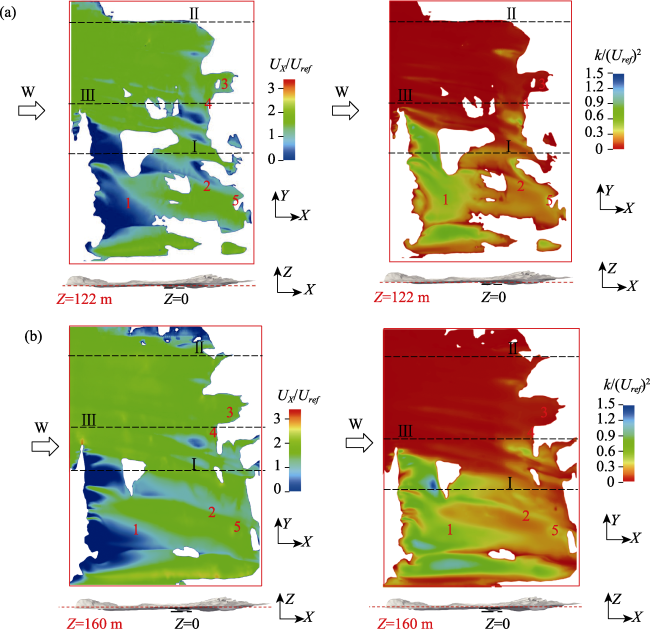
Fig. 11 Horizontal distributions of normalized mean wind speed and turbulence kinetic energy at different heights for the approaching wind in the W direction. (a) Z=122 m; (b) Z=160 mNote: The dashed lines denote the positions of vertical planes through locations I-III. Z=0 refers to the area with a relative elevation of 0 within the study area. Z=122 and Z=160 are the heights of the two selected cloud maps. |
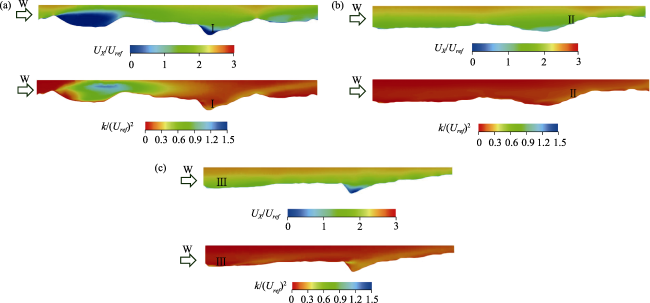
Fig. 12 Vertical distributions of the normalized mean wind speed and turbulence kinetic energy in the along-wind direction for the approaching wind in the W direction. (a) Location I; (b) Location II; (c) Location III |
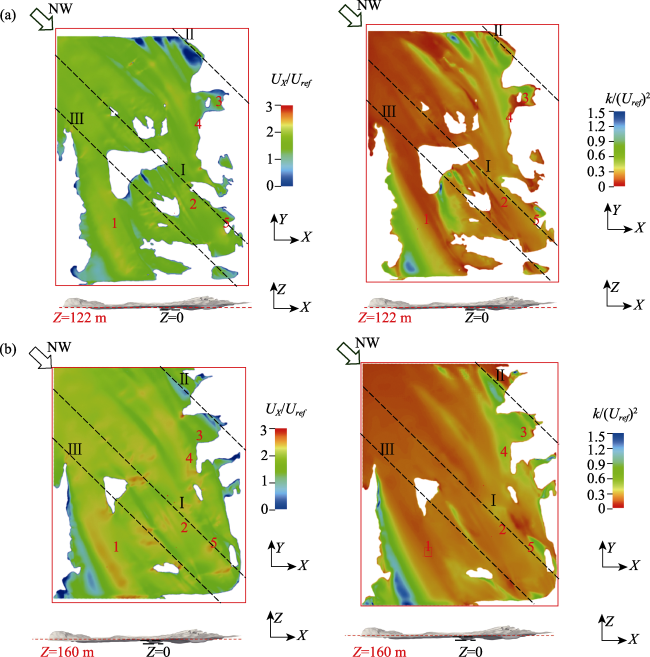
Fig. 13 Horizontal distributions of the normalized mean wind speed and turbulence kinetic energy at different heights for the approaching wind in the NW direction. (a) Z=122 m; (b) Z=160 mNote: The dashed lines denote the positions of vertical planes through locations I-III. Z=0 refers to the area with a relative elevation of 0 within the study area. Z=122 and Z=160 are the heights of the two selected cloud maps. |
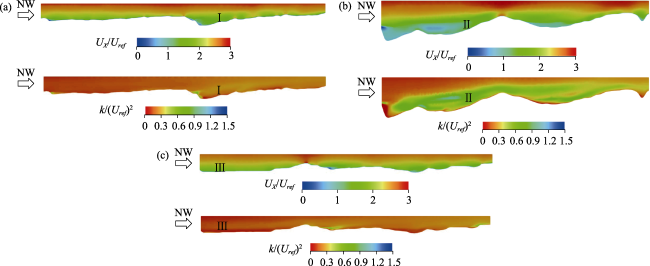
Fig. 14 Vertical distributions of the normalized mean wind speed and turbulence kinetic energy in the along-wind direction for the approaching wind in the NW direction. (a) Location I; (b) Location II; (c) Location III |
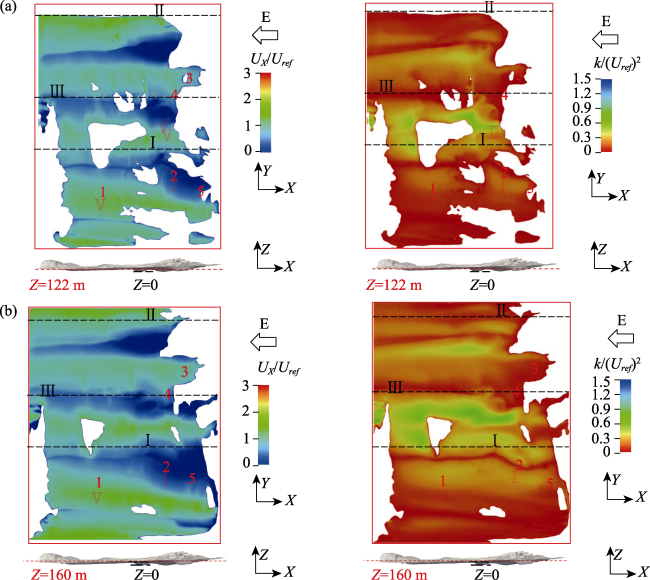
Fig. 15 Horizontal distributions of the normalized mean wind speed and turbulence kinetic energy at different heights for the approaching wind in the E direction. (a) Z=122 m; (b) Z=160 mNote: The dashed lines denote the positions of vertical planes through locations I-III. Z=0 refers to the area with a relative elevation of 0 within the study area. Z=122 and Z=160 are the heights of the two selected cloud maps. |
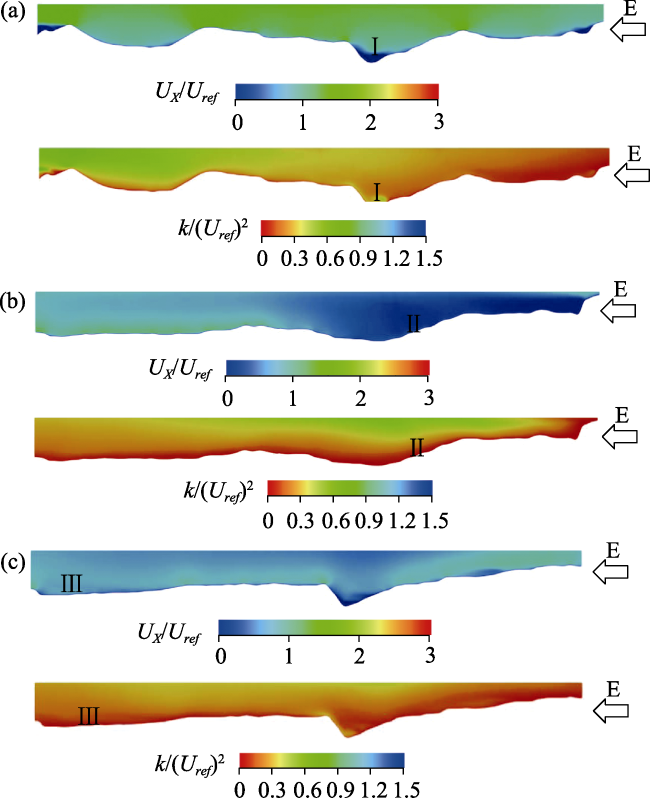
Fig. 16 Vertical distributions of the normalized mean wind speed and turbulence kinetic energy in the along-wind direction for the approaching wind in the E direction. (a) Location I; (b) Location II; (c) Location III |
| [1] |
|
| [2] |
|
| [3] |
|
| [4] |
|
| [5] |
|
| [6] |
|
| [7] |
|
| [8] |
|
| [9] |
|
| [10] |
|
| [11] |
|
| [12] |
|
| [13] |
|
| [14] |
|
| [15] |
|
| [16] |
|
| [17] |
|
| [18] |
|
| [19] |
|
| [20] |
|
| [21] |
|
| [22] |
|
/
| 〈 |
|
〉 |