
Journal of Resources and Ecology >
Dataset of Inland Waters Nitrogen Deposition in China (1990s-2010s)
|
LI Zhaoxi, E-mail: lizx.19s@igsnrr.ac.cn |
Received date: 2021-09-28
Accepted date: 2022-03-10
Online published: 2023-04-21
Supported by
The National Natural Science Foundation of China(41922003)
The National Natural Science Foundation of China(41871080)
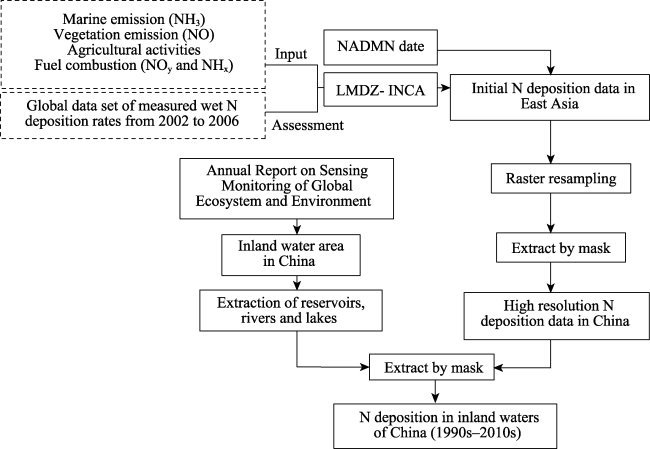
Dramatic increases in global atmospheric N deposition have had adverse effects on inland water ecosystems. China is one of the three hot spots of N deposition in the world. In order to fully understand the impact of N deposition on inland waters in China and formulate a reasonable water pollution treatment plan, we need to clearly quantify the N deposition flux in inland water. Therefore, using the LMDZ-OR-INCA model combined with inland water area data, we obtained the dataset of inland water N deposition in China from the 1990s to the 2010s, which lays a foundation for further understanding the spatial-temporal pattern of inland water N deposition and its impact mechanisms. At the same time, we publicly share this dataset and provide online access and download services at https://ecodb.scidb.cn/detail?dataSetId=892431070195089408.
Key words: N deposition; inland water; change of water area; LMDZ-OR-INCA model; China
LI Zhaoxi , ZHOU Feng , MIAO Chiyuan , SHI Kun , GAO Yang . Dataset of Inland Waters Nitrogen Deposition in China (1990s-2010s)[J]. Journal of Resources and Ecology, 2023 , 14(3) : 675 -680 . DOI: 10.5814/j.issn.1674-764x.2023.03.021
Table 1 Dataset profile |
| English title | Dataset of nitrogen deposition in inland waters of China (1990s-2010s) |
|---|---|
| First author | Li Zhaoxi (lizx.19s@igsnrr.ac.cn) |
| Corresponding author | Zhou Feng (zhouf@pku.edu.cn) Shi Kun (kshi@niglas.ac.cn) Gao Yang (gaoyang@igsnrr.ac.cn) |
| Data author(s) | Zhou Feng, Miao Chiyuan, Gao Yang |
| Foundation | The National Natural Science Foundation of China (41922003 and 41871080) |
| Time range | 1990s, 2000s and 2010s |
| Geographical scope | China (15.67°N-54.37°N, 71.25°E-136.55°E) |
| Spatial resolution | 0.01°×0.01° |
| Data volume | 600 M, 1.83 M after compression |
| Data format | *.tif |
| Data service system | http://ecodb.cern.ac.cn/api/sdb-journal-service/dataset/surl/IVRZ3a |
| Dataset composition | The dataset consists of six data files, including three for China N deposition data and three for inland water N deposition data. Unit: mg m-2 yr-1. Open with ArcGIS or MATLAB. |
Fig. 1 Flow chart for N deposition data processing of inland waters in China |
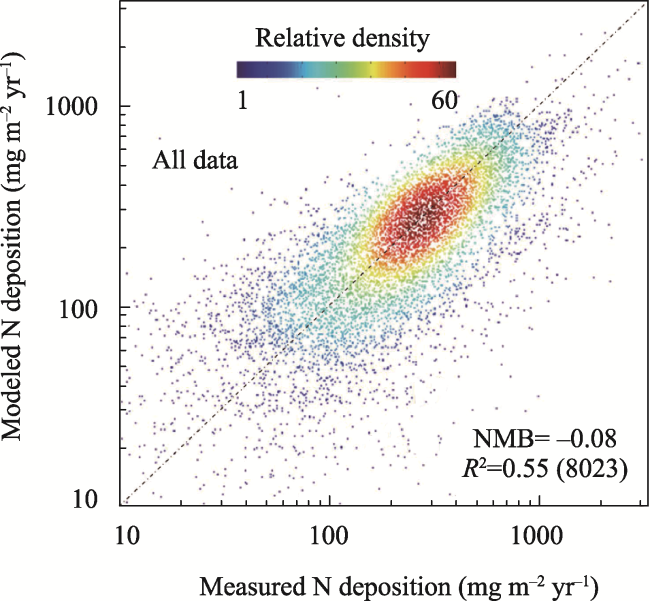
Fig. 2 The coefficient of correlation (R2) of log-transformed deposition rates |
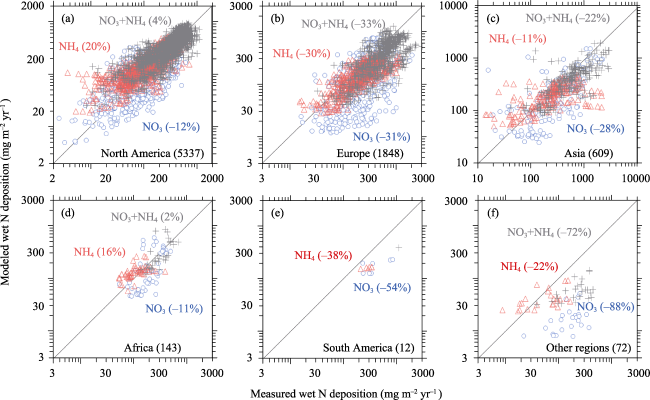
Fig. 3 Comparison of modeled and observed wet deposition of different forms of N in North America (a), Europe (b), Asia (c), Africa (d), South America (e) and other regions (f)Note: Data for measurements the total deposition of reduced and oxidized forms of N are shown as grey crosses. The percentages in brackets show the normalized mean bias of log-transformed deposition rates with the numbers of data points shown in brackets after each regional name. |
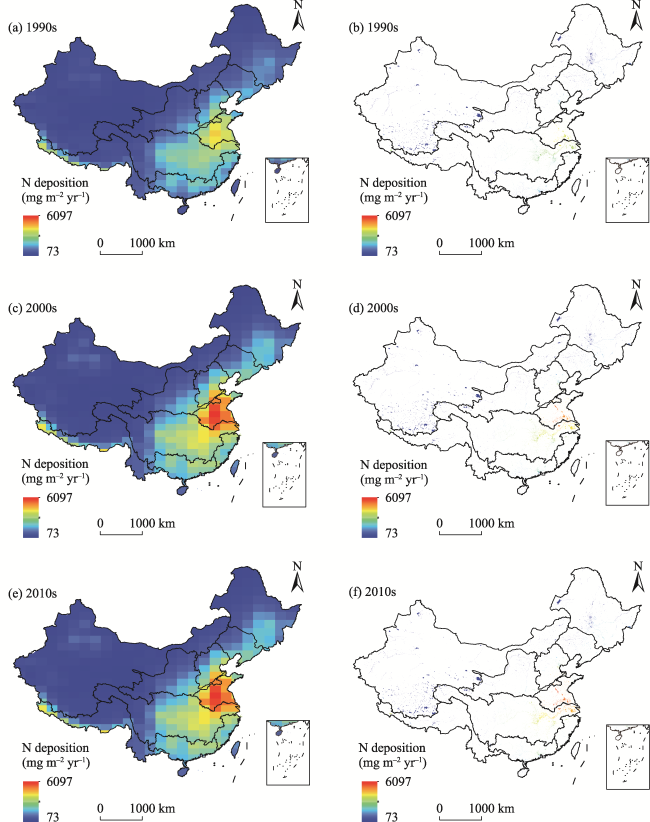
Fig. 4 N deposition in China (a, c, e) and inland waters (b, d, f) in the past three decades |
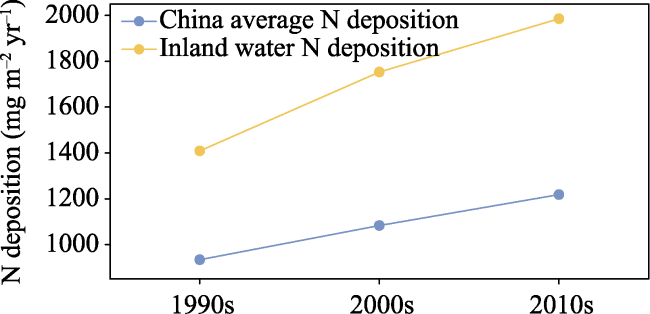
Fig. 5 Average N deposition and inland water N deposition in the past three decades in China |
| [1] |
|
| [2] |
|
| [3] |
|
| [4] |
|
| [5] |
|
| [6] |
|
| [7] |
|
| [8] |
|
| [9] |
|
| [10] |
|
| [11] |
|
| [12] |
|
| [13] |
|
| [14] |
|
| [15] |
|
| [16] |
|
| [17] |
|
| [18] |
|
| [19] |
|
| [20] |
|
/
| 〈 |
|
〉 |