
Journal of Resources and Ecology >
Study on the Evaluation and Optimization Strategy of Tourism Environmental Suitability in China based on the AHP-TOPSIS Algorithm
|
LI Ying, E-mail: liying20190063@bisu.edu.cn |
Received date: 2021-12-02
Accepted date: 2022-08-13
Online published: 2023-04-21
Supported by
The Beijing Social Science Fund(20GLC064)
The condition of the tourism environment is the key factor that affects the tourism experience. A comprehensive evaluation of the tourism environmental suitability score is of great significance for guiding tourism planning and decision-making, improving the suitability score of the tourism environment in a targeted manner and guaranteeing the sustainable development of tourist cities. By adopting various indicators, such as the Universal Thermal Climate Index, the amount of precipitation, the vegetation index, the concentration of fine particulate matter in the atmosphere, and the ultraviolet radiation intensity index, this study quantifies the comfort level of weather, the weather impacts, the vegetation status, the atmospheric environment, ultraviolet radiation, and other key factors. Based on employing the AHP-TOPSIS algorithm, this study then conducts a comprehensive evaluation of China’s tourism environmental suitability score and a comprehensive comparative analysis of the tourism environmental suitability scores of three typical tourist areas: the Beijing-Tianjin-Tangshan area, the Yangtze River Delta and the Pearl River Delta. The results show that the tourism environmental suitability score in China has obvious characteristics of spatial differentiation: the scores in East and South China are the highest while the score in the northwest inland area is the lowest. Among the three typical tourist areas, the Pearl River Delta region has the highest tourism environmental suitability score, followed by the Yangtze River Delta region, and the Beijing-Tianjin-Tangshan region has the lowest score. The northern regions of the Beijing-Tianjin-Tangshan area, the southern regions of the Yangtze River Delta and the surrounding areas of the Pearl River Delta are more suitable for the sustainable development of the tourism industry. PM2.5 is the main factor limiting the tourism environmental suitability scores in the Beijing-Tianjin-Tangshan area and the Yangtze River Delta, so atmospheric environment management will be an effective way to improve their tourism environmental suitability scores.
LI Ying , WANG Yiran , ZOU Tongqian . Study on the Evaluation and Optimization Strategy of Tourism Environmental Suitability in China based on the AHP-TOPSIS Algorithm[J]. Journal of Resources and Ecology, 2023 , 14(3) : 631 -643 . DOI: 10.5814/j.issn.1674-764x.2023.03.017
Table 1 Tourism environmental suitability index system |
| Target layer | Criterion layer | Index layer | Index interpretation | Sources | |
|---|---|---|---|---|---|
| Tourism environmental suitability | Weather conditions | Universal Thermal Climate Index | Used to characterize the thermal stress state and comfort degree of the human body under outdoor environmental conditions | Ge et al., 2017 | |
| Total Precipitation | Used to characterize the influence of adverse weather factors on tourism | Lise and Tol, 2002; Day et al., 2013 | |||
| Vegetation status | Vegetation Index | High Vegetation Leaf Area Index | Mainly simulates the growth of shrubs, trees and other vegetation | Kamal et al., 2016 | |
| Low Vegetation Leaf Area Index | Mainly simulates the coverage degree of grassland and similar vegetation | Kamal et al., 2016 | |||
| Health effects | Particulate matter with a diameter of no more than 2.5 micrometers | Used to characterize the influence and damage degree of ultraviolet radiation on the skin | Yu et al., 2014; Li et al., 2021 | ||
| Downward UV radiation at the surface | Adopted to reflect the air pollution factors in the tourism environment | Lim et al., 2012 | |||
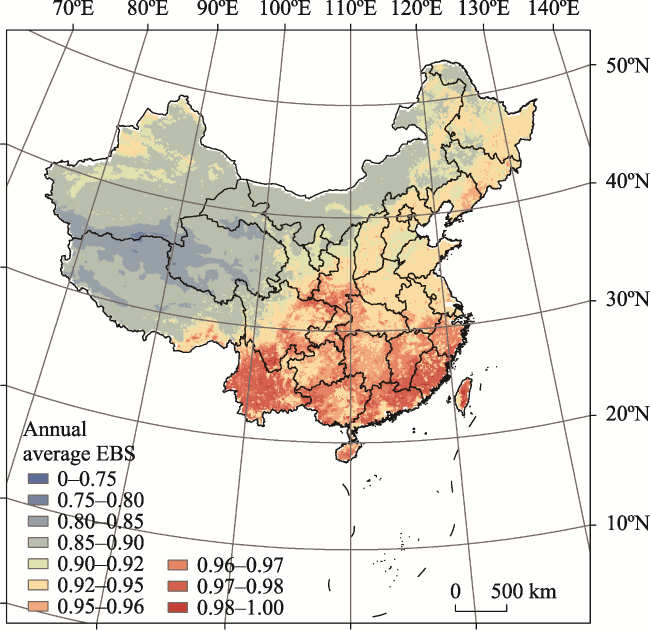
Fig. 1 Spatial distribution of annual average tourism environmental suitability scores in China in 2019 |
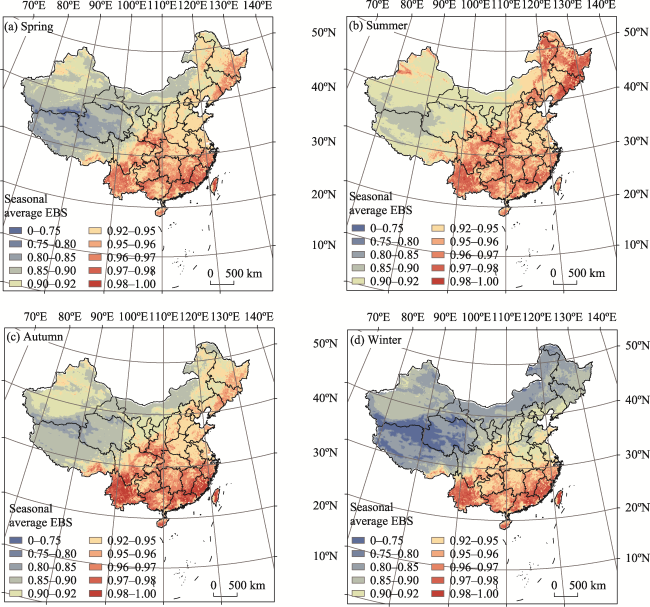
Fig. 2 Spatial distribution of seasonal average tourism environmental suitability China in 2019 |
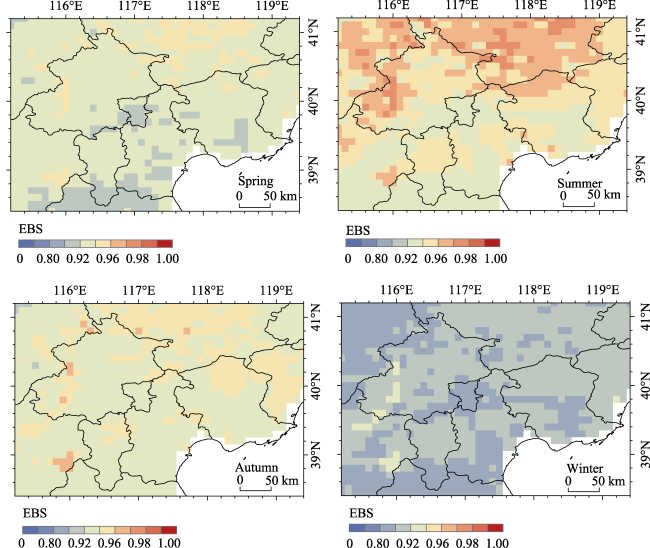
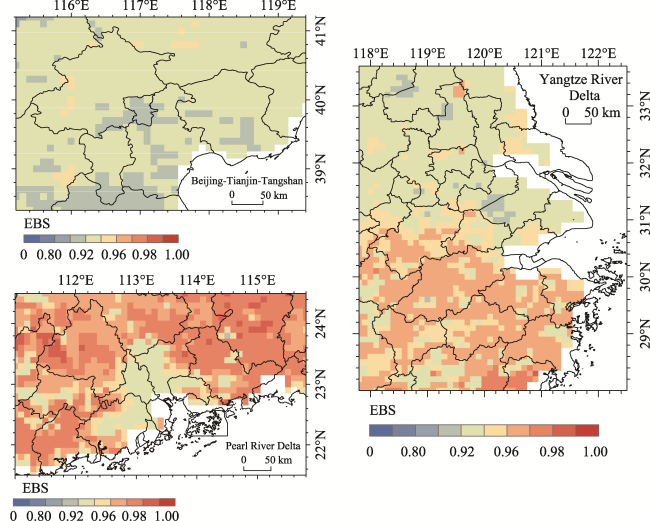
Fig. 3 Spatial distribution of seasonal average tourism environmental suitability scores in the Beijing-Tianjin-Tangshan typical tourism area |
Fig. 4 Spatial distribution of seasonal average tourism environmental suitability scores in the typical tourist area of the Yangtze River Delta in 2019 |
Fig. 5 Spatial distribution of seasonal mean tourism environmental suitability scores in the typical tourist area of the Pearl River Delta in 2019 |
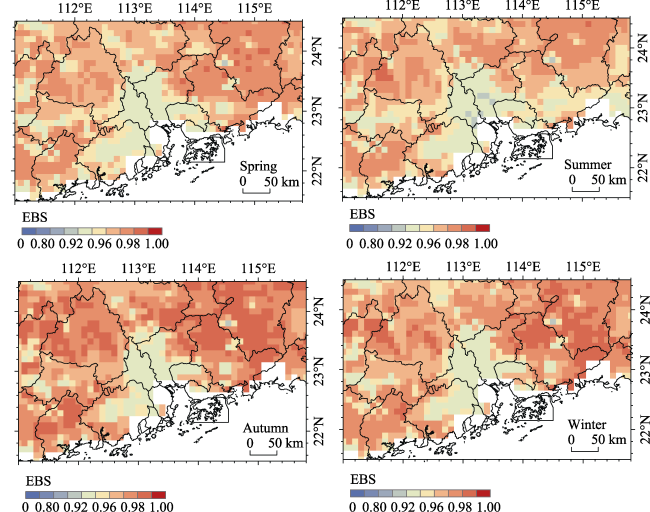
Fig. 6 Spatial distribution of annual average tourist environmental suitability scores in the typical tourist areas of the Beijing-Tianjin-Tangshan area, the Yangtze River Delta and the Pearl River Delta in 2019 |
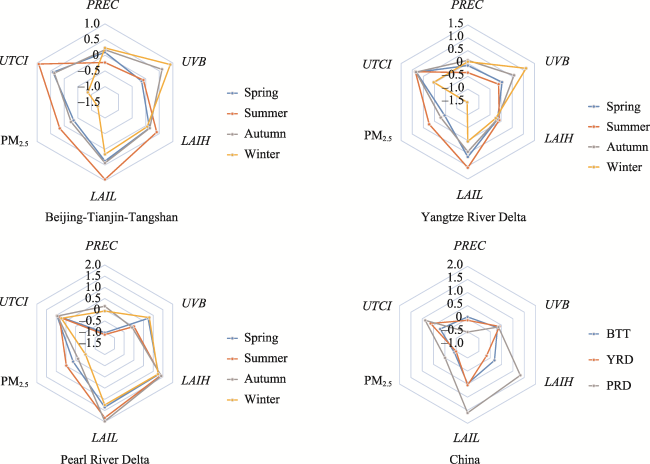
Fig. 7 Analysis of the factors driving tourism environmental suitability for 2019 in the typical tourist areas of the Beijing-Tianjin-Tangshan area, the Yangtze River Delta and the Pearl River DeltaNote: BTT represents the Beijing-Tianjin-Tangshan area; YRD represents the Yangtze River Delta; and PRD represents the Pearl River Delta. |
This article was supported by a grant from the State Key Laboratory of Resources and Environmental Information System, Chinese Academy of Science. We also want to express our sincere gratitude to the anonymous reviews and editors for their efforts in the improvement of the manuscript.
| [1] |
Ayhan Ç K,
|
| [2] |
|
| [3] |
|
| [4] |
|
| [5] |
|
| [6] |
|
| [7] |
|
| [8] |
|
| [9] |
|
| [10] |
|
| [11] |
|
| [12] |
|
| [13] |
|
| [14] |
|
| [15] |
|
| [16] |
|
| [17] |
|
| [18] |
|
| [19] |
|
| [20] |
|
| [21] |
|
| [22] |
|
| [23] |
|
| [24] |
|
| [25] |
|
| [26] |
|
| [27] |
|
| [28] |
|
| [29] |
|
| [30] |
|
| [31] |
|
| [32] |
|
| [33] |
|
| [34] |
|
/
| 〈 |
|
〉 |
