Plant and Animal Ecology

Diet Analysis of Asian Elephants Using Next-Generation Sequencing

  • PENG Xiaoxu , 1 ,
  • SUN Yakuan 1 ,
  • CHEN Ying 1, 2 ,
  • Aliana NORRIS 1 ,
  • SHI Kun , 1, 3, *
Expand
  • 1. Wildlife Institute, School of Ecology and Nature Conservation, Beijing Forestry University, Beijing 100083, China
  • 2. School of Biological Sciences, The University of Hong Kong, Hong Kong 999077, China
  • 3. Eco-Bridge Continental, Beijing 100085, China
*SHI Kun, E-mail:

PENG Xiaoxu, E-mail:

Received date: 2022-05-26

  Accepted date: 2022-08-09

  Online published: 2023-04-21

Supported by

The Pilot Study on Habitat Modification of Asian Elephants(20210126)

Abstract

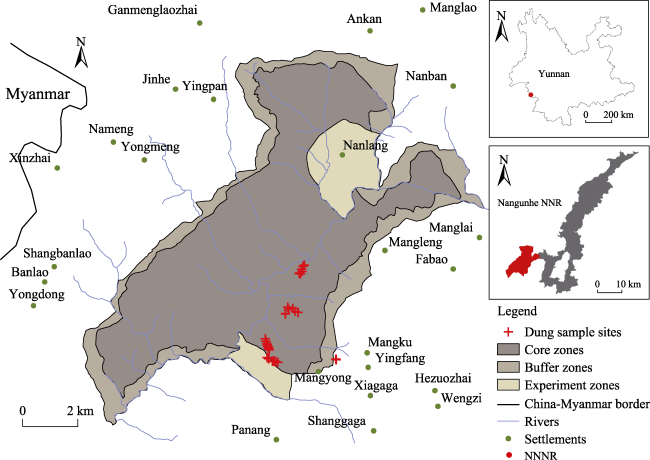
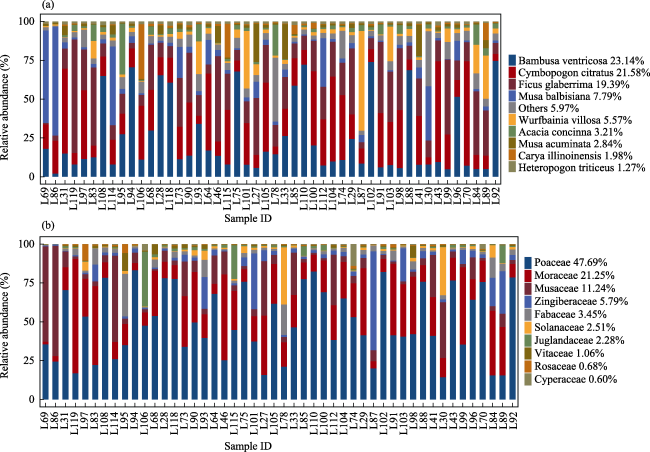
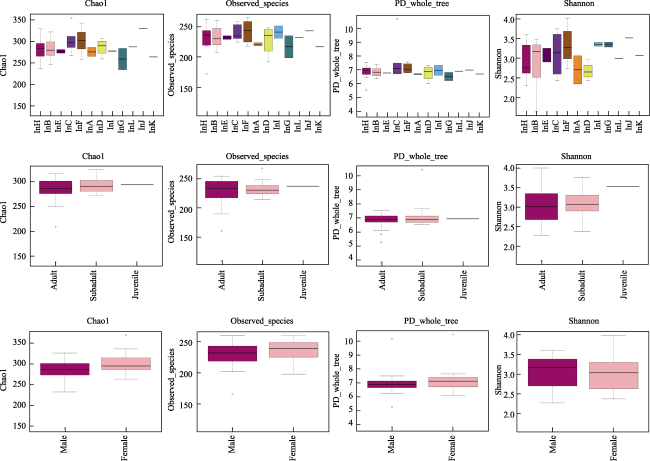
Understanding the diet composition and preferences of large herbivores not only provides insights into their ecological role, but also helps to assess the viability of elephant populations and their habitats. This study was performed to determine the diet preferences of a small population of Asian elephants in Nangunhe National Nature Reserve in Yunnan, China, during the annual dry season. The next-generation sequencing of the rbcL gene from non-invasively collected fecal samples was conducted in addition to transect surveys and camera-trapping along known elephant trails. With the transect survey, we identified 31 plant species foraged by elephants. The next-generation sequencing analysis identified a total of 90 plant species from the elephant dung samples. Only nine species were detected at rates greater than 1% in all the samples. Poaceae (47.69%), Moraceae (21.25%), and Musaceae (11.24%) were detected to have the highest rates at the family level. We also examined whether differences existed between sexes, age groups, and individuals; however, significant differences were found only between individuals. This study provides useful insights into the foraging preferences of Asian elephants, which could help in further understanding the interactions between elephants and their habitat in the reserve and inform future management decisions in related areas. The detected core plant species with relatively high abundance could provide guidance for habitat restoration and cultivation of food bases. The local plantations where the elephants prefer to feed could be moved farther away, making them inaccessible to the elephants.

Cite this article

PENG Xiaoxu , SUN Yakuan , CHEN Ying , Aliana NORRIS , SHI Kun . Diet Analysis of Asian Elephants Using Next-Generation Sequencing[J]. Journal of Resources and Ecology, 2023 , 14(3) : 616 -630 . DOI: 10.5814/j.issn.1674-764x.2023.03.016

1 Introduction

The diet preferences of certain elephant species must be comprehensively understood to ascertain their ecological relevance, especially for large rainforest herbivores regarded as ecosystem engineers (Waldram et al., 2008; Hayes and Schradin, 2017). Particularly, Asian elephant (Elephas maximus), an endangered and keystone species in the ecosystem, consume substantial amounts of vegetation for sufficient nutrients because of their large body mass. To a great extent, Asian elephants affect the environment through their foraging behaviours; for example, they pull down trees, eat fruits and defecate the seeds, create space and food for other animals, and promote seed dispersal and germination (Campos-Arceiz and Blake, 2011; Lin and Zhang, 2018). The foraging preferences of Asian elephants vary with locations according to the available plant species (Campos-Arceiz et al., 2008; Joshi and Singh, 2008; Roy, 2009). Globally, the diet of the elephant species typically comprises Fabaceae, Poaceae, Cyperaceae, Palmae, Euphorbiaceae, Rhamnaceae, and Malvales (Sukumar, 2003). In China, Asian elephants are only distributed in Yunnan Province and mostly feed on Gramineae, Fabaceae, Moraceae, Palmae, and Rosaceae (Jiang et al., 2019).
Increased human activity has caused severe habitat fragmentation and a decline in habitat quality, leading to a lower environmental carrying capacity for elephants, which is detrimental to their population growth and long-term viability (Zhang et al., 2015; Chen et al., 2022a). Over the last four decades, the Asian elephant habitat in southwest Yunnan has been severely fragmented and reduced, which is a result of the rubber and tea plantations as well as urban expansion in the area (Liu et al., 2017; Wei, 2019; Chen et al., 2022a). This phenomenon has resulted in the scarcity of natural food resources and an increased possibility of human-elephant contact and conflicts, as the elephants feed on rice, wheat, corn, and banana, thereby causing economic losses and occasional human harm (Zhang and Wang, 2003; Zhang, 2005; Sukumar, 2006). Recently, the international attention has been drawn to a herd of 15 elephants that migrated for almost 800 km from Xishuangbanna National Nature Reserve to Kunming, Yunnan (Campos-Arceiz et al., 2021). This occurrence may have been caused by insufficient food resources, an increase in elephant population, and habitat degradation (Wang et al., 2021). Habitat fragmentation has also resulted in separate, isolated small populations, such as a group of approximately 20 elephants in Nangunhe National Nature Reserve (NNNR), Yunnan, China, which shows a distinct differentiation and has had no gene exchange with other populations in China for the past 30 years (Yang and Zhang, 2012; Zhang, 2018; Chen et al., 2022b). In addition, agricultural activities have caused nearly total deforestation along the Sino-Burmese border, rendering this group functionally isolated from other elephant herds in Myanmar (Feng et al., 2010). The expansion of rubber plantations, which are the predominant land-use transformation, has caused severe habitat loss and inhibited interactions between different habitats in the Nangunhe River Basin (Wei, 2019; Chen et al., 2022b). The optimal and relatively suitable habitat in Lincang County (188.45 km2), where NNNR is located, is smaller than that in Pu'er (983.64 km2) and Xishuangbanna (2918.1 km2) Counties, and the suitable habitat in NNNR (29.01 km2) is much smaller than the predicted Asian elephant home range size, which exceeds 100 km2 (Jathanna et al., 2015; Liu et al., 2016). However, marginal habitats account for a relatively large area of 817.26 km2 (83.9% forest, 6.94% tree plantations, 6.37% shrub, and 2.80% farmland), 2909.48 km2, and 2589.3 km2 for Lincang, Pu'er, and Xishuangbanna Counties, respectively (Liu et al., 2016). Therefore, increasing the quality and availability of marginal habitats while improving their interactions with optimal habitats can be a viable approach to Asian elephant management and conservation. Food availability is the most critical factor affecting habitat selection and activities of the Asian elephant (Qin, 2007; Feng et al., 2010; Liu et al., 2016). Therefore, a better understanding the elephant's diet can provide a better and informed management guide for habitat maintenance and restoration.
Previous studies on Asian elephant diet have been conducted using tracking and direct observation, feeding sign on food trails, and micro-histological fecal analysis methods (Sukumar, 1990; Chen et al., 2006; Borah and Deka, 2008; Koirala et al., 2016). Combining these methods provides valuable insights but cannot provide quantified results, and important details might be missed (Pompanon et al., 2012). Conventional methods for investigating diet are labor-intensive and dependent on the ability of observers to identify species. Moreover, it is difficult to identify plant species that decompose without leaving visible fragments after digestion (Pompanon et al., 2012). Molecular technologies, such as DNA barcoding and next-generation sequencing (NGS), present new opportunities for researchers. These technologies have been used for studying the diet of both carnivores and herbivores (García-Robledo et al., 2013; Srivathsan et al., 2016; Xiong et al., 2017). Compared with traditional methods, these technologies can better detect numerous plant species (Soininen et al., 2009; Ando et al., 2013) even when only microscopic fragments are present. Furthermore, the technologies would make it possible to obtain quantified results and present specific information on the diet preferences of Asian elephants with a better resolution.
This study aimed to fill the knowledge gap of quantified data on diet composition and preferences of a unique Asian elephant population in NNNR. We hypothesized that the diet composition of the elephant population would vary by sex, age, and individual because of their distinct physiology and foraging habits, which has been observed in some African and other Asian elephant populations (Shannon et al., 2006; Woolley et al., 2011; Srinivasaiah et al., 2012). The findings of this study will provide vital data for future habitat management and restoration activities to better support the population while providing a reproducible method for studying other elephant or herbivore populations.

2 Materials and methods

2.1 Study area

The study was conducted in NNNR, southwest of Yunnan Province, China. NNNR encompasses 508.87 km2 of the natural forest at the China-Myanmar border. This is the only remaining habitat for Asian elephants in China and supports a population of a unique, divergent β clade classified through previous mtDNA analyses (Zhang et al., 2015). This study focused on the southwestern portion of NNNR in Cangyuan County (23°13′-23°18′N, 98°54′-99°04′E), the only remaining activity area for this small isolated elephant population (Fig. 1) (Bohnett et al., 2015). The study area is in a typical southwest monsoon climate zone with distinctly dry (November to April) and rainy (May to October) seasons. The mean annual temperature is 9.6-22.8 ℃, and the annual precipitation is 1280-2590 mm, both varying considerably with increasing altitude. The Nangunhe (NGH) River Basin has a northern tropical humid climate dominated by natural tropical and monsoon forests (<600 m; Liu et al., 2016). Mid altitude areas with 600-1700 m elevations have a southern humid subtropical climate dominated by subtropical monsoon broad-leaf evergreen forests. The region above 1700 m has a humid mid-subtropical climate rich in evergreen vegetation (Ling, 2007; Limin et al., 2010). Overall, the favorable climate, abundant sunlight, and rich rainfall sustain numerous plant species. The study area is surrounded by villages and intensively farmed land, most of which are used for cash trees and crops.
Fig. 1 Nangunhe National Nature Reserve (NNNR) map with dung sample sites

Note: Camera sites refer to Sun et al. (2021).

2.2 Transects survey

This study was conducted from February to April, 2018. The Asian elephant population is small and elusive, making direct tracking difficult. Therefore, a transect survey was conducted on known elephant trails by recording plant traces and feeding sites. We also captured videos of their foraging habits using 52 infra-red camera-traps (Sun et al., 2021) and made 5 m-radius quadrats using camera-traps as center points. Additionally, we took photographs of plants surrounding the cameras for identification, with the help of experts and a reference to Flora Reipublicae Popularis Sinicae (Editorial Committee of FRPS, 1993) and Flora of China (Luo et al., 2013).

2.3 Sample collection

We collected fresh (within 48 h) and relatively fresh (within 2 weeks) dung piles in labelled plastic bags for diet analysis. The dung piles were kept in a cool, dark environment and then transported to the lab and frozen in a -20℃ freezer. The researchers wore masks and clean gloves while obtaining each sample and destroyed residual dung piles after collection to avoid contamination. The repeated sampling of fecal samples were homogenized; approximately 2 g of each sample was placed into 2-mL centrifuge tubes and then transported to the sequencing company on ice. The biological characteristics of each fecal sample, including sex, age, and individual, were obtained by conducting a paralleled study (Chen et al., 2022b). The sex was determined by amplifying X- and Y-specific fragments, and the age was estimated by measuring the circumferences of the three largest dung boluses of each dung pile. Elephant individuals were distinguished by identifying unique genotypes. The 48 samples collected belonged to a group of 12 individuals comprising 7 males and 5 females, of which 6 were adult, 5 subadult, and 1 juvenile (Table 1) (Chen et al., 2022b).
Table 1 Demographic information of Asian elephant population in NNNR (Chen et al., 2022b)
Individual Sex Age
InA Female Subadult
InB Female Adult
InC Female Subadult
InD Female Adult
InE Male Subadult
InF Female Adult
InG Male Adult
InH Male Adult
InI Male Subadult
InJ Male Juvenile
InK Male Subadult
InL Male Subadult

2.4 DNA extraction and next-generation sequencing

We partnered with Allwegene Company (Beijing, China) to process the samples and conduct next-generation sequencing. DNA was extracted from fecal samples using E.Z.N.A.® Stool DNA Kit (Omega Bio-Tek, USA) according to the manufacturer's instructions. We conducted polymerase chain reaction (PCR) amplification of the rbcL gene (379 bp) using a pair of universal primers (Forward 5'-CTTACCAGYCTTGATCGTTACAAAGG-3', Reverse 5'-GTAAAATCAAGTCCACCRCG-3' (Kress and Erickson, 2007)) with barcode because of the high universality and good discerning power of the technique (COBL Plant Working Group, 2009). The PCR was conducted thrice for each sample. Replicates from each sample were verified using 2% of agarose gel electrophoresis. PCR amplification was performed using 25 μL reaction volumes comprising 12.5 μL 2 × Taq PCR MasterMix, 3 μL BSA (2 ng μL-1), 2 μL Primers (5 uM), 2 μL template DNA, and 5.5 μL ddH2O, following the procedure of 94℃ for 5 min; 35 cycles of 94 ℃ for 30 s, 55 ℃ for 30 s, 72 ℃ for 1 min; and then followed by 72 ℃ for 7 min. PCR products were purified using a QIAquick Gel Extraction Kit (QIAGEN, Germany). Deep sequencing was performed on the Miseq platform at Allwegene Company, Beijing, China. Image analysis, base calling, and error estimation were performed using Illumina Analysis Pipeline (Version 2.6).

2.5 Data analysis

To obtain qualified data from the analysis, the raw data were first screened; we excluded sequences that were shorter than 200 bp, had low quality scores (≤20), contained ambiguous bases, or did not match the primer sequences and barcode tags. Qualified reads were separated using the sample- specific barcode sequences and trimmed with the Illumina Analysis Pipeline (Version 2.6). Subsequently, the dataset was analyzed using QIIME (Caporaso et al., 2010). We chose 97% similarity (Stackebrandt and Goebel, 1994) as the threshold to cluster the sequences into operational taxonomic units (OTUs). The relative abundance was calculated according to the number of sequences assigned to the OTUs. The sequences were compared with the rbcL nucleotide database from GenBank; the OTUs assigned to bacteria were excluded for subsequent analysis. According to the OTU clustering results, Shannon values under different random sampling methods were calculated using mothur (Schloss et al., 2009). Multi-sample Shannon-Wiener, species accumulation, and rank abundance curves were plotted using R (RStudio Team, 2020). We estimated the alpha diversity with the Chao1 index for richness; observed species for sequencing depth, phylogenetic diversity (PD) whole tree index, and Shannon index for diversity using QIIME; and generated box plots (Caporaso et al., 2010). To examine the differences between ages, sexes, and individuals, clustering and non-metric multidimensional scaling (NMDS) analyses were used according to the OTU results. A one-way analysis of similarity (ANOSIM) was used to determine the statistical significance with 999 permutations using R (RStudio Team, 2020). As a comprehensive local database was unavailable, we searched all identified species on multiple databases to ensure identification validity, including Flora Reipublicae Popularis Sinicae (FRPS, 2005), Chinese Virtual Herbarium (CVH, 2003), The Plant List (Royal Botanic Garden, 2013), Tropicos (Missouri Botanical Garden, 2012), and Plants of the World Online (POWO, 2019). Additionally, we used 100% appearance of plant species across all samples as the definition of “core species” by applying the “core microbiome” concept widely adopted in microbiome research (Hernandez-Agreda et al., 2017).

3 Results

3.1 Overall description of next-generation sequences

We initially collected 54 elephant dung pile samples but used only 48 samples for sequencing. Six samples were not viable for the analysis because of their low quality. The sequencing run yielded 2327565 clean tags after exclusions and was assigned to 388 OTUs in total with a distribution of 113-271 OTUs among all samples (mean is approximately equal to 236). The species accumulation curve reached an asymptote, indicating that additional fecal samples would not provide more information (Fig. 2a). The Shannon-Wiener curve tends to flatten out, suggesting that the sequencing data volume was enough for information about the most foraged and abundant species (Fig. 2b). The rank abundance curves suggest a relatively low diversity in the diet composition of the NGH Asian elephant population (Fig. 2c).
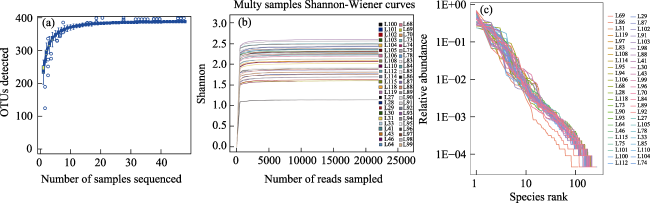
Fig. 2 Overall description of NGS sequencing results

Note: (a) Species accumulation curve; (b) Shannon-Wiener curve, indicating the sample size and sampled reads are sufficient for subsequent analysis; (c) Rank abundance curve identifying abundant species.

3.2 Taxonomic results

We recorded 32 plant species foraged by Asian elephants through 41 transects in NNNR. Furthermore, 90 species were detected through NGS (Table 2); 5.97% were classified as unidentified sequences and assigned to an “others” category, and the remaining 94.03% were successfully identified at species level. A list of 117 plant species was generated in total, combined with the transect survey results (Table 1). The three most abundant species detected were buddha bamboo (Bambusa ventricosa), lemon grass (Cymbopogon citratus), and Ficus glaberrima, accounting for 23.14%, 21.58%, and 19.39% of the samples, respectively, with no other species comprising above 10% of the total sample. Only nine species, including the three most abundant listed above, showed relative abundance above 1%, accounting for 86.78% of all reads across all samples. At the family level, Poaceae (47.04%), Moraceae (20.31%), Musaceae (11.02%), Zingiberaceae (5.75%), Fabaceae (3.24%), Juglandaceae (2.19%), and Vitaceae (1.07%) were the most abundant (Fig. 3). We also detected several crop plant species, such as Tavoy cardamom (Wurfbainia villosa, 5.57%) and pecan (Carya illinoinensis, 1.98%), which had greater proportions along with some other species of lower proportions, such as rice (Oryza sativa, 0.06%), tomato (Solanum lycopersicum, 0.06%), wheat (Triticum aestivum, 0.05%), peanut (Arachis hypogaea), and corn (Zea mays).
Table 2 Taxonomic classification of 117 plant species foraged by Asian elephant in NNNR
Categories Family Genus Species Method
Equisetophyta
Equisetopsida
Poales Poaceae Bambusa Bambusa ventricosa McClure * NGS
Bambusa vulgaris Schrader ex Wendland 'Wamin' * NGS
Cymbopogon Cymbopogon citratus (DC.) Stapf * NGS
Heteropogon Heteropogon triticeus (R. Br.) Stapf ex Craib. * NGS
Panicum Panicum incomtum Trin. * NGS
Panicum miliaceum L. * NGS
Oryza Oryza rufipogon Griff. * NGS
Oryza sativa L. NGS
Thysanolaena Thysanolaena latifolia (Roxb. ex Hornem.) Honda NGS
Setaria Setaria palmifolia (Koen.) Stapf NGS
Setaria faberi R.A.W.Herrm. * NGS
Dichanthium Dichanthium annulatum (Forssk.) Stapf * NGS
Dendrocalamus Dendrocalamus giganteus Munro NGS
Dendrocalamus membranaceus Munro TS
Dendrocalamus semiscandens Hsueh et D. Z. Li * TS
Triticum Triticum aestivum L. NGS
Chrysopogon Chrysopogon zizanioides (L.) Roberty * NGS
Phragmites Phragmites australis (Cav.) Trin. ex Steud. NGS
Garnotia Garnotia tenella (Arn. ex Miq.) Janowski * NGS
Zea Zea mays L. NGS
Microstegium Microstegium vimineum (Trin.) A. Camus * TS
Cyperaceae Scleria Scleria parvula Steud. * NGS
Machaerina Machaerina rubiginosa (Biehler) T.Koyama * NGS
Magnoliopsida
Rosales Moraceae Ficus Ficus glaberrima Bl. * NGS
Ficus tinctoria Forst. NGS
Ficus hirta Vahl NGS
Ficus chapaensis Gagnep. * TS
Ficus racemosa L. TS
Ficus auriculata Lour. TS
Streblus Streblus indicus (Bur.) Corner * NGS
Broussonetia Broussonetia papyrifera (Linn.) L'Hér. ex Vent. NGS
Morus Morus alba L. NGS
Morus macroura Miq. * TS
Artocarpus Artocarpus lakoocha Roxburgh TS
Artocarpus pithecogallus C. Y. Wu * TS
Rosaceae Rubus Rubus lambertianus Ser. * NGS
Rubus pluribracteatus L.T.Lu & Boufford NGS, TS
Rubus pungens Cambess. * NGS
Prunus Prunus mira Koehne * NGS
Urticaceae Debregeasia Debregeasia orientalis C. J. Chen * NGS
Cannabaceae Trema Trema orientale (L.) Blume * NGS
Humulus Humulus scandens (Lour.) Merr. * NGS
Rhamnaceae Berchemia Berchemia floribunda (Wall.) Brongn. * NGS
Zingiberales Musaceae Musa Musa balbisiana Colla * NGS
Musa itinerans Cheesm. NGS, TS
Musa acuminata Colla NGS
Ensete Ensete glaucum (Roxb.) Cheesm. NGS
Sorghum Sorghum×drummondii (Nees ex Steud.) Millsp. & Chase * NGS
Zingiberaceae Wurfbainia Wurfbainia villosa (Lour.) * NGS
Alpinia Alpinia galanga (L.) Willd. * NGS
Marantaceae Donax Donax canniformis (Forst.) K. Schum. * NGS
Fabales Fabaceae Acacia Acacia concinna (Willd.) DC. * NGS
Acacia pennata (L.) Willd. TS
Pueraria Pueraria montana (Lour.) Merr. NGS
Bauhinia Bauhinia touranensis Gagnep. * NGS
Bauhinia acuminate L. TS
Senegalia Senegalia catechu (L.f.) P.J.H.Hurter & Mabb. * NGS
Mucuna Mucuna pruriens (L.) DC. * NGS
Arachis Arachis hypogaea Linn.bam * NGS
Albizia Albizia crassiramea Lace * TS
Fagales Juglandaceae Carya Carya illinoiensis K. Koch * NGS
Carya illinoiensis K. Koch * NGS
Fagaceae Castanea Castanea seguinii Dode * NGS
Quercus Quercus baronii Skan * NGS
Castanopsis Castanopsis indica (Roxburgh ex Lindley) A. DC. * TS
Vitales Vitaceae Tetrastigma Tetrastigma subtetragonum C. L. Li * NGS
Tetrastigma delavayi Gagnep. * NGS
Tetrastigma planicaule (Hook.) Gagnep. NGS, TS
Tetrastigma tsaianum C. Y. Wu * NGS
Leea Leea indica (Burm. f.) Merr. NGS
Cucurbitales Begoniaceae Begonia Begonia palmata D. Don * NGS
Begonia masoniana Irmsch. ex Ziesenh. * NGS
Cucurbitaceae Hodgsonia Hodgsonia macrocarpa (Bl.) Cogn. * NGS
Gynostemma Gynostemma pentaphyllum (Thunb.) Makino * NGS
Ranunculales Menispermaceae Tinospora Tinospora crispa (L.) Hook. f. et Thomson * NGS
Parabaena Parabaena sagittata Miers ex Hook.f. & Thomson NGS
Brassicales Brassicaceae Arabidopsis Arabidopsis thaliana (L.) Heynh. * NGS
Icacinales Icacinaceae Iodes Iodes cirrhosa Turcz. * NGS
Arecales Arecaceae Caryota Caryota maxima Blume * NGS, TS
Caryota obtusa Griffith TS
Salacca Salacca zalacca (Gaertn.) Voss * NGS
Calamus Calamus gracilis Roxb. * NGS
Calamus nambariensis Becc. NGS
Laurales Lauraceae Cinnamomum Cinnamomum verum Presl * NGS
Cinnamomum parthenoxylon (Jack) Meisn. * NGS
Phoebe Phoebe puwenensis Cheng * TS
Asparagales Hypoxidaceae Curculigo Curculigo capitulata (Lour.) Ktze. NGS
Orchidaceae Thrixspermum Thrixspermum japonicum (Miq.) Rchb. f. * NGS
Cornales Nyssaceae Nyssa Nyssa yunnanensis W. C. Yin * NGS
Camptotheca Camptotheca acuminata Decne. * NGS
Quercus Quercus baronii Skan * NGS
Solanales Solanaceae Solanum Solanum lycopersicum L. * NGS
Convolvulaceae Ipomoea Ipomoea sumatrana (Miq.) Ooststr. * NGS
Caryophyllales Polygonaceae Persicaria Persicaria chinensis (L.) H.Gross * NGS
Persicaria runcinata (Buch.-Ham. ex D.Don) H.Gross * NGS
Liliales Smilacaceae Smilax Smilax china L. * NGS
Smilax ocreata A.DC. NGS
Ericales Theaceae Camellia Camellia oleifera Abel.c * NGS
Apiales Araliaceae Trevesia Trevesia palmata (Roxb. ex Lindl.) Vis. NGS
Aralia Aralia thomsonii Seem. TS
Malvales Malvaceae Kleinhovia Kleinhovia hospita L. * NGS
Sterculia Sterculia lanceolata Cav. * TS
Lamiales Orobanchaceae Rehmannia Rehmannia glutinosa (Gaetn.) Libosch. ex Fisch. et Mey. * NGS
Lamiaceae Gmelina Gmelina arborea Roxb. * TS
Malpighiales Clusiaceae Garcinia Garcinia xipshuanbannaensis Y. H. Li * NGS
Phyllanthaceae Aporosa Aporosa yunnanensis (Pax & K.Hoffm.) F.P.Metcalfarabidopsis * NGS
Baccaurea Baccaurea ramilflora Loureiro TS
Euphorbiaceae Mallotus Mallotus paniculatus (Lam.) Muell. Arg. * TS
Mallotus japonicus (Thunb.) Muell. Arg. * TS
Macaranga Macaranga denticulata (Bl.) Muell. Arg. TS
Homonoia Homonoia riparia Lour. TS
Piperales Piperaceae Piper Piper sarmentosum Roxb. * NGS
Sapindales Sapindaceae Pometia Pometia pinnata J. R. et G. Frost. * TS
Aquifoliales Aquifoliaceae Ilex Ilex polypyrene C. J. Tseng et B. W. Liu * TS
Proteales Sabiaceae Meliosma Meliosma arnottiana Walp. * TS
Pinopsida
Gnetales Gnetaceae Gnetum Gnetum pendulum C.Y.Cheng * NGS
Gnetum montanum Markgr. TS

Note: NGS: next-generation sequencing; TS: transect survey; *: new record of Asian elephant diet; the four common species detected by NGS and transect survey are in bold font.

Fig. 3 Stacked bar-graph showing the top 10 (a) species and (b) families by relative abundance

3.3 Core species analysis

We identified 22 core species. For the Poaceae family, we found buddha bamboo (Bambusa ventricosa), common bamboo (Bambusa vulgaris), vetivergrass (Chrysopogon zizanioides), lemon grass (Cymbopogon citratus), giant bamboo (Dendrocalamus giganteus), Kelberg's bluestem (Dichanthium annulatum), giant speargrass (Heteropogon triticeus), Panicum incomtum, palmgrass (Setaria palmifolia), and Asian broom grass (Thysanolaena latifolia). For Musaceae, we found wild banana (Musa acuminate), plantain (Musa balbisiana), and Yunnan banana (Musa itinerans). We also found fig tree (Ficus glaberrima), dye fig (Ficus tinctorial), and Streblus indicus in Moraceae, as well as Rubus lambertianus among Rosaceae, giant mountain fishtail palm (Caryota maxima) among Arecaceae, Tavoy cardamom (Wurfbainia villosa) among Zingiberaceae, Begonia palmata among Begoniaceae, shikakai (Acacia concinna) in Fabaceae, and hardy pecan (Carya illinoinensis) in Juglandaceae. The nine most abundant species found by NGS and the transect survey were also core species in all the samples collected in this study.

3.4 Diversity assessment

The statistical results suggested that sex had no significant impact on alpha diversity (Wilcox test, all P > 0.05) (Fig. 4). For age group, all P-values were greater than 0.05; however, the value based on the PD whole tree index between adults and subadults was small (Tukey test, P = 0.043), suggesting that more unique OTUs could exist among the adult group. Individuals did not influence alpha diversity either, possibly because of the small sample size (Fig. 4).
Fig. 4 Box plots of alpha diversity index

Note: Individual, age, and sex groups for each row; Chao1, Observed species, PD whole tree, and Shannon index for each column. No significant differences existed for alpha diversity.

The NMDS plot (stress < 0.2) illustrated the structure across different groups (Fig. 5a). The ANOSIM analysis (Fig. 5b) showed no significant difference between the diet preferences of the adult and subadult elephants (P = 0.463); however, the difference was slightly greater between both age groups than within each of the groups (R = 0.002 > 0). Unfortunately, the statistical analysis was not applicable to the juvenile group because only one sample was available. No significant difference was recorded between the male and female elephants (P = 0.644), and the difference was smaller between both sexes than within each (R = -0.018). The diets of the 12 individuals were diverse; however, we did not collect sufficient samples from some individuals; thus, only the differences among five individuals were analyzed (InB, InC, InD, InF, and InH). The results showed that the differences between InB and InD (R = 0.2685, P = 0.047),
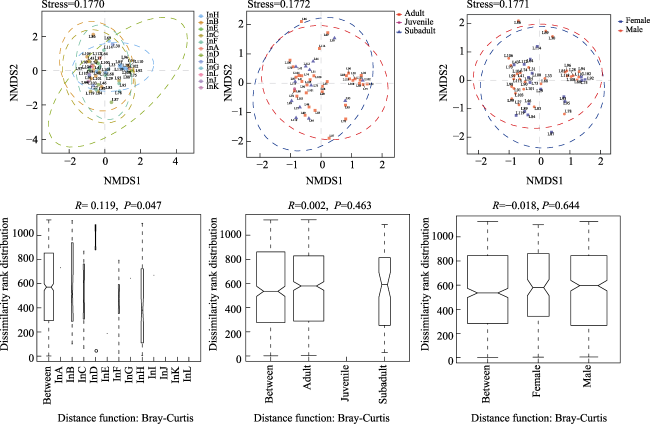
Fig. 5 NMDS plot and ANOSIM analysis of individual, age and sex groups for each column with stress < 0.2 according to Bray-Curtis distance; no significant clustering existed between age and sex (ANOSIM P > 0.05). Significant differences existed between individuals (ANOSIM P<0.05)
InB and InH (R = 0.1812, P = 0.028), and InC and InH (R = 0.2665, P = 0.016) were significant (Fig. 5). The differences between InC and InD (R = 0.2421, P = 0.092), InD and InF (R = 0.2341, P = 0.107), InH and InF (R = 0.09396, P = 0.184), as well as InH and InD (R = 0.213, P = 0.123) were greater than within each the individuals.

4 Discussion

4.1 Supplementing existing Asian elephant diet research

In this study, 117 plant species were obtained from the transect survey and NGS technology of an isolated elephant population in NNNR, Lincang Region, China. By examining previous lists (Jiang et al., 2019), we found 82 additional species, comprising a new appendix for the list of Asian elephants foraged plants in China, and 69 of the species were identified using NGS (Caryota maxima was detected by NGS and transect survey). These numbers considerably increase the number of plant species for Asian elephant diet composition and highlight the identification capability of the NGS technology.
As found by previous studies, Asian elephants have an extensive diet, ranging from dozens to more than a hundred plant species highly influenced by distribution, season, and availability. For example, Sukumar (1990) recorded 112 species foraged by Asian elephants in southern India; Campos-Arceiz et al. (2008) recorded 103 plant species from 42 families in Myanmar; Roy (2009) reported 150 plant species by observing the feeding trail of both captive and wild elephants, while 108 species were detected only from observing wild feeding trails in northwestern Bengal. Suba et al. (2018) recorded 100 species foraged by Bornean elephants (Elephas maximus borneensis) by interviewing the locals and examining feeding signs from Indonesia. Numerous studies have presented a shorter diet list (Joshi and Singh, 2008; Das et al., 2014; Koirala et al., 2016). In China, Asian elephants are mostly distributed in the southern and southwestern parts of Yunnan province, typically including the regions of Xishuangbanna, Lincang, and Simao. Chen et al. (2006) identified 139 plant species foraged in the Xishuangbanna National Nature Reserve (XNNR) by tracking. Another study conducted in the Shangyong region of XNNR recorded 106 species (Chen et al., 2006). Jiang et al. (2019) recorded 111 plant species from the elephant populations in XNNR and NNNR and summarized most studies conducted in China by generating a list of 240 plant species for both wild and captive Asian elephant diet. In the Simao region, Zhang et al. (2003) noted 19 plant species elephants fed on during the dry season, among which eight species were the main food resource. They have also been reported to eat seven crop species. Wang et al. (2006) analyzed the nutrition components of the 37 plant materials collected from Simao, generating a species list that included many species found by Zhang et al. (2003). Yang and Du (2002) recorded several species and Qin (2007) reported 48 plant species that elephants in NNNR frequently fed on; Musa spp. and Thysanolaena latifolia were commonly listed. This study fills the knowledge gap of elephant's diet composition in the NNNR area and provides a broader understanding of elephant's diet composition in China.
We also produced quantified results for a more specific interpretation of Asian elephant diet characterization. Although the research on Asian elephant diet has mostly covered the greatest part of the distribution area, numerous previous studies have classified Asian elephant foraged plants into their life forms (trees, shrubs, climbers, grasses, and herbs) or foraging types (browse and grass). However, diet has seldom been discussed with quantified taxonomic results (Sukumar, 1990; Campos-Arceiz et al., 2008; Joshi and Singh, 2008; Pradhan et al., 2008; Mohapatra et al., 2013). Some studies have also used the ratio of species or feeding signs to obtain more quantified results (Campos-Arceiz et al., 2008; Roy, 2009; Baskaran et al., 2010; Das et al., 2014) or applied a preference index to calculate the feeding predilection of elephants (Koirala et al., 2016). Chen et al. (2006) used the proportion of species occurrences in 30 microscopic views by the sum of occurrences of all species recognized to obtain quantified results at the family level. These methods have provided some insights into the feeding preferences of elephants; however, using the NGS has provided a more detailed and thorough compilation of quantified results. As with previous research, we showed that Poaceae, Moraceae, and Fabaceae are generally preferred by these elephants (Sukumar, 2003; Chen et al., 2006; Campos-Arceiz et al., 2008; Roy, 2009). The results of this study are slightly similar to those of Chen, as Musaceae, Zingiveraceae, Vitaceae, and Rosaceae are included in Asian elephants' diet list but in a different preferential order (Chen et al., 2006). We also detected plants in families, such as Begoniaceae (0.44%), Brassicaceae (0.34%), Icacinaceae (0.29%), Arecaceae (0.22%), Cucurbitaceae (0.17%), Dilleniaceae (0.16%), Lauraceae (0.15%), and Nyssaceae (0.11%). We included this list in the possible diet of elephants, unlike the list of Chen (Chen et al., 2006); Begoniaceae, Cucurbitaceae, Dilleniaceae, and Lauraceae were previously listed by Jiang et al. (2019). Furthermore, most less abundant family categories were new records, likely because NGS performs better at identifying plant species from tiny fragments of plant materials. At the species level, the nine most abundant species were categorized as core species, suggesting that these dominant plant species are essential nutrition resources for elephants and could be vital for their conservation (Boasiako et al., 2011; Niu et al., 2017).
This study was conducted during the dry season; different seasonal alterations should be surveyed for variation in future studies. Typically, elephants consume more plant species in dry season than in monsoon (Chen et al., 2006; Roy, 2009). The results of this study indicate a low diet diversity (relatively high richness and low evenness) among the elephant population in NNNR, potentially resulting from habitat shrinkage and fragmentation. With the marginal habitat covering 410.74 km2, it is crucial to improve the quality of these areas to provide additional habitat for this elephant population (Qin, 2007; Feng et al., 2010; Liu et al., 2016). As vegetation type is the primary factor influencing habitat quality for Asian elephant, the detected core species, especially the relatively abundant ones, can be restored in marginal habitats to improve their suitability for elephants. A corridor design would also facilitate linkage between fragmented patches. The diet preference of this elephant population can present guidance for successful habitat restoration and provide reliable indicators for measuring the quality of restored habitats.
We detected several crop species through NGS and found that the Asian elephant causes considerable damage to the locals in the area by eating and destroying crops (Whitham, 2015; Chen et al., 2016). Both wild and cultivated varieties of Tavoy cardamom (Wurfbainia villosa, 5.57%) are present in the fecal samples (Yang and Du, 2002: Chen et al., 2006), as well as pecan (Carya illinoinensis, 1.98%), which has been introduced and cultivated. Interestingly, locals have noted that elephants often trample on and pull out cultivated Tavoy cardamom, possibly for revenge or as a trial of strange food (Chen et al., 2006). The local government has implemented some food supplement intervention measures similar to those in the Xishuangbanna region to mitigate the intensity of human-elephant conflicts (Guo et al., 2012). Musa spp., bamboo, and Caryota maxima are usually planted in NNNR. These species may not be the most effective as supplemental choices to deter elephants from disturbing crops because they were found in the diet of this population in relatively low proportions. Better choices might include the nine species we identified at greater abundance and as core species (e. g., Bambusa ventricosa, Cymbopogon citratus, and Ficus glaberrima). Further or increased reliance of elephants on cultivated crops is a major potential source of human-elephant conflict; hence, more effective measures for mitigating this risk should be prioritized.

4.2 Group differences

The foraging behavior of elephants is influenced by social structures, biological features, and individual idiosyncrasies (Sukumar, 2003; Shannon et al., 2006; Woolley et al., 2011; Srinivasaiah et al., 2012). African elephants tend to show pronounced sexual dimorphism, especially after their mid-age phase (Poole, 1994; Lee and Moss, 1995; Shannon et al., 2006), and the females forage a wider range of plant species than the males do (Shannon et al., 2006). However, our results show no significant differences in foraging behavior between male and female Asian elephants, which is likely because of the small elephant population or small variety of available food resources. The data were inadequate for revealing the diet preferences of juvenile elephants because of the sample size; however, adult elephants had more OTUs than those of younger subadult elephants (Fig. 6), likely because of their life experiences: younger elephants learn their foraging skills from their mothers. The weaned calves forage less fibrous and more nutritious parts of vegetation, whereas adult females select bark, roots, and branches (Woolley et al., 2011). We found that significant differences exist, considering their different physiology and foraging habits. At the individual level, differences between individuals appeared and could be explained by their individually learned behavior or taste tendencies. Asian elephants do not only make decisions at the group level, but also individually within the group (Srinivasaiah et al., 2012).
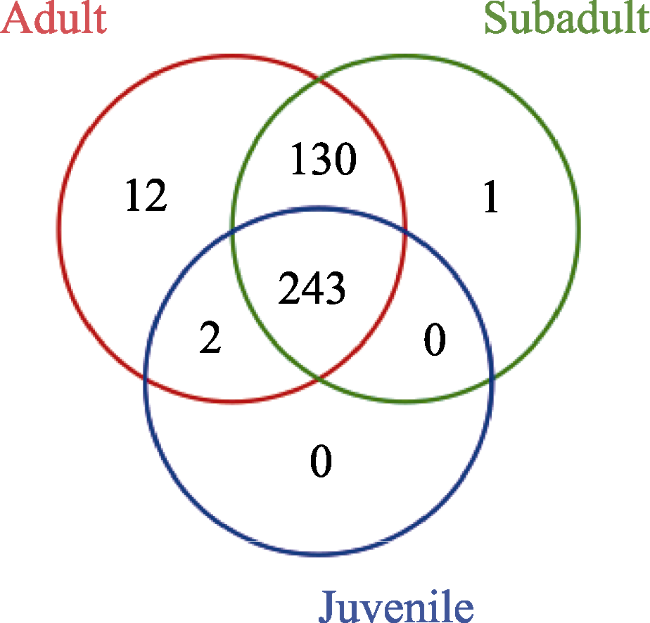
Fig. 6 Venn diagram of age groups showing number of mutual and unique OTUs

4.3 NGS technology prospects in diet research

As the NGS technology has advanced and become more affordable, it has become widely used for diet analysis of numerous animal species, including cephalopods, insects, reptiles, birds, and mammals (Srivathsan et al., 2015; Jedlicka et al., 2017; Olmos-Perez et al., 2017; Scinto, 2018; Zhong et al., 2019). This study targeted Asian elephants as mega-herbivores; numerous studies have examined the diet preferences of carnivores and omnivores (De Barba et al., 2014; Xiong et al., 2017). Additionally, the NGS technology has been applied to investigate inter-specific relationships and food web linkages (Bowser et al., 2013; Brown et al., 2014; Salinas-Ramos et al., 2015). DNA barcoding and NGS technology provide broader insights and contribute to a more profound perception of diet studies, as non- megascopic fragments can be recognized using these technologies as opposed to using traditional methods, a view which has been validated from other studies (Soininen et al., 2009; Ando et al., 2013). However, consideration should be taken against existing biases because fecal component proportions may not fully represent what the animals actually eat as well as the different digestion rates; moreover, the number of obtained sequences could be affected during amplification (Symondson and Harwood, 2014). However, these scenarios could be accounted for and adjusted using appropriate models. Furthermore, possible mistakes may occur during sequence identification from GenBank because of data entry error or laboratory contamination (Leray et al., 2019). Laboratory contamination can be controlled by establishing protocols and methods that will minimize contamination risks. For proper sequence identification, it would be necessary to establish local plant species references databases to improve result accuracy. We referred to several online databases to compensate for potential inaccuracies, and only some OTUs with relatively lower abundance values were misassigned. Despite these drawbacks, the use of NGS is undoubtably a viable approach for quantified diet data, and it can detect more nutrient interactions and provide more accurate taxonomic results.

5 Conclusions

DNA barcoding and next-generation sequencing provided specific diet composition data with quantified results for the diet study of a small population of Asian elephants. This provides a more comprehensive understanding of the diet composition of Asian elephants and presents methods that can be used for other species. This study highlighted a wide range of diet compositions for Asian elephant, with nine dominant plant species occupying relatively high abundance for each elephant. These plant species can be restored in marginal habitats where they are absent to improve the quality of the habitats for this elephant population. This new diet reference can serve as a basis for future corridor design to connect fragmented habitat patches, potentially increasing connectivity among isolated elephant populations. The reference also provides guidance for cultivating and maintaining local supplementary food bases that can help alleviate human-elephant conflict by enticing elephants away from crops and human settlements. As Tavoy cardamom and pecan accounted for relatively high abundance in the populations' diet, local plantations cultivating these species can be moved to reasonably far areas away from elephant habitats, which will reduce the possibility of economic loss. Differences between sexes and ages were not supported; however, we found differences at the individual level. Further studies should focus on understanding whether true differences exist between differing sexes and ages and between seasons by enlarging the sample size, sampling different areas, and increasing the research period. Additionally, setting up a local database of plant species is required to aid future research to improve the accuracy of plant species identification.

This study was supported by the Second National Survey of Terrestrial Wildlife Program funded by the National Forestry and Grassland Administration of China. We thank WANG Jiahui, LIU Ying, and LIU Zhen who provided support in field surveys. We also acknowledge Luciano Atzeni and LI Fengjiao for their comments on the manuscript.

[1]
Ando H, Setsuko S, Horikoshi K, et al. 2013. Diet analysis by next-generation sequencing indicates the frequent consumption of introduced plants by the critically endangered red-headed wood pigeon (Columba janthina nitens) in oceanic island habitats. Ecology and Evolution, 3(12): 4057-4069.

[2]
Barba M, Miquel C, Boyer F, et al. 2014. DNA metabarcoding multiplexing and validation of data accuracy for diet assessment: Application to omnivorous diet. Molecular Ecology Resources, 14(2): 306-323.

[3]
Baskaran N, Balasubramanian M, Swaminathan S, et al. 2010. Feeding ecology of the Asian elephant Elephas maximus Linnaeus in the Nilgiri Biosphere Reserve, southern India. Journal of Bombay Natural History Society, 107(1): 3-13.

[4]
Boasiako A C, Y Coffie G, Darkwa N A. 2011. Proximate composition of the leaves of Bambusa ventricosa, Oxytenanthera abyssinica and two varieties of Bambusa vulgaris. Scientific Research and Essays, 6(34): 6835-6839.

[5]
Bohnett E, Riordan P, Shi K. 2015. Initial assessment on large and medium sized terrestrial mammal assemblage using camera trapping in Nangunhe Nature Reserve in Yunnan, China. Journal of Resources and Ecology, 6(5): 331-344.

[6]
Borah J, Deka K. 2008. Nutritional evaluation of forage preferred by wild elephants in the rani range forest, Assam, India. Journal of Asian Elephant Specialist Group (Gajaha), 28: 41-43.

[7]
Bowser A K, Diamond A W, Addison J A. 2013. From puffins to plankton: A DNA-based analysis of a seabird food chain in the northern Gulf of Maine. Plos One, 8(12): e83152. DOI: 10.1371/journal.pone.0083152.

[8]
Brown D S, Burger R, Cole N, et al. 2014. Dietary competition between the alien Asian Musk Shrew (Suncus murinus) and a re-introduced population of Telfair's Skink (Leiolopisma telfairii). Molecular Ecology, 23(15): 3695-3705.

[9]
Campos-Arceiz A, Blake S. 2011. Megagardeners of the forest—The role of elephants in seed dispersal. Acta Oecologica, 37(6): 542-553.

[10]
Campos-Arceiz A, de la Torre J A, Wei K, et al. 2021. The return of the elephants: How two groups of dispersing elephants attracted the attention of billions and what can we learn from their behavior. Conservation Letters, 14(6): e12836. DOI: 10.1111/conl.12836.

[11]
Campos-Arceiz A, Lin T Z, Htun W, et al. 2008. Working with mahouts to explore the diet of work elephants in Myanmar (Burma). Ecological Research, 23(6): 1057-1064.

[12]
Caporaso J G, Kuczynski J, Stombaugh J, et al. 2010. QIIME allows analysis of high-throughput community sequencing data. Nature Methods, 7(5): 335-336.

[13]
Chen J, Deng X B, Zhang L, et al. 2006. Diet composition and foraging ecology of Asian elephants in Shangyong, Xishuangbanna, China. Acta Ecologica Sinica, 26(2): 309-316. (in Chinese)

[14]
Chen M, Wu Z, Dong Y, et al. 2006. Asian elephant research in China. Beijing, China: Science Press. (in Chinese)

[15]
Chen Y, Atzeni L, Gibson L, et al. 2022a. Urban expansion and infrastructure development reduce habitat suitability for Asian elephants in southwestern China. The Journal of Wildlife Management, 86(4): e22204. DOI: 10.1002/jwmg.22204.

[16]
Chen Y, Marino J, Chen Y, et al. 2016. Predicting hotspots of human-elephant conflict to inform mitigation strategies in Xishuangbanna, southwest China. Plos One, 11(9): e0162035. DOI: 10.1371/journal.pone.0162035.

[17]
Chen Y, Sun Y K, Atzeni L, et al. 2022b. Anthropogenic pressures increase extinction risk of an isolated Asian elephant (Elephas maximus) population in southwestern China, as revealed by a combination of molecular- and landscape-scale approaches. Integrative Zoology, 17(6): 1078-1094.

[18]
CVH Chinese Virtual Herbarium. 2003. National plant specimen resource center. https://www.cvh.ac.cn/.Viewed on 2 April 2020. on 2 April 2020.

[19]
Das B J, Saikia B N, Baruah K K, et al. 2014. Nutritional evaluation of fodder, its preference and crop raiding by wild Asian elephant (Elephas maximus) in Sonitpur District of Assam, India. Veterinary World, 7(12): 1082-1089.

[20]
Editorial Committee of FRPS. 1993. Flora Reipublicae Popularis Sinicae. Beijing, China: Science Press. (in Chinese)

[21]
Feng L M, Wang Z S, Lin L, et al. 2010. Habitat selection in dry season of Asian elephant (Elephas maximus) and conservation strategies in Nangunhe National Nature Reserve, Yunnan, China. Acta Theriologica Sinica, 30(1): 1-10. (in Chinese)

[22]
Flora of China Editorial Committee. 2013. Flora of China. Beijing, China: Science Press. (in Chinese)

[23]
FRPS Flora Reipubliae Popularis Sinicae. 2005. www.iplant.cn/frps. Viewed on 2 April 2020.

[24]
García-Robledo C, Erickson D L, Staines C L, et al. 2013. Tropical plant-herbivore networks: Reconstructing species interactions using DNA barcodes. Plos One, 8(1): e52967. DOI: 10.1371/journal.pone.0052967.

[25]
Group C P W. 2009. A DNA barcode for land plants. Proceedings of the National Academy of Sciences of USA, 106(31): 12794-12797.

[26]
Guo X M, He Q C, Wang L X, et al. 2012. Effects of Asian elephant food source base on the mitigation of human-elephant conflict in Xishuangbanna of Yunnan Province, Southwest China. Chinese Journal of Ecology, 31(12): 3133-3137. (in Chinese)

[27]
Hayes L D, Schradin C. 2017. Long-term field studies of mammals: What the short-term study cannot tell us. Journal of Mammalogy, 98(3): 600-602.

[28]
Jathanna D, Karanth K U, Kumar N S, et al. 2015. Patterns and determinants of habitat occupancy by the Asian elephant in the western ghats of Karnataka, India. Plos One, 10(7): e0133233. DOI: 10.1371/journal.pone.0133233.

[29]
Jedlicka J A, Vo A T E, Almeida R P P. 2016. Molecular scatology and high-throughput sequencing reveal predominately herbivorous insects in the diets of adult and nestling Western Bluebirds (Sialia mexicana) in California vineyards. The Auk, 134(1): 116-127.

[30]
Jiang Z C, Li Z L, Bao M W, et al. 2019. The statistics and analysis of foraging plants species eaten by Asian elephant (Elephas maximus) in China. Acta Theriologica Sinica, 39(5): 514-530. (in Chinese)

[31]
Joshi R, Singh R. 2008. Feeding behaviour of wild Asian elephants (Elephas maximus) in the Rajaji National Park. The Journal of American Science, 4(2): 34-48.

[32]
Koirala R K, Raubenheimer D, Aryal A, et al. 2016. Feeding preferences of the Asian elephant (Elephas maximus) in Nepal. BMC Ecology, 16(1): 54. DOI: 10.1186/s12898-016-0105-9.

[33]
Kress W J, Erickson D L. 2007. A two-locus global DNA barcode for land plants: The coding rbcL gene complements the non-coding trnH-psbA spacer region. Plos One, 2(6): e508. DOI: 10.1371/journal.pone.0000508.

[34]
Lee P C, Moss C J. 1995. Statural growth in known-age African elephants (Loxodonta africana). Journal of Zoology, 236(1): 29-41.

[35]
Leray M, Knowlton N, Ho S L, et al. 2019. GenBank is a reliable resource for 21st century biodiversity research. Proceedings of the National Academy of Sciences of USA, 116(45): 22651-22656.

[36]
Lin L, Zhang L. 2018. The impact on local forest ecosystem by elephants. Acta Theriologica Sinica, 38(4): 411-419. (in Chinese)

[37]
Ling Q. 2007. Habitat selection by Asian elephant (Elephas maximus) in Nangunhe Nature Reserve. Diss., Xi'an, China: Northwest University.

[38]
Liu P, Wen H, Harich F K, et al. 2017. Conflict between conservation and development: Cash forest encroachment in Asian elephant distributions. Scientific Reports, 7: 6404. DOI: 10.1038/s41598-017-06751-6.

[39]
Liu P, Wen H, Lin L, et al. 2016. Habitat evaluation for Asian elephants (Elephas maximus) in Lincang: Conservation planning for an extremely small population of elephants in China. Biological Conservation, 198: 113-121.

[40]
Missouri Botanical Garden. 2012. Tropicos. https://www.tropicos.org. Viewed on 2 April 2020.

[41]
Mohapatra K K, Patra A, Paramanik D. 2013. Food and feeding behaviour of Asiatic elephant (Elephas maximus Linn.) in Kuldiha Wild Life Sanctuary, Odisha, India. Journal of Environmental Biology, 34(1): 87-92.

[42]
Niu Z H, Tang G J, Zhang L Y, et al. 2017. Analysis of nutritional components of Bambusa ventricosa shoots. Journal of West China Forestry Science, 46(5): 35-39. (in Chinese)

[43]
Olmos-Pérez L, Roura Á, Pierce G J, et al. 2017. Diet composition and variability of wild Octopus vulgaris and Alloteuthis media (Cephalopoda) paralarvae: A metagenomic approach. Frontiers in Physiology, 8: 321. DOI: 10.3389/fphys.2017.00321.

[44]
Pompanon F, Deagle B E, Symondson W O C, et al. 2012. Who is eating what: Diet assessment using next generation sequencing. Molecular Ecology, 21(8): 1931-1950.

[45]
Poole J H. 1994. Sex differences in the behaviour of African elephants. Cambridge, UK: Cambridge University Press.

[46]
POWO Plants of the World Online. 2019. Plants of the world online. https://powo.science.kew.org/, Viewed on 2 April 2020.

[47]
Pradhan N M B, Wegge P, Moe S R, et al. 2008. Feeding ecology of two endangered sympatric megaherbivores: Asian elephant (Elephas maximus) and greater one-horned Rhinoceros Rhinoceros unicornis in lowland Nepal. Wildlife Biology, 14(1): 147-154.

[48]
Qin L. 2007. Habitat selection by Asian elephant (Elephas maximus) in Nangunhe Nature Reserve, Yunnan, China. Diss., Xi'an, China: Northwest University. (in Chinese)

[49]
Roy M. 2009. Habitat use and foraging ecology of the Asian elephant (Elephas maximus) in Buxa Tiger Reserve and adjoining areas of northern west Bengal. Diss., Bengal, India: Vidyasagar University.

[50]
Royal Botanic Garden. 2010. The plant list (version 1).http://www.theplantlist.org/. Viewed on 2 April 2020.

[51]
RStudio Team. 2020. RStudio:Integrated development for R. Boston, USA: RStudio Inc. http://www.rstudio.com.

[52]
Salinas-Ramos V B, Herrera Montalvo L G, León-Regagnon V, et al. 2015. Dietary overlap and seasonality in three species of mormoopid bats from a tropical dry forest. Molecular Ecology, 24(20): 5296-5307.

[53]
Schloss P D, Westcott S L, Ryabin T, et al. 2009. Introducing mothur: Open-source, platform-independent, community-supported software for describing and comparing microbial communities. Applied and Environmental Microbiology, 75(23): 7537-7541.

[54]
Scinto A C. 2018. The molecular analysis of Hawaiian bird diets. Diss., Durhan, USA: University of New Hampshire.

[55]
Shannon G, Page B R, Duffy K J, et al. 2006. The role of foraging behaviour in the sexual segregation of the African elephant. Oecologia, 150(2): 344-354.

[56]
Soininen E M, Valentini A, Coissac E, et al. 2009. Analysing diet of small herbivores: The efficiency of DNA barcoding coupled with high-throughput pyrosequencing for deciphering the composition of complex plant mixtures. Frontiers in Zoology, 6: 16. DOI: 10.1186/1742-9994-6-16.

[57]
Srinivasaiah N M, Anand V D, Vaidyanathan S, et al. 2012. Usual populations, unusual individuals: Insights into the behavior and management of Asian elephants in fragmented landscapes. Plos One, 7(8): e42571. DOI: 10.1371/journal.pone.0042571.

[58]
Srivathsan A, Ang A D, Vogler A P, et al. 2016. Fecal metagenomics for the simultaneous assessment of diet, parasites, and population genetics of an understudied primate. Frontiers in Zoology, 13: 17. DOI: 10.1186/s12983-016-0150-4.

[59]
Srivathsan A, Sha J C M, Vogler A P, et al. 2015. Comparing the effectiveness of metagenomics and metabarcoding for diet analysis of a leaf-feeding monkey (Pygathrix nemaeus). Molecular Ecology Resources, 15(2): 250-261.

[60]
Stackebrandt E, Goebel B M. 1994. Taxonomic note: A place for DNA-DNA reassociation and 16S rRNA sequence analysis in the present species definition in bacteriology. International Journal of Systematic and Evolutionary Microbiology, 44(4): 846-849.

[61]
Suba R B, Beveridge N G P, Kustiawan W, et al. 2018. Foraging ecology and diet of Bornean elephants (Elephas maximus borneensis) in the Sebuku forest area, North Kalimantan Province of Indonesia: Do the choices matter? Integrative Zoology, 13(2): 219-223.

[62]
Sukumar R. 1990. Ecology of the Asian elephant in southern India. II. Feeding habits and crop raiding patterns. Journal of Tropical Ecology, 6(1): 33-53.

[63]
Sukumar R. 2003. The living elephants:Evolutionary ecology, behavior, and conservation. New York, USA: Oxford University Press.

[64]
Sukumar R. 2006. A brief review of the status, distribution and biology of wild Asian elephants Elephas maximus. International Zoo Yearbook, 40(1): 1-8.

[65]
Sun Y K, Chen Y, Díaz-Sacco J J, et al. 2021. Assessing population structure and body condition to inform conservation strategies for a small isolated Asian elephant (Elephas maximus) population in southwest China. Plos One, 16(3): e0248210. DOI: 10.1371/journal.pone.0248210.

[66]
Symondson W O C, Harwood J D. 2014. Special issue on molecular detection of trophic interactions: Unpicking the tangled bank. Molecular Ecology, 23(15): 3601-3604.

[67]
Waldram M S, Bond W J, Stock W D. 2008. Ecological engineering by a mega-grazer: White rhino impacts on a South African savanna. Ecosystems, 11(1): 101-112

[68]
Wang H J, Wang P Z, Zhao X, et al. 2021. What triggered the Asian elephant's northward migration across southwestern Yunnan? The Innovation, 2(3): 100142. DOI: 10.1016/j.xinn.2021.100142.

[69]
Wang L H, Zhang L, He Q, et al. 2006. Nutrition components analysis of food for Asian elephants in wild and in captivity. Journal of Beijing Normal University (Natural Science), 42(2): 184-188. (in Chinese)

[70]
Wei J H. 2019. The impact of land use change on the habitat of Asian elephants in Nangunhe River Basin. Diss., Kunming, China: Yunnan University. (in Chinese)

[71]
Whitham C. 2015. Combining patterns of human-wildlife conflicts and ecosystem services for more efficient conservation management. Diss., Beijing, China: Beijing Forestry University.

[72]
Woolley L A, Page B, Slotow R. 2011. Foraging strategy within African elephant family units: Why body size matters. Biotropica, 43(4): 489-495.

[73]
Xiong M Y, Wang D J, Bu H L, et al. 2017. Molecular dietary analysis of two sympatric felids in the Mountains of Southwest China biodiversity hotspot and conservation implications. Scientific Reports, 7: 41909. DOI: 10.1038/srep41909.

[74]
Yang F, Zhang L. 2012. Population genetic structure and population genetic diversity analysis based on mitochondrial DNA of Asian elephant (Elephas maximus) in China. Acta Theriologica Sinica, 32(2): 90-100. (in Chinese)

[75]
Yang Y, Du F. 2002. Nangun River National Nature Reserve of China. Kunming, China: Yunnan Scientific Press. (in Chinese)

[76]
Zhang J. 2005. The analysis and strategy of human-elephant conflict in Xishuangbanna. Diss., Kunming, China: Yunnan Normal University. (in Chinese)

[77]
Zhang L. 2018. Research on the conservation of Asian elephants in China. Beijing, China: Science Press. (in Chinese)

[78]
Zhang L, Dong L, Lin L, et al. 2015. Asian elephants in China: Estimating population size and evaluating habitat suitability. Plos One, 10(5): e0124834. DOI: 10.1371/journal.pone.0124834.

[79]
Zhang L, Wang N. 2003. An initial study on habitat conservation of Asian elephant (Elephas maximus), with a focus on human elephant conflict in Simao, China. Biological Conservation, 112(3): 453-459.

[80]
Zhang L, Wang N, Wang Y N, et al. 2003. A preliminary study on the habitat and behaviors of Asian elephant (Elephas maximus) in Simao, Yunnan, China. Acta Theriologica Sinica, 23(3): 185-192. (in Chinese)

[81]
Zhong W T, Tan Z J, Wang B, et al. 2019. Next-generation sequencing analysis of Pardosa pseudoannulata's diet composition in different habitats. Saudi Journal of Biological Sciences, 26(1): 165-172.

Outlines

/