Land Resource and Land Use

Impact of Cultivated Land-use Change on the Cultivated Land Pressure in Jilin Province of China from 1980 to 2015

  • SUN Lina , *
Expand
  • School of Government Management, Heilongjiang University, Harbin 150080, China
*SUN Lina, E-mail:

Received date: 2022-04-20

  Accepted date: 2022-08-22

  Online published: 2023-04-21

Supported by

The Natural Science Foundation of Heilongjiang Province(D2016005)

The Basic Scientific Research Business Expenses of Universities in Heilongjiang Province(HDJDY201706)

The Innovative Talents Program of Heilongjiang Regular Universities(UNPYSCT-2018023)

Abstract

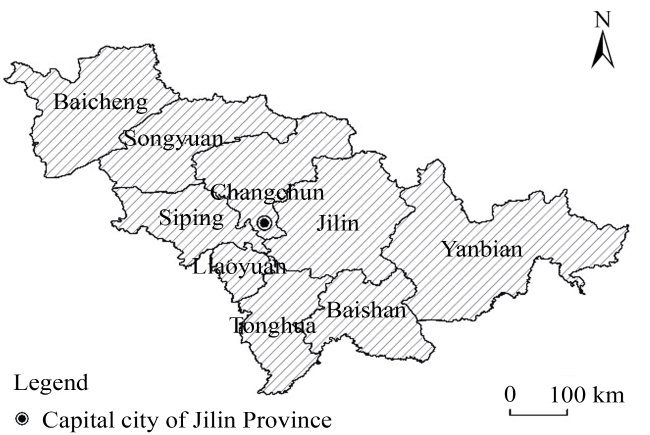
The protection of cultivated land resources is critically important for maintaining food production capacity, economic development, and social stability in China. This study analyzed the spatiotemporal characteristics of cultivated land variation in Jilin Province from 1980 to 2015 by taking Jilin Province as the study area, employing the remote sensing images captured in 1980, 1990, 1995, 2000, 2005, 2010, and 2015 and the statistical data from 1980 to 2015 as the basic data, and using a transfer matrix and the cultivated land pressure index model. The results revealed that on the temporal scale from 1980 to 2015, the area of cultivated land increased from 701.88×10⁴ ha to 762.82×10⁴ ha, the area of cultivated land per capita increased from 0.1524 ha to 0.1707 ha, and the cultivated land pressure index rose from 0.7922 to 0.7953. On the spatial scale, the cultivated land pressure in Jilin Province was mainly concentrated in the southern section in both 1980 and 1990, the southern and eastern sections in 1995, the southwestern and eastern sections in 2000, the southern and southeastern sections in 2005, and the southern, southeastern, and central sections in both 2010 and 2015. The change in the direction of the cultivated land pressure force in Jilin Province during the study period was mainly from northwest to southeast.

Cite this article

SUN Lina . Impact of Cultivated Land-use Change on the Cultivated Land Pressure in Jilin Province of China from 1980 to 2015[J]. Journal of Resources and Ecology, 2023 , 14(3) : 581 -590 . DOI: 10.5814/j.issn.1674-764x.2023.03.013

1 Introduction

The temporal and spatial changes in cultivated land use have profound impacts on food security (Moore et al., 2012; Verburg et al., 2013; Ramankutty et al., 2018). Cultivated land resources are the basic material condition for agricultural production, and the quantity and quality of cultivated land exert direct effects on the supply of food and the level of food security (Fu et al., 2001; Alexander et al., 2015; Ali and Suleiman, 2016). China contains approximately 22% of the world’s population (Ma et al., 2021), and has made significant contributions to the food security of the world. Meanwhile, the long-duration, high-intensity over-utilization of China’s cultivated land has caused serious problems such as soil erosion, secondary salinization of soil, a decrease in the thickness of the black soil layer, and other issues, and the cultivated land resources are under unprecedented pressure. Sustaining cultivated land is critically important for food security, economic development, and social stability in China.
A number of previous studies have investigated the past changes in cultivated land and cultivated land-use pressure across China (Liu et al., 2005; Li et al., 2018). One study compared the land use conversion to and from farmland for the period of 1986-2005, at both the national and regional levels (Song and Liu, 2016). Another study investigated the farmland changes in the Shanghai and Hangzhou Bay area from 1994 to 2015 (Li et al., 2018). Other scholars have interpreted the characteristics of cultivated land conversion by reconstructing the spatial distribution of historical cropland (Yang et al., 2015; Zhang et al., 2017). To reveal the cultivated land-use pressure, researchers have calculated the utilization efficiency of cultivated land (Gasparri et al., 2015; Nielsen, 2017) as well as the cultivated land pressure index (Yu, 2015; Zhao and Niu, 2015; Luo et al., 2016; Wang and Xin, 2017), and some have predicted future cultivated land pressure (Ren et al., 2008; Song and Pijanowski, 2014; Zhang et al., 2018; Chai et al., 2019). As for research methods, some scientists have established new measurement indices (Cai et al., 2002; Tan et al., 2012; Zhang and Cui, 2015) and new measurement models (Tao et al., 2013) based on traditional methods (Liu et al., 2010; Ramankutty et al., 2018; Han et al., 2019). In general, the existing studies can be grouped by three main aspects, the spatial-temporal change of cultivted land pressure, the factors influencing the cultivted land pressure and the impact of cultivted land pressure on food security. Although many studies with similar goals have been carried out, most of them have focused on the dynamics of cultivated land at either the national scale or in some highly developed regions, while only a few have investigated the spatial evolution of cultivated land in Jilin Province, one of the major grain-producing areas in China. The status of cultivted land pressure in Jilin Province has a profound influence to our country’s food security.
In this study, the temporal and spatial variation patterns of cultivated land resources in Jilin Province from 1980 to 2015 were analyzed. The spatial distribution of cultivated land resources was analyzed using the transfer matrix of cultivated land use, while the cultivated land-use pressure was analyzed using the cultivated land-use pressure index to explore the temporal variation laws and spatial evolutionary trends of cultivated land resources in Jilin Province. Using the cultivated land pressure index to reveal the temporal and spatial evolutionary trends of the changes in cultivated land resources is critically important for the protection of the cultivated land resources and the improvement of grain production capacity in the primary food production areas.

2 Materials and methods

2.1 Study area

Jilin Province as an important grain production area in China, maintaining its cultivated land is the top priority to ensure food security. Jilin Province (40°50°‒46°19°N, 121°38°‒131°19°E) is located in northeastern China and has a total area of approximately 18.74×10⁴ km2 of which the cultivated land accounts for 37% of the total land area. The terrain elevation is generally high in the southeast and low in the northwest. It is adjacent to Russia, Heilongjiang Province, Liaoning Province, and the Inner Mongolia Autonomous Region, with the Tumen River and Yalu River comprising its western boundary. Jilin Province experiences a typical temperate continental monsoon climate, with mean annual temperatures ranging from -4 to 6 °C and mean annual precipitation ranging from 400 to 650 mm. At the end of 2015, the total population of Jilin Province was about 2.704×10⁷, the GDP had reached 1507.462 billion yuan, and the total annual grain production was 334.30×10⁸ kg. Jilin Province consists of eight prefecture-level cities and one prefecture, i.e., Changchun City, Jilin City, Siping City, Songyuan City, Baicheng City, Liaoyuan City, Tonghua City, Baishan City, and Yanbian Prefecture (Fig. 1).
Fig. 1 Location of the study area

2.2 Data sources and processing

In this study, the distribution of cultivated land in Jilin Province was retrieved from the land-cover database. The cultivated land data at a spatial resolution of 1 km were obtained from the Data Center for Resources and Environment Sciences, Chinese Academy of Sciences (http://www.resdc. cn). Validation against field survey data demonstrated that the overall accuracy of the land-cover classification was 92.1%. The land-use types were further aggregated into six categories, i.e., cultivated land, forest, grassland, waterbody, construction land, and unused land (Fig. 2). Other statistical data came from the Statistical Yearbook of Jilin Province (1981-2016), the Yearbook of Jilin Province (1981-2016), and the statistical yearbooks of the other cities and prefectures in Jilin Province.
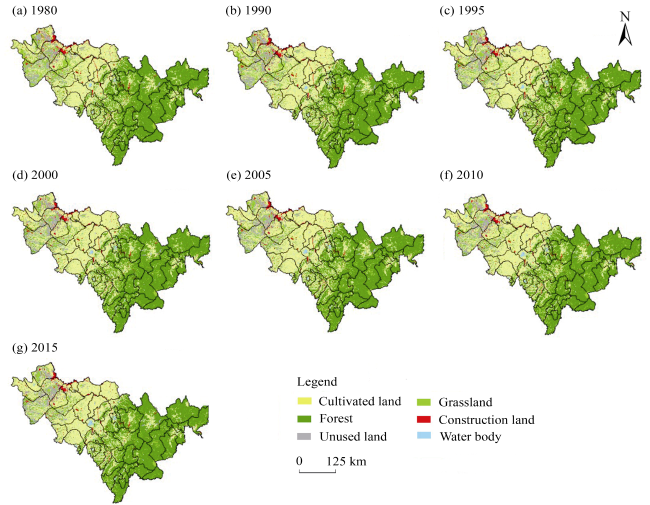
Fig. 2 Spatial distribution of main land-cover types in Jilin Province in 1980, 1990, 1995, 2000, 2005, 2010, and 2015

2.3 Research methods

2.3.1 Transfer matrix of cultivated land use

The temporal characteristics of the cultivated land were analyzed using a transfer matrix, which can comprehensively and concretely characterize the structure and direction of land conversion (Liu et al., 2010). The mathematical expression is:
${{S}_{ij}}=\left[ \begin{matrix} {{S}_{11}} & {{S}_{12}} & \ldots & {{S}_{1j}} & \ldots & {{S}_{1n}} \\ {{S}_{21}} & {{S}_{22}} & \ldots & {{S}_{2j}} & \ldots & {{S}_{2n}} \\ \ldots & \ldots & \ldots & \ldots & \ldots & \ldots \\ {{S}_{i1}} & {{S}_{i2}} & \ldots & {{S}_{ij}} & \ldots & {{S}_{in}} \\ \ldots & \ldots & \ldots & \ldots & \ldots & \ldots \\ {{S}_{n1}} & {{S}_{n2}} & \ldots & {{S}_{nj}} & \ldots & {{S}_{nn}} \\\end{matrix} \right]$
where Sij is the area of each land-use type; n is the number of land-use types; and i and j are the land-use types at the beginning and end of the study period, respectively. When the number of land-use types is less than 10, the transfer matrix for any two periods can be obtained by substituting the maps of the land-use types during those two periods using the following algebraic map expression:
${{C}_{i\times j}}=A_{i\times j}^{k}\times 10+A_{i\times j}^{k+1}$
where Ci×j is the land-use change from period k to period k+1, and i and j are the land-use types at the beginning and end of the study period, respectively, and $A_{i\times j}^{k}$ is the area of each land-use type in the year of k, $A_{i\times j}^{k+1}$ is the area of each land-use type in the year of k+1, which shows the land-use change types and their spatial distributions.

2.3.2 Cultivated Land Pressure Index (K)

The minimum area of cultivated land per capita is the cultivated land area that can achieve stable food consumption for every person in the region under the conditions of a fixed food supply level and the comprehensive production capacity of the cultivated land (Luo et al., 2016). Its mathematical model is:
${{S}_{\text{min}}}=\beta \times \frac{{{G}_{r}}}{p\times q\times k}$
where Smin is the minimum area of cultivated land per capita; β is the grain self-sufficiency ratio; Gr is the food demand per capita, for which the data are based on the lowest food consumption per capita of Jilin Province and the FAO standards of food consumption per capita; p is the grain yield per unit area; q is the ratio of food sowing area and total sowing area of crops; and k is the multiple crop index.
The cultivated land pressure index is the ratio of the minimum area of cultivated land per capita and the actual cultivated land per capita for a given area (Yang and Yang, 2015). Its mathematical model is:
$K={{S}_{\text{min}}}/{{S}_{a}}$
where K is the cultivated land pressure index; Smin is the minimum area of cultivated land per capita; and Sa is the actual cultivated land per capita. A value of K < 1 indicates that the productivity level of the cultivated land is higher than the food consumption level of the residents, i.e., there is no obvious pressure on cultivated land; while K = 1 indicates that the warning threshold of cultivated land protection and food security has been reached; and K > 1 indicates that food production cannot meet the demands of food consumption at a normal standard of living, i.e., cultivated land is experiencing obvious pressure.

2.3.3 Force transfer model

In order to analyze the spatiotemporal distribution law and migratory characteristics of the force of cultivated land
pressure, the cultivated land pressure force was calculated using the weighted average method (Meng et al., 2005). Its mathematical model is:
$X=\frac{\sum\limits_{i=1}^{n}{{{K}_{i}}{{X}_{i}}}}{\sum\limits_{i=1}^{n}{{{K}_{i}}}}$
$Y=\frac{\sum\limits_{i=1}^{n}{{{K}_{i}}{{Y}_{i}}}}{\sum\limits_{i=1}^{n}{{{K}_{i}}}}$
where X is the geometric center longitude of the cultivated land pressure index of Jilin Province; Xi is the longitude of the geometric center of i administrative unit; Y is the geometric center latitude of the cultivated land pressure index of Jilin Province; Yi is the latitude of the geometric center of i administrative unit; n is the number of administrative units; i is the serial number of each administrative unit; and Ki is the cultivated land pressure index of each administrative unit.

3 Results

3.1 Temporal dynamics of cultivated land resources

From 1980 to 2015, the total area of cultivated land exhibited an increasing trend (701.88×10⁴ ha in 1980, 718.11×10⁴ ha in 1990, 752.83×10⁴ ha in 1995, 759.41×10⁴ ha in 2000, 763.75×10⁴ ha in 2005, 762.79×10⁴ ha in 2010, and 762.82×10⁴ ha in 2015), and the cultivated land was mainly distributed in mid-western Jilin Province (Fig. 3).
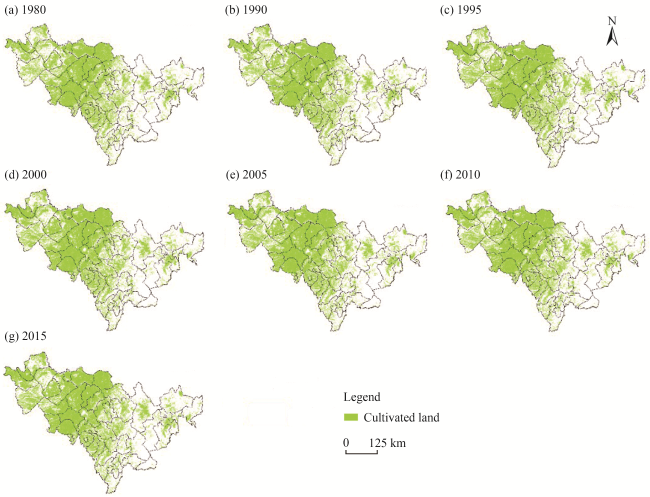
Fig. 3 Spatial distribution of cultivated land in Jilin Province in 1980, 1990, 1995, 2000, 2005, 2010, and 2015
There were substantial changes in the cultivated land of Jilin Province during the study period (Fig. 4). The increases primarily resulted from the conversions of forest, grassland, unused land, and construction land to cultivated land. All of the cultivated land increases amounted to 3.18×10⁶ ha from 1980 to 2015, translating into an annual increase rate of approximately 9.1×10⁴ ha per year. Land conversions from forest, grassland, unused land, and construction land to cultivated land contributed 43.59% (1.39×10⁶ ha), 22.85% (0.73×10⁶ ha), 14.19% (0.45×10⁶ ha), and 13.91% (0.44×10⁶ ha) of the total increase in cultivated land, respectively. The decreases were primarily the result of conversions to forest, construction land, and grassland. All of the cultivated land decreases amounted to 2.43×10⁶ ha from 1980 to 2015, translating to an annual decrease rate of approximately 0.07×10⁶ ha per year. Cultivated land conversions to forest, construction land, and grassland contributed 48.31% (1.17×10⁶ ha), 23.90% (0.58×10⁶ ha), and 11.41% (0.28×10⁶ ha) of the total decrease in cultivated land, respectively.
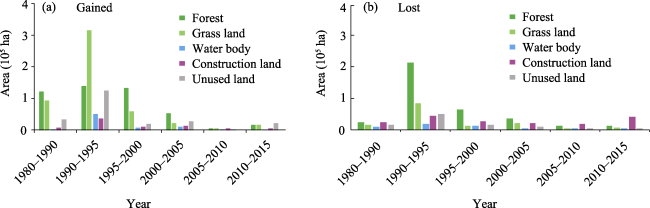
Fig. 4 Conversions of cultivated land in Jilin Province from 1980 to 2015

3.2 Spatial variation of cultivated land resources

The spatial variation of cultivated land changes was distinct among the periods of 1980-1990, 1990-1995, 1995-2000, 2000-2005, 2005-2010, and 2010-2015 (Fig. 5). From 1980 to 1990, the spatial pattern of cultivated land change was scattered, with most of the gained cultivated land converted from forest and grassland in the northwest part of Jilin Province, and most of the lost cultivated land converted to construction land and forest in the central part of the province. From 1990 to 1995, the variation in cultivated land exhibited a clear spatial pattern, with most of the gained cultivated land converted from grassland in the west, and most of the lost cultivated land converted into forest in the central region. From 1995 to 2000, the changes in cultivated land primarily occurred in the central part of the study area, with most of the gained cultivated land converted from forest, and most of the lost cultivated land converted to forest. From 2000 to 2005, the changes in cultivated land still primarily occurred in the central part of the study area, with most of the gained cultivated land converted from forest, and most of the lost cultivated land converted to construction land. From 2005 to 2010, the spatial pattern of cultivated land change was scattered, and the change in cultivated land in the study area was only minimal. From 2010 to 2015, the change in cultivated land in the study area was also minimal, and the spatial distribution of cultivated land-use change was still decentralized. However, most of the gained cultivated land resulted from the conversion of unused land in the northwest, while most of the lost cultivated land was converted to construction land in the central part of the province.
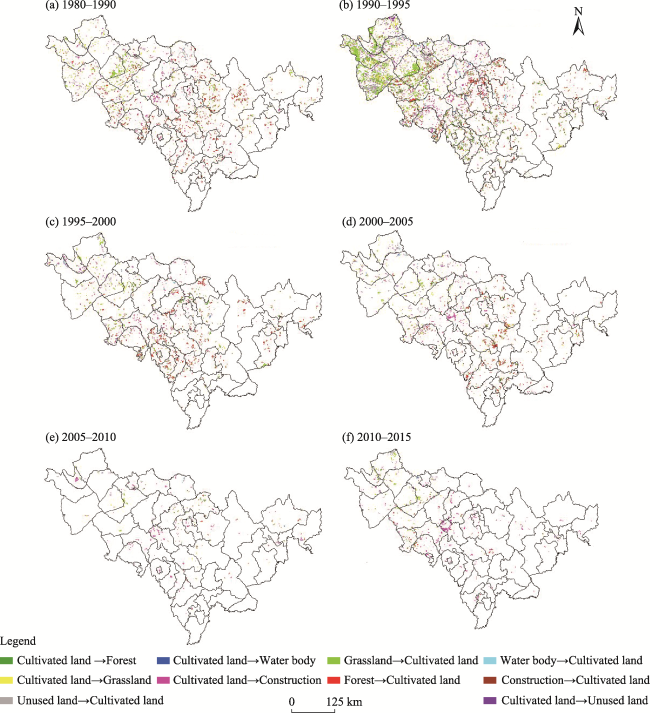
Fig. 5 Spatial variation in the cultivated land use changes in Jilin Province from 1980 to 2015

3.3 Temporal dynamics of cultivated land pressure

The cultivated land pressure was not only impacted by the quantity and distribution of cultivated land, but also by a change in the grain yield. There were substantial changes in total grain yield and grain yield per unit area in Jilin Province during the study period. From 1980 to 2015, the total grain yield and grain yield per unit area both exhibited increasing trends. The total grain yield increased by 1.13×10⁷ kg from 1980 to 2015, while grain yield per unit area increased by 512.8 kg ha‒1.
The results of the land-use pressure index revealed that the minimum area of cultivated land per capita manifested the same trend of change as the land-use pressure index (Table 1). The population of Jilin Province increased year by year from 1980 to 2015, especially after 2005, when the population of Jilin Province increased significantly. Meanwhile, the cultivated land area per capita was stable. As a result of these changes, the cultivated land-pressure index K was less than 1 during this period, displaying two obvious minima of 0.6804 in 1995 and 0.6829 in 2010, and a maximum of 0.8110 in 1990 (Table 1). Thus, there was no pressure on the cultivated land resources of Jilin Province from 1980 to 2015.
Table 1 Relevant parameters of the cultivated land-pressure index in Jilin Province from 1980 to 2015
Year Actual cultivated land per capita (ha capita-1) Minimum area of cultivated land per capita (ha capita-1) Grain yield per unit area (kg ha-1) Multiple crop index Ratio of food sowing area to total sowing area of crops Food demand per capita
(kg capita-1)
Cultivated land pressure index
1980 0.1524 0.1207 4287.3210 0.8972 0.8613 400 0.7922
1990 0.1620 0.1224 4522.9870 0.9126 0.8793 400 0.8110
1995 0.1614 0.1102 4738.8328 0.8823 0.8678 400 0.6804
2000 0.1628 0.1131 3817.5639 0.8191 0.8720 400 0.7032
2005 0.1649 0.1259 4144.3835 0.8103 0.8603 400 0.7376
2010 0.1667 0.1102 4553.1430 0.7614 0.8703 400 0.6829
2015 0.1707 0.1326 4800.1126 0.7632 0.8674 400 0.7953

3.4 Spatial variation of cultivated land pressure in the study area

The results of the spatial variation in the cultivated land pressure index (Fig. 6) showed that the K values of the cities in Jilin Province were relatively low during the study period. In 1980, the K values of most cities in Jilin Province were less than 1, with the cultivated land pressure mainly concentrated in southern Jilin Province. Tonghua City exhibiting obvious cultivated land pressure, as indicated by its value of K > 1. In 1990, the cultivated land pressure was also mainly concentrated in the southern part of the province, with Baishan City and Tonghua City having K > 1, indicating obvious cultivated land pressure. In 1995, the cultivated land pressure was mainly concentrated in southern and eastern Jilin Province, with Yanji City and Tonghua City having K > 1 and showing obvious cultivated land pressure. In 2000, the cultivated land pressure was mainly concentrated in southwestern and eastern Jilin Province, with Yanji City, Tonghua City, and Liaoyuan City having cultivated land pressure index values greater than 1, indicative of obvious cultivated land pressure. In 2005, the K values were less than 1 in most cities in Jilin Province, with the cultivated land pressure mainly concentrated in the southern and southeastern sections of the province. Liaoyuan City, Yanji City, and Baishan City exhibited obvious cultivated land pressure, as indicated by their values of K > 1. In 2010, the cultivated land pressure was mainly concentrated in the southern, southeastern, and central portions of Jilin Province. Changchun City, Liaoyuan City, Yanji City, and Baishan City all showed K > 1, indicating obvious cultivated land pressure. In 2015, the cultivated land pressure was also mainly concentrated in the southern, southeastern and central portions of Jilin Province. Changchun City, Liaoyuan City, Yanji City, and Baishan City had values of K > 1, demonstrating obvious cultivated land pressure, although the number of cities with a cultivated land pressure index of 1 increased from 17 to 20. A comparison of the maps in Fig. 6 reveals that the cultivated land pressure was mainly concentrated in the central, southern, and southeastern portions of Jilin Province, and the number of cities with values of K ≥ 1 increased year by year. These patterns indicate that the cultivated land pressure of Jilin Province exhibited a rising tendency, although most cities, especially in northern Jilin Province, showed no cultivated land pressure. Thus, Jilin Province can play an important role in protecting the national food security of China.
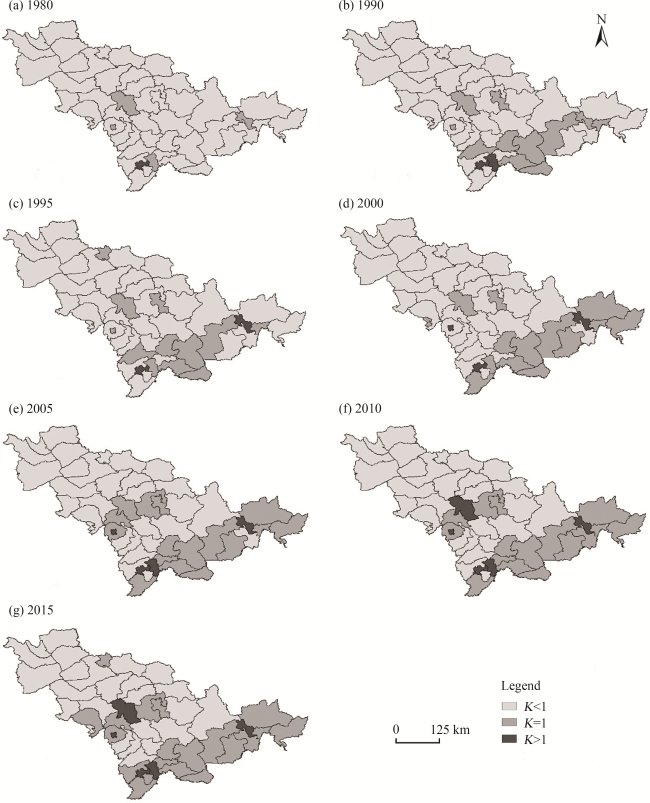
Fig. 6 Spatial variation of the cultivated land pressure index values in Jilin Province

3.5 Force transfer characteristics of cultivated land pressure in the study area

The force of the cultivated land pressure reflects the proportionality of the distribution of the cultivated land pressure index and reveals the change in the direction of the cultivated land pressure in the study area. The results of the calculation demonstrated that the force of the cultivated land pressure was mainly located from 42.31-43.01°N latitude and 126.40-127.50°E longitude (Fig. 7), indicating that all of the cultivated land pressure of Jilin Province was transferred from the northwest to the southeast during the period of 1980 to 2015.
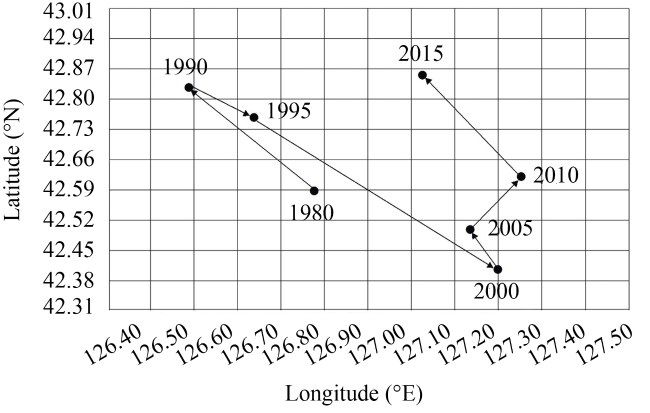
Fig. 7 Force transfer path of the cultivated land pressure in Jilin Province from 1980 to 2015

4 Discussion

4.1 Temporal variation of cultivated land

The current utilization of cultivated land resources revealed that the cultivated land pressure index K was less than 1 during the study period. It exhibited two obvious minima in 1995 and 2010, and its maximum occurred in 1990. Hence, there was no pressure on the cultivated land resources of Jilin Province from 1980 to 2015. Similar to these findings, Song and Pijanowski found an increase of 0.83% in the cultivated land in Heilongjiang Province between 1999 and 2008, although the total area of cultivated land area in China decreased (Song and Pijanowski, 2014).

4.2 Spatial variation of cultivated land

The spatial variance of the cultivated land pressure revealed that the main areas of cultivated land pressure were located in the central, southern, and southeastern portions of Jilin Province, and the high cultivated land pressure areas were Yanji City, Tonghua City, Baishan City, and Liaoyuan City. In a previous study of Heilongjiang Province (Li, 2021), the results reported the primary conversion of cultivated land in the central and western portions of Heilongjiang Province, and also a moderate amount of cultivated land use change in eastern Heilongjiang Province. The method of these two studies was the same, which shows that it can be used to review the spatial variance of cultivated land pressure.

4.3 Transfer track of cultivated land pressure

The results of the transfer track of the cultivated land pressure revealed that the direction of change was mainly from northeast to southwest, indicating that cultivated land pressure in the entire Jilin Province shifted from northeast to southwest during the period 1980 to 2015. The cultivated land pressure of Jilin Province exhibited obvious regional differences, with relatively low pressure in the north and high pressure in the south. In a study of the Pearl River-Xijiang Economic Zone that used the same method for calculating K, Chen et al. (2022) reported that the cultivated land pressure in the Pearl River-Xijiang Economic Zone has been in a “high pressure” state, and the Cultivated Land Pressure Index has been rising continuously from 2008 to 2017. The trends of change in the two study areas are similar to one other.

4.4 Future research directions

The methods and resources used in this study afforded the accurate exploration of the temporal and spatial characteristics of cultivated land pressure variation in Jilin Province, and have a certain practical significance for the intensive utilization and protection of cultivated land. Compared with other methods and due to the availability of data, the index K can more intuitively reflect the cultivated land pressure in Jilin Province. Other methods will be used to calculate the cultivated land pressure in Jilin Province in the future and the applicability of the methods can then be compared. In this investigation, the calculation of K was based on the lowest food consumption per capita of Jilin Province only, and it did not consider the output of the grain productions of Jilin Province, which will be included in future studies. Furthermore, this study did not analyze the driving factors behind the cultivated land pressure changes observed in the study area. In the future, these driving factors should be explored.

5 Conclusions

This study took Jilin Province as the study area, calculated the cultivated land pressure index values from 1980 to 2015, and analyzed the temporal and spatial characteristics of cultivated land pressure variation. Several conclusions can be drawn from this analysis.
(1) On the temporal scale, from 1980 to 2015 the quantity of cultivated land increased from 701.88×10⁴ ha to 762.82 ×10⁴ ha, with these increases primarily resulting from conversions of forest, grassland, unused land, and construction land to cultivated land. The area of cultivated land per capita increased from 0.1524 ha to 0.1707 ha. The cultivated land pressure index rose from 0.7922 to 0.7953. For Jilin Province as a whole, the use of cultivated land was in the safe range.
(2) On the spatial scale, cultivated land pressure in Jilin Province was mainly concentrated in the southern section in both 1980 and 1990, the southern and eastern sections in 1995, the southwestern and eastern sections in 2000, the southern and southeastern sections in 2005, and the southern, southeastern, and central sections in both 2010 and 2015. Some cities in Jilin Province experienced a high level of cultivated land pressure, although Jilin Province was in the safe range overall. The protection of cultivated land resources cannot be ignored.
(3) The results of the calculation revealed that the force of cultivated land pressure was mainly located from 42.31- 43.01°N latitude and 126.40-127.50°E longitude. Thus, the cultivated land pressure force was concentrated in the south- central section of Jilin Province.
[1]
Alexander P, Rounsevell M D A, Dislich C, et al. 2015. Drivers for global agricultural land use change: The nexus of diet, population, yield and bioenergy. Global Environmental Change, 35: 138-147.

[2]
Ali M H, Suleiman N. 2016. Sustainable food production: Insights of Malaysian halal small and medium sized enterprises. International Journal of Production Economics, 181: 303-314.

[3]
Cai Y L, Fu Z Q, Dai E F. 2002. The minimum area per capita of cultivated land and its implication for the optimization of land resource allocation. Acta Geographica Sinica, 57(2): 127-134. (in Chinese)

[4]
Chai J, Wang Z Q, Yang J, et al. 2019. Analysis for spatial-temporal changes of grain production and farmland resource: Evidence from Hubei Province, central China. Journal of Cleaner Production, 207: 474-482.

[5]
Chen S Y, Wu X B, Ma Z Y, et al. 2022. Analysis of the spatio-temporal differentiation of cultivated land pressure in the Pearl River-Xijiang economic zone and its influencing factors. Journal of Resources and Ecology, 13(3): 407-416.

[6]
Fu Z Q, Cai Y L, Yang Y X, et al. 2001. Research on the relationship of cultivated land change and food security in China. Journal of Natural Resources, 16(4): 313-319. (in Chinese)

[7]
Gasparri N I, Grau H R, Sacchi L V. 2015. Determinants of the spatial distribution of cultivated land in the North Argentine Dry Chaco in a multi-decadal study. Journal of Arid Environments, 123: 31-39.

[8]
Han C J, Zhang X H, Hua Y S. 2019. Development of strategies for joint allocation of cultivated land and ecological land in Tianjin based on system dynamics. Chinese Journal of Eco-Agriculture, 27(3): 391-404. (in Chinese)

[9]
Li C H, Li N, Shi P J. 2006. Analysis on regional differentiation of cultivated land use pressure in China by radial basis function networks. China Population, Resources and Environment, 16(5): 67-71. (in Chinese)

[10]
Li D, Zhou J, Zhan D Q. 2021. Spatial and temporal changes and driving factors of cultivated land in Heilongjiang Province. Scientia Geographica Sinica, 41(7): 1266-1275. (in Chinese)

[11]
Li J T, Liu Y S, Yang Y Y. 2018. Land use change and effect analysis of tideland reclamation in Hangzhou Bay. Journal of Mountain Science, 15(2): 394-405.

[12]
Liu J Y, Liu M L, Tian H Q, et al. 2005. Spatial and temporal patterns of China’s cropland during 1990-2000: An analysis based on Landsat TM data. Remote Sensing of Environment, 98(4): 442-456.

[13]
Liu J Y, Zhang Z X, Xu X L, et al. 2010. Spatial patterns and driving forces of land use change in China during the early 21st century. Journal of Geographical Sciences, 20(4): 483-494.

[14]
Luo X, Zeng J X, Zhu Y Y, et al. 2016. Who will feed China: The role and explanation of China’s farmland pressure in food security. Geographical Research, 35(12): 2216-2226. (in Chinese)

[15]
Luo X, Zhang L, Zhu Y Y. 2016. Study on food security based on cultivated land pressure index in China. Chinese Rural Economy, (2): 83-96. (in Chinese)

[16]
Ma X, Zheng X X, Wang Y, et al. 2021. Study on the spatial-temporal evolution of cultivated land pressure and its driving factors in central Plains economic region. Chinese Journal of Agricultural Resources and Regional Planning, 42(3): 58-66. (in Chinese)

[17]
Meng B, Wang J, Zhang W, et al. 2005. Evaluation of regional disparity in China based on spatial analysis. Scientia Geographica Sinica, 25(4): 393-400. (in Chinese)

[18]
Moore N, Alagarswamy G, Pijanowski B, et al. 2012. East African food security as influenced by future climate change and land use change at local to regional scales. Climatic Change, 110(3-4): 823-844.

[19]
Nielsen H. 2017. Productive efficiency in the iron and steel sector under state planning: The case of China and former Czechoslovakia in a comparative perspective. Applied Energy, 185: 1732-1743.

[20]
Ramankutty N, Mehrabi Z, Waha K, et al. 2018. Trends in global agricultural land use: Implications for environmental health and food security. Annual Review of Plant Biology, 69: 789-815.

[21]
Ren G Z, Zhao X G, Chao S J, et al. 2008. Temporal-spatial analysis of cultivated land pressure in China based on the ecological tension indexes of cultivated land. Journal of Arid Land Resources and Environment, 22(10): 37-41. (in Chinese)

[22]
Song W, Liu M L. 2016. Farmland conversion decreases regional and national land quality in China. Land Degradation & Development, 28(2): 459-471.

[23]
Song W, Pijanowski B C. 2014. The effects of China’s cultivated land balance program on potential land productivity at a national scale. Applied Geography, 46: 158-170.

[24]
Tan S K, Zhang L, Qi R. 2012. Research on regional pressure index of cultivated land based on system dynamics—A case study of Hubei Province. Journal of Natural Resources, 27(5): 757-765. (in Chinese)

[25]
Tao J, Fu M, Zhang D X, et al. 2013. System dynamics modeling for the pressure index of cultivated land in China. Agriculture and Environment, 11(2): 1045-1049.

[26]
Verburg P H, Mertz O, Erb K H, et al. 2013. Land system change and food security: Towards multi-scale land system solutions. Current Opinion in Environmental Sustainability, 5(5): 494-502.

[27]
Wang J, Xin L. 2017. Spatial-temporal variations of cultivated land and grain production in China based on Globe Land30. Transactions of the Chinese Society of Agricultural Engineering, 33(22): 1-8. (in Chinese)

[28]
Yang Q, Yang Z S. 2015. The measurement and grading of pressure on cultivated land in city-level in Yunnan Province. Agricultural Science & Technology, 16(7): 1562-1564.

[29]
Yang X H, Guo B B, Jin X B, et al. 2015. Reconstructing spatial distribution of historical cropland in China’s traditional cultivated region: Methods and case study. Chinese Geographical Science, 25(5): 629-643.

[30]
Yu B H. 2015. Dynamic analysis and forecast of the cultivated land pressure index in Henan Province. Chinese Journal of Agricultural Resources and Regional Planning, 36(6): 17-21. (in Chinese)

[31]
Zhang G H, Cui X F. 2015. Non-agricultural driving forces of cultivated land resources and its regional differences. Chinese Agricultural Sciences, 48(8): 1632-1640. (in Chinese)

[32]
Zhang L J, Jiang L Q, Zhang X Z. 2017. Reconstruction of cropland spatial patterns and its spatiotemporal changes over the 20th century on the Songnen Plain, Northeast China. Journal of Geographical Sciences, 27(10): 1209-1226.

[33]
Zhang Y J, Yan X S, Zhang F, et al. 2018. Analysis on temporal-spatial difference of cultivated land pressure at multiple scales in China from 1978 to 2015. Transactions of the Chinese Society of Agricultural Engineering, 34(13): 1-7. (in Chinese)

[34]
Zhao S X, Niu H O. 2015. Study on the cropland pressure in Henan Province based on Grey Markov Model. Journal of Arid Land Resources and Environment, 29(8): 46-51. (in Chinese)

Outlines

/