Land Resource and Land Use

Evaluation of the Land Use Benefit of Rapidly Expanding Cities based on Coupling Coordination and a Transfer Matrix

  • NIU Wentao , 1 ,
  • SHEN Qinghui 1 ,
  • XU Zhenzhen 2 ,
  • SHANG Wenwen , 3, *
Expand
  • 1. School of Management, Zhengzhou University, Zhengzhou 450001, China
  • 2. School of Architecture and Built Environment, Deakin University, Geelong VIC 3219, Australia
  • 3. School of Tourism and Exhibition, Henan University of Economics and Law, Zhengzhou 450016, China
*SHANG Wenwen, E-mail:

NIU Wentao, E-mail:

Received date: 2022-04-05

  Accepted date: 2022-08-19

  Online published: 2023-04-21

Supported by

The Major Project of Applied Research on Philosophy and Social Sciences of Henan Province in China(2023YYZD22)

The Philosophy and Social Science Planning Project of Henan Province in China(2021BJJ093)

The Think Tank Project of Henan Province in China(2021ZKYJ10)

The Key Research and Development Project (Soft Science) of Henan Province in China(212400410086)

Abstract

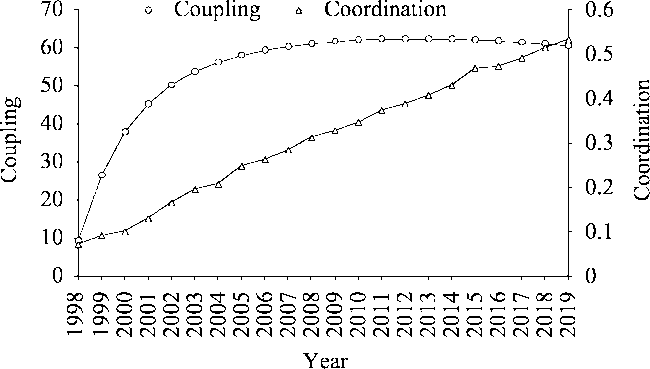
The efficient use of urban land is one of the key factors for high-quality urban development, especially in large cities that lack land resources. By constructing an analysis framework of the land use benefit system and the transfer matrix of land use type, this study identified the evolutionary law governing the land use benefit system and its dynamic coupling coordination relationship with the rapidly expanding city by taking Zhengzhou, a national central city in China, as a case study. The results show that the urban land use (ULU) benefit system of Zhengzhou gradually shifted from the eco-environmental benefit type (1998-2005) to the socio-economic benefit type (2006-2019), with the coupling degree presenting a typical inverted U-shaped evolutionary process. In the same period, the urban area of Zhengzhou expanded by about 461 square kilometers. A further transfer matrix analysis shows that the main source of expansion has been the conversion of arable land, grassland, woodland and water areas to construction land. Therefore, the local government should implement a differentiated land use strategy according to the characteristics of the land use benefit system and the evolution of the coupling and coordination relationship, exploit the opportunity of urban boundary delimitation, and promote urban transformation and upgrading as well as eco-city construction.

Cite this article

NIU Wentao , SHEN Qinghui , XU Zhenzhen , SHANG Wenwen . Evaluation of the Land Use Benefit of Rapidly Expanding Cities based on Coupling Coordination and a Transfer Matrix[J]. Journal of Resources and Ecology, 2023 , 14(3) : 542 -555 . DOI: 10.5814/j.issn.1674-764x.2023.03.010

1 Introduction

With the continuous acceleration of urbanization in China, low-density development and a large-scale disorderly outward expansion from the central areas have appeared in many cities, leading to the increasingly obvious contradiction between urban eco-environmental protection and socioeconomic development, and this issue has become one of the typical problems with the extensive use of urban land (Zhen et al., 2019). Taking land as the key carrier, cities have realized the reconstruction of both the internal relations among humans, land, capital and other elements and the basic rules of urban space rights allocation through the continuous production of “space” (Ren, 2006), resulting in the continuous evolution of the ULU benefit system, which also restricts the development of high-quality urbanization. Therefore, in order to achieve the sustainable use of urban land and the sustainable development of cities, two realistic topics urgently need to be discussed, i.e., identifying the evolution and optimization rules of the land use benefit system in rapidly expanding cities.
Socio-economic benefits and eco-environmental benefits are interrelated, and they jointly constitute an important dimension of the urban land-use benefit system (Tan et al., 2003). The coupling coordination relationship between the two is not only one of the significant indicators of ULU evaluation, but also an important basis for improving the operational performance of the urban land-use benefit system. Urban land use and its benefit evaluation have developed into a global concern. In terms of research perspective, relevant studies have mainly focused on sustainable urban land use and land carrying capacity (He et al., 2003), urban land-use change and planning (Hersperger et al., 2018), land use policies and systems (Bennett et al., 2013), urbanization and land use (Jenerette and Potere, 2010), land-use benefits and urbanization (Xi et al., 2013; Jia et al., 2014; Zhang and Mo, 2014), land-use structure, benefits evaluation and its coupling coordination relationship (Kong et al., 2009; Tian et al., 2019) and other aspects. In addition, the selection and construction of research indicators are mainly based on the Delphi method (Liang et al., 2008), the principal component analysis method or the entropy weighting method (Zhang et al., 2014; Li et al., 2017; Wu et al., 2017). Recently, the comprehensive evaluation of land use benefits, which include the social benefits (Camagni et al., 2002) and ecological benefits (Song et al., 2016), has gradually become a research hotspot. In general, scholars pay attention to the comprehensive evaluation of ULU efficiency, agree on the susceptibility of ecological and environmental problems in urban land use, and emphasize the importance of the coordination of socio-economic development and eco-environmental protection.
However, one obvious shortcoming of the current research is that the evolutionary law governing land use efficiency among social, economic, ecological and environmental subsystems during the rapid expansion of urban space, and the interaction mechanism and dynamic coupling coordination relationship between the ULU benefit subsystems, have not been investigated in detail. In view of this shortcoming, through teasing out the coupling coordination relationship of the urban land use benefit system and its internal working mechanism, an evaluation index system and a coupling coordination relationship model of urban land use were constructed for this study. Taking Zhengzhou, a national central city in China, as an example, and by constructing the analytical framework (Fig. 1), this study evaluates the socio-economic benefits, the eco-environmental benefits and the comprehensive benefits of urban land use, and identifies the evolutionary law governing the land use benefit system and its dynamic coupling coordination relationship in rapidly expanding cities. The results of this analysis provide a decision-making reference for the sustainable use of land resources and the improvement of comprehensive benefits in rapid expanding cities.
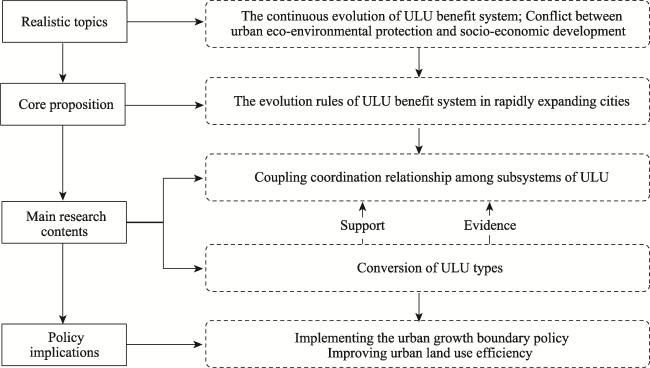
Fig. 1 The technical route followed by this study

2 Literature review

2.1 Urban expansion and rapidly expanding city

Urban expansion is one of the main manifestations of urbanization, and it is the leading process of regional land use evolution. Urban expansion is an open, complex and dynamic system based on land. An adequate and stable supply of land is a necessary guarantee for urban expansion. Urban expansion is a hot academic topic closely related to urbanization, urban sprawl and urban boundary control, and the related research mainly focuses on the spatial and temporal characteristics of urban expansion (Ouyang et al., 2020; Hu et al., 2021; Li et al., 2021), the comprehensive effect of urban expansion (Yang and Li, 2020; Zhao et al., 2020a; Zhao et al., 2020b), and urban growth boundaries (Cong et al., 2018; Hu et al., 2019; Niu et al., 2022).
Since the reform and opening up, with the rapid development of China’s economy, the scale and number of cities have increased rapidly, the process of urban expansion in various regions has been accelerating, and the rapid urbanization has gradually become an important feature of China’s economic and social development level. Thus, many rapidly expanding cities have also appeared, and they are mainly manifested by urban population growth, economic development and built-up area expansion in a relatively short period. The relevant research on rapidly expanding cities in China mainly focuses on land supply (Tan and Qi, 2011; Huang et al., 2020), population effect (Yang et al., 2013; Zhou et al., 2016), economic effect (Sheng et al., 2014; Liu et al., 2020) and ecological change (Chen, 2011; Liu et al., 2013).

2.2 Urban land-use benefits system

Cities are not only important places for human production and life, but also the spatial basis for the establishment of the modern social order. Taking land as the key carrier, cities have realized the reconstruction of the internal relations among humans, land, capital and other elements through the continuous production of “space”, leading to the continuous evolution of urban spatial organization (Hui et al., 2015; Liu et al., 2019), thus forming urban land use efficiency (Lu and Ke, 2018; Ye and Wei, 2018; Liu et al., 2021). The land use benefit system is essentially a subsystem of the land use system, and the latter reflects the reproductive process of land elements at multiple levels, such as population, economy, society, ecology, environment and others. Therefore, the ULU benefit system is a complex system in which socio-economic benefits and eco-environmental benefits are interrelated and mutually restrictive, together constituting important dimensions of the system. The coupling and coordination relationship between the two is crucial to the significant improvement of the overall efficiency of ULU.
As a key link between the realization of urban socio-economic benefits and eco-environmental benefits, urban land plays a key role in urban development at all levels. Nevertheless, a strategy of only promoting an eco-friendly urban land supply structure and improving the urban green infrastructure cannot be used as a long-term solution for optimizing the carrying capacity of the urban ecological environment. In fact, balancing and coordinating the benefit realization level and sustainable realization ability between subsystems of the ULU system can significantly improve the comprehensive benefit of ULU. Only in this way can the conflict in the ULU benefit system be effectively reduced, the operational efficiency of the urban spatial organization be significantly improved, and the sustainable development of the regional economy be notably promoted (Fig. 2). Therefore, the conflict and substitution between the socio- economic benefits and the eco-environmental benefits of ULU constitute a realistic necessity for the coupling relationship between the two, and the mutual supporting relationship contained therein constitutes its logical possibility.
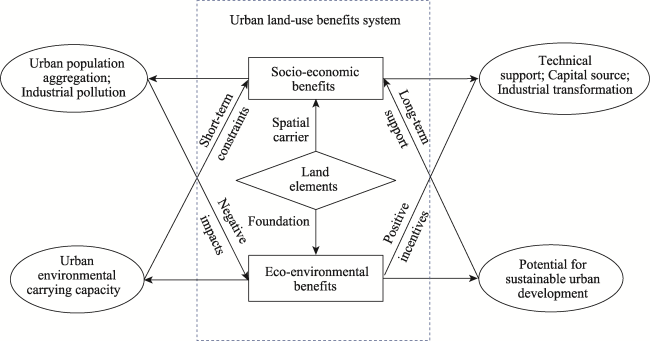
Fig. 2 The internal working mechanism of the urban land use benefit system

2.3 The role of socio-economic benefits in the land-use benefits system

Socio-economic benefits have both negative and positive effects on ecological and environmental benefits. As a space carrier, urban land provides an important foundation for urban social and economic development, but the acceleration of urbanization and the development of social economy exert a negative influence on the urban ecological environmental system. The realistic demands of local governments, such as GDP preference and the explicit pursuit of political achievements, lead to an overemphasis on the social and economic benefits of urban land use policies in an extensive mode (Zhu et al., 2019). The blind pursuit of the social and economic benefits of urban land use brings about a negative impact on the realization of ecological and environmental benefits and the improvement of the comprehensive carrying capacity of the urban ecological environment (Chen et al., 2019). The rapid expansion of urban space in China has led to a series of ecological and environmental problems, such as arable land loss, soil sealing and pollution, water pollution, loss of biodiversity and many others.
Nevertheless, with the continuous development of the urban social economy, the urban land use structure and policy orientation will also continue to evolve, which will generate positive incentives for the improvement of urban ecological environmental quality (You et al., 2020). For example, the urban eco-environment can be improved by strengthening the construction of urban green infrastructure (Sen et al., 2018). The urban industrial structure can be transformed and upgraded under the pressure of the urban land scarcity caused by urban population aggregation (You and Yang, 2017; He et al., 2021). The efficiency of municipal solid waste management and urban environmental governance can be improved by the technological progress brought about by socio-economic development (Jiao et al., 2020; Gao et al., 2021). Therefore, the realization of the social and economic benefits of ULU will also provide key support for realizing urban ecological and environmental benefits and improving the urban comprehensive carrying capacity.

2.4 The role of eco-environmental benefits in the land-use benefits system

Eco-environmental elements not only restrict social and economic benefits in the short term but they also provide long-term support for them. The restriction in the short term is due to the local government’s one-sided pursuit of social and economic benefits from urban land use, which has a negative impact on the capacity of the urban ecological environment. Meanwhile, the continuous pursuit of socio- economic benefits by local governments also leads to the deterioration of the ability to realize eco-environmental benefits and the urban ecological environment carrying capacity (Liu et al., 2014; Chen et al., 2019). The long-term support mechanism is that the quantity, quality and intensive utilization potential of urban land elements under the constraint of ecological environment carrying capacity significantly affect the sustainable realization and potential for urban social and economic development. Improving the carrying capacity of the urban ecological environment will help to continuously release the potential of land elements, promote the transformation and upgrading of urban industries, and ultimately improve the potential of urban social and economic development in a significant way (Simwanda and Murayama, 2018; Liu et al., 2019).

3 Overview of the research area

Zhengzhou is located in the north-central part of Henan Province, bordered on the north by Yellow River, and administers over six districts, five cities and one county at present. As a traffic and information hub city, it is an important node city of economic construction along the “Belt and Road”, as well as a typical fast-expanding city in China. In 2018, Zhengzhou had a total population of 10.136 million, with an urban population of 7.438 million. Along with the construction of Zhengdong New District, Zhengxi New District, Zhengzhou Airport Economic Zone and Pingyuan New District, as well as the continuous acceleration of Zhengzhou-Kaifeng integration, and especially with Zhengzhou’s strategic positioning as the core city of Central Plains urban agglomeration, and the country’s first designation of Zhengzhou as the National Central City Construction Object in December 2016, the urban space expansion of Zhengzhou has gained key policy incentives. During the observation period of this study from 1998 to 2019, the urban space scale of the city has achieved rapid expansion. In 1998, the built-up area of Zhengzhou City was only 119.8 km2, but it then increased to 500.8 km2 in 2017 and reached 580.8 km2 in 2019, for an increase of 461 km2 in 22 years.
Along with the acceleration of the “villages inside cities” reconstruction plan and the construction of many new districts as mentioned above, Zhengzhou has obtained a large amount of stock and incremental land supply. At the same time, the city’s appearance has been significantly improved and tremendous socio-economic benefits have been obtained. However, in the process of rapid urban space expansion, the ecological corridors around the city are constantly broken-up, and the urban ecological environmental problems have gradually appeared. As a result, Zhengzhou, the National Central City Construction Object, is selected in this study as an individual case of a rapidly expanding city. This not only meets the criteria of representativeness and typification in case selection, but the relevant conclusions are also applicable to solving such problems in urban land use benefits to a certain extent.

4 Research methods

4.1 Index system and data sources

Based on the existing research, and considering the scientific validity and operability in the index selection, a four-category evaluation index system of urban land use was constructed using the categories of economic benefits, social benefits, environmental benefits and ecological benefits (Table 1). Among them, the economic benefit index evaluation system of urban land use was constructed on the basis of the relevant indexes of land use input and output, the social benefit index evaluation system was constructed based on social impact related indexes, the ecological benefit evaluation index system was constructed in the framework of the indexes related to industrial emissions and domestic pollution treatment, and the environmental benefit evaluation index system was constructed on the basis of the environment-related indexes in land use such as landscape greening. The final comprehensive evaluation index system of urban land use benefits includes 18 secondary indexes.
Table 1 Construction and explanation of the evaluation index system of urban land use benefits
System layer Index Index explanation
Social benefits of land use Built-up area (km2) Extent and trend of urban expansion
Urbanization rate (%) Degree of agglomeration of the registered population in the city
Road paving length (km) Degree of completeness of urban infrastructure
Number of full-time teachers (104) The city’s educational resources endowment
Number of hospital beds per 10000 people The city’s medical and health resources endowment
Economic benefits of land use GDP (108 yuan) The city’s economic development in a certain period of time
Average salary of employees (yuan) Average income level of employees in the city
Total retail sales of consumer goods (108 yuan) The improvement of people’s material and culture living standard in the city in a certain period of time
Per capita disposable income of urban residents (yuan) Living standards of residents’ families
Actual utilization of foreign direct investment (USD 104) Degree of the city’s opening to the outside world
Eco-environmental benefits of land use Green space rate in built-up area (%) Distribution scale of green space in urban area
Garden green area (ha) Scale of the green space in the area
Green coverage rate in built-up area (%) Degree of ecological greening in the city
Park area (ha) Distribution of urban ecological land
Industrial wastewater discharge (104 t) Scale of urban industrial development
Actual cleaning area (104 m2) City sanitation work capacity
Domestic garbage removal (104 t) Scale of urban sanitation equipment
Annual sewage discharge (104 m3) Extent of urban water consumption
The selection and construction of the index system is one of the key factors in urban land use benefit evaluation. In view of the vast territory of China and the large gaps between the north and the south and between the east and the west, as well as the great differences in climate, hydrology, landform, culture and other aspects among cities, a total of 18 indexes in four categories, such as the number of full-time teachers, the actual utilization of foreign direct investment, and the green space rate in built-up areas, were selected according to the urban characteristics of Zhengzhou on the basis of previous studies (Chen, 2002; Liao et al., 2002; Tan et al., 2003). Among the indexes representing the social benefits of urban land use, the built-up area, urbanization rate, length of road paving, number of full-time teachers and number of beds per ten thousand people, respectively reflect the social development and progress, the completeness of the urban infrastructure, education, health care and other elements in Zhengzhou.
Moreover, the indexes that characterize the economic benefits of urban land use, such as gross product value, average wages of employees, total retail sales of consumer goods, per capita disposable income of urban residents and actual use of foreign direct investment, reflect the market economy activity and the residents’ quality of life. Furthermore, the indexes that represent the eco-environmental benefits of urban land use, such as the green rate of built-up areas, the area of garden green space, the green coverage rate of built-up areas, the area of parks, the discharge of industrial wastewater, the actual cleaning area, the volume of household garbage and the annual discharge of sewage, reflect the degree of emphasis that Zhengzhou has attached to the living environment quality of residents in the process of its industrial development. Among these indexes, industrial wastewater discharge and annual sewage discharge are negative indexes, which means that the larger the value, the greater the negative impact of that index. In contrast, the other 16 indexes such as urbanization rate are positive, meaning that the larger the value, the greater the positive impact.
The data used in this study mainly came from three sources. First, the relevant data for the 18 evaluation indexes of urban land use benefits in Table 1 were mainly derived from the Zhengzhou Statistical Yearbook and Zhengzhou National Economic and Social Development Statistical Bulletin over the years. The data frequency is yearly, the data span is from 1998 to 2019, and the data for some indexes were obtained through calculations. To ensure the quality of the data, all the above data are from official statistical documents and tend to be relatively consistent in terms of statistical caliber. Considering that the urban land use benefit system is a comprehensive evolutionary process supported by multi-dimensional elements, there are significant differences in the impacts of individual indexes on the overall system operation. Consequently, it is necessary to quantitatively calculate the corresponding index weights through empirical methods and represent the impact of each index on the system by specific numerical values. Previous studies have mostly used the Delphi method to measure indicator weights, but its strong subjectivity may affect the validity of the relevant conclusions. Hence, the entropy value method is adopted in this study to determine the weights of the corresponding indexes (Table 2).
Table 2 Comprehensive evaluation index system of urban land use efficiency and its weight assignments
Target layer (system layer) Criterion layer Index layer Weight Dimension
Socio-economic benefits of land use Economic benefits of land use GDP (108 yuan) 0.0930 +
Average salary of employees (yuan) 0.0813 +
Total retail sales of consumer goods (108 yuan) 0.0969 +
Per capita disposable income of urban residents (yuan) 0.0811 +
Actual utilization of foreign direct investment (USD 104) 0.0947 +
Social benefits of land use Built-up area (km2) 0.0541 +
Urbanization rate (%) 0.0448 +
Road paving length (km) 0.0576 +
Number of full-time teachers (104) 0.0533 +
Number of hospital beds per 10000 people 0.0980 +
Eco-environmental benefits of land use Ecological benefit Green area rate in built-up area (%) 0.0396 +
Garden green area (ha) 0.0696 +
Green coverage rate of built-up area (%) 0.0548 +
Park area (ha) 0.0812 +
Environmental benefits Industrial wastewater discharge (104 t) 0.0452 -
Actual cleaning area (ha) 0.0518 +
Domestic garbage removal (104 t) 0.0730 +
Annual sewage discharge (104 m3) 0.0675 -
Second, the remote sensing data were obtained from the geospatial data cloud (http://www.gscloud.cn/) Landsat 4-5 TM, and Landsat 8 OLI_TIRS satellite imagery products. The time range includes two periods of image data in May 1998 and October 2019, with a spatial resolution of 30 m×30 m and a cloud content of less than 1% under natural conditions. The selected images are of high quality, laying the foundation for data authenticity in the later visual interpretation of images.
Third, the vector boundary data of Zhengzhou City were obtained from the geographic and national conditions monitoring cloud platform (http://www.dsac.cn/), with a resolution of 1: 100000 and a projection coordinate system of WGS-1984. ArcGIS software was used to cut the data into the city area of Zhengzhou, while ENVI5.3 software was used for post-classification and obtaining the land use status maps for 1998 and 2019.
As indicated in Table 1, the corresponding index weights were determined by the entropy method. After the standardization of related indexes (Song and Gao, 2008), the ratio (zij) of the j-th index value in the ith year to this index, the informational entropy (ej), redundancy (dj) and corresponding weight (wj) of the jth index can be calculated as follows:
$\left\{ \begin{array}{*{35}{l}} {{z}_{ij}}={{y}_{ij}}/\underset{i=1}{\overset{n}{\mathop{\mathop{\sum }^{}}}}\,{{y}_{ij}} \\ {{e}_{j}}=(-\underset{i=1}{\overset{n}{\mathop{\mathop{\sum }^{}}}}\,{{z}_{ij}}\times \ln {{z}_{ij}})/\ln n \\ {{d}_{j}}=1-{{e}_{j}} \\ {{w}_{j}}={{d}_{j}}/\underset{j=1}{\overset{m}{\mathop{\mathop{\sum }^{}}}}\,{{d}_{j}} \\ \end{array} \right.$
where zij represents the proportion of the j-th index to the index in the i-th year; yij represents the value of the j-th index in the i-th year; n is the number of sample years; ej is the informational entropy value of the j-th index; dj is the redundancy of the j-th index; wj is the weight of the j-th index; and m is the number of indexes.

4.2 The Coupling and Coordination Model

The equations (Xu et al., 2003) for the evolution of the urban land use benefit subsystems are as follows:
$\left\{ \begin{array}{*{35}{l}} M=d{{Q}_{1}}/dt={{f}_{1}}\left( {{Q}_{1}},{{Q}_{2}} \right) \\ N=d{{Q}_{2}}/dt={{f}_{2}}\left( {{Q}_{1}},{{Q}_{2}} \right) \\ \end{array} \right.$
where M and N represent the evolutionary state of the land use socio-economic benefit subsystem and eco-environmental benefit subsystem, respectively; Q1 and Q2 are the functions of land use socio-economic benefit and eco-environmental benefit, respectively; dQ1 is the derivative of Q1; dQ2 is the derivative of Q2; dt is the derivative of t; f1(Q1,Q2) represents the function after the derivation of the Q1 function; and f2(Q1,Q2) represents the function after the derivation of the Q2 function. The evolutionary velocity equations for the subsystems and the entire composite system are:
$\left\{ \begin{array}{*{35}{l}} {{V}_{M}}=dM/dt,{{V}_{N}}=dN/dt \\ V=f\left( {{V}_{M}},{{V}_{N}} \right) \\ \end{array} \right.$
where VM represents the speed of evolution of the land use socio-economic benefit subsystem; VN represents the speed of evolution of the land use eco-environmental benefit subsystem; V represents the speed of evolution of the overall system; dM is the derivative of M; and dN is the derivative of N.
The angle between the composite system trajectory and the horizontal axis of the coordinate system is the coupling degree, which is calculated as follows:
$\beta =\arctan ({{V}_{M}}/{{V}_{N}})$
where β represents the coupling degree; VM represents the speed of evolution of the land use socio-economic benefit subsystem; and VN represents the speed of evolution of the land use eco-environmental benefit subsystem.
Based on the coupling coordination degree, the coupling and coordination relationships between subsystems can be divided into four stages: low-level symbiosis (I) (β∈(‒90°, 0°)), coordinated development (II) (β∈(0°, 90°)), extreme development (III) (β∈(90°, 180°)) and regenerative development (IV) (β∈(‒180°, ‒90°)).
The coupling coordination degrees of the subsystems are calculated by the following formula:
$\left\{ \begin{array}{*{35}{l}} C=\sqrt{\left( {{Q}_{1}}\times {{Q}_{2}} \right)/{{\left( {{Q}_{1}}+{{Q}_{2}} \right)}^{2}}} \\ T=a{{Q}_{1}}+b{{Q}_{2}} \\ D=\sqrt{C\times T} \\ \end{array} \right.$
where C is the coupling coordination coefficient, and T is the comprehensive coordination index between subsystems. D represents the degree of coupling coordination, which reflects the coordination relationship between subsystems and their interaction coupling situation. a and b are the coefficients to be assigned. Since two subsystems are equally important, the assignments of the parameters a and b are both 0.5 in this study. The coordination relationship and interaction coupling characteristics between subsystems can be divided into nine types: extreme imbalance [0,0.2),moderate imbalance [0.2,0.3),mild imbalance [0.3,0.4),the verge of imbalance [0.4,0.5),minimal coordination [0.5,0.6),primary coordination [0.6,0.7),intermediate coordination [0.7,0.8),good coordination [0.8,0.9) and high-quality coordination [0.9,1.0].

4.3 Overall classification accuracy and Kappa coefficient

The overall classification accuracy is the ratio of the total number of correctly classified pixels to the total number of pixels. The number of correctly classified pixels is distributed along the diagonal of the confusion matrix, and the total number of pixels is equal to the total number of pixels of all real reference sources. More importantly, the Kappa coefficient is calculated by multiplying the sum of pixels of all real references by the sum of the diagonal of the confusion matrix, followed by subtracting the product of the number of real reference pixels in one class and the total number of classified pixels in that class, and then dividing it by the square of the total number of pixels, and subtracting the sum of the total number of true reference pixels and the total number of classified pixels in the class. In order to ensure the accuracy of the land use classification results, the remote sensing image data downloaded from the Landsat 4-5 and Landsat 8 platforms were subjected to pre-processing operations such as radiation calibration and atmospheric correction, the base map was scaled to the maximum for validation point selection according to the presentation of feature types on remote sensing images, and the basis for selecting the training validation points was “the Classification of Land Use Status (G/T21010-007)”. After the validation points were selected, a large number of sample points were selected to calculate the classification accuracy. More than 50 sample points were selected for each land use type, and the final classification of land use types was carried out for the whole city using the maximum likelihood method tool of ENVI software. The formula is as follows:
$\hat{K}=\frac{N\underset{K}{\overset{R}{\mathop{\mathop{\sum }^{}}}}\,{{X}_{KK}}-\mathop{\sum }^{}\left( {{X}_{K+}}{{X}_{+K}} \right)}{{{N}^{2}}-\mathop{\sum }^{}\left( {{X}_{K+}}{{X}_{+K}} \right)}$
where $\hat{K}$ represents the kappa coefficient; N represents the total number of sample points; R represents the number of rows in the confusion matrix; XKK represents the value in row K and column K (main diagonal); XK+ represents the sum of row K and X+K represents the sum of column K.

4.4 Transfer matrix of urban land use types

The initial image data were preprocessed by radiometric calibration and atmospheric correction on the ENVI platform. Adopting the supervised classification method, the remote sensing image map was classified according to the calculation results of the support vector machine (SVM). Finally, the land use status maps for 1998 and 2019 were obtained. This study post-classified the satellite remote sensing image maps for 1998 and 2019, distinguished the land cover types, and calculated the land use type transfer matrix. According to the research needs and urban characteristics, the land use types of Zhengzhou were mainly divided into six types: construction land, arable land, grassland, woodland, water area, and sandy land. As revealed by field observations, one of the notable features of urban spatial expansion lies in the expansion of urban construction land, and the declines in the farmland, grassland and other land types. Based on the analysis of the coupling and coordination relationship between socio-economic benefits and eco-environmental benefits of urban land use, the realistic expansion trend of the city was displayed in a more intuitive image and the conversion range was also quantitatively analyzed. The land use transfer matrix was calculated through the confusion matrix on the ENVI5.3 platform, revealing the law governing urban land use changes in the main urban area of Zhengzhou from 1998 to 2019.

5 Results and discussion

5.1 The coupling relationship analysis

Based on the equation for the evolution of the urban land use benefit system, the non-linear fitting of the scatter plots of the benefit values of the two subsystems in the observation period was performed to obtain the functional expression of the urban land use benefit evolutionary curve. By taking the derivative of the variable t, the velocity equation for the evolution of the urban land use benefit subsystem was obtained, and the coupling degree of the urban land use benefit subsystem was calculated, as shown in Fig. 3. The coupling relationship between the land use benefit subsystems of Zhengzhou presents a typical inverted U-shaped evolutionary process. The data in Table 3 show that the socio-economic benefit and eco-environmental benefit values of land use in 1998 were 0.0036 and 0.0310, respectively, with a coupling degree between subsystems of 9.26°. The urban land use benefit system belonged to the “eco- environmental benefit type” and took the so-called “green city” as a city symbol. In 2012, the coupling degree between subsystems reached a maximum of 62.37°, representing an increase of 53.11° compared with the year 1998. The socio-economic benefit and eco-environmental benefit values of land use in 2012 were 0.3925 and 0.2334, respectively, which led to an urban land use benefit system of the “socio-economic benefit type”.
Fig. 3 Coupling degree and coordination degree of land use benefits in Zhengzhou from 1998 to 2019
Table 3 The coupling and coordination relationship of the land use benefit subsystems in Zhengzhou from 1998 to 2019
Year Coupling
degree
Coupling
relationship
Coordination degree Coordination
relationship
Socio-
economic benefit
Eco-environmental benefit Comprehensive benefit Land use benefit system type
1998 9.26 C.D. (II) 0.0729 Extreme imbalance 0.0036 0.0310 0.0346 Eco-environmental
1999 26.51 C.D. (II) 0.0927 Extreme imbalance 0.0105 0.0279 0.0385 Eco-environmental
2000 37.88 C.D. (II) 0.1019 Extreme imbalance 0.0163 0.0264 0.0428 Eco-environmental
2001 45.29 C.D. (II) 0.1309 Extreme imbalance 0.0275 0.0426 0.0702 Eco-environmental
2002 50.27 C.D. (II) 0.1667 Extreme imbalance 0.0439 0.0703 0.1142 Eco-environmental
2003 53.74 C.D. (II) 0.1962 Moderate imbalance 0.0649 0.0912 0.1562 Eco-environmental
2004 56.23 C.D. (II) 0.2080 Moderate imbalance 0.0878 0.0852 0.1730 Eco-environmental
2005 58.06 C.D. (II) 0.2483 Moderate imbalance 0.1086 0.1402 0.2487 Eco-environmental
2006 59.41 C.D. (II) 0.2635 Moderate imbalance 0.1394 0.1382 0.2776 Socio-economic
2007 60.42 C.D. (II) 0.2852 Moderate imbalance 0.1763 0.1501 0.3264 Socio-economic
2008 61.16 C.D. (II) 0.3127 Mild imbalance 0.2201 0.1737 0.3938 Socio-economic
2009 61.69 C.D. (II) 0.3286 Mild imbalance 0.2531 0.1843 0.4374 Socio-economic
2010 62.05 C.D. (II) 0.3476 Mild imbalance 0.2772 0.2105 0.4878 Socio-economic
2011 62.27 C.D. (II) 0.3742 Mild imbalance 0.3421 0.2294 0.5714 Socio-economic
2012 62.37 C.D. (II) 0.3890 Mild imbalance 0.3925 0.2334 0.6259 Socio-economic
2013 62.37 C.D. (II) 0.4080 The verge of imbalance 0.4311 0.2571 0.6881 Socio-economic
2014 62.27 C.D. (II) 0.4299 The verge of imbalance 0.4791 0.2851 0.7641 Socio-economic
2015 62.09 C.D. (II) 0.4688 The verge of imbalance 0.5233 0.3692 0.8925 Socio-economic
2016 61.82 C.D. (II) 0.4732 The verge of imbalance 0.5772 0.3475 0.9247 Socio-economic
2017 61.48 C.D. (II) 0.4916 The verge of imbalance 0.6346 0.3683 1.0029 Socio-economic
2018 61.06 C.D. (II) 0.5146 Minimal coordination 0.7054 0.3975 1.1029 Socio-economic
2019 60.57 C.D. (II) 0.5331 Minimal coordination 0.7547 0.4281 1.1829 Socio-economic

Note. C.D. (II) indicates the coordinated development stage (II).

With the rapid urbanization since 1998, the socio-economic benefits of land use in Zhengzhou have continuously substituted for the eco-environmental benefits, as can be seen in Fig. 4. Meanwhile, the absolute differences between the two have also evolved from small fluctuations from 1998 to 2005 into continuous growth from 2006 to 2019. During the observation period from 1998 to 2019, the overall scale of urban space in Zhengzhou has achieved rapid expansion. This has imposed constraints on the realization of the eco-environmental benefits of urban land use, which will be analyzed quantitatively in the next section. In 2017, the growth rate of Zhengzhou’s urban built-up area reached 6.78%, and the socio-economic benefit and the eco-environmental benefit values of land use were 0.7547 and 0.4281, respectively. The urban land use benefit system belonged to the “socio-economic benefit type”. Therefore, during the observation period, the urban land use benefit system of Zhengzhou has experienced two stages of evolution: the “Eco-environmental benefit type” from 1998 to 2005 and the “Socio-economic benefit type” from 2006 to 2019. The coupling relationship between the socio-economic benefit subsystem and the eco-environmental benefit subsystem remained continuously in a coordinated development (II) state.
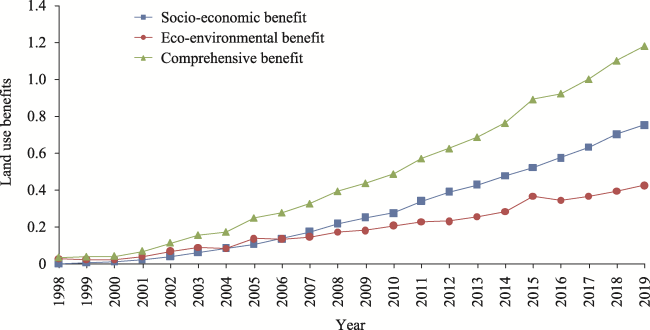
Fig. 4 Land use benefits in Zhengzhou from 1998 to 2019

Note: The evaluation index on the ordinate axis is dimensionless, so it has no units.

5.2 Coordination relationship analysis

As shown in Fig. 3, the coordination relationship between subsystems experienced the following five stages of evolution: extreme imbalance (1998-2002), moderate imbalance (2003-2007), mild imbalance (2008-2012), the verge of imbalance (2013-2017) and minimal coordination (2018- 2019). From 1998 to 2002, the coordination degree between subsystems was between 0 and 0.2, showing the “extreme imbalance” characteristic. At this stage, the operating performance of the eco-environmental benefit subsystem was better than that of the socio-economic benefit subsystem, but the coordination between the two was insufficient. At the same time, the supporting role of the urban ecological environment in social and economic development had not yet appeared, resulting in the relatively low overall operation performance of the land use benefit system (that is, the comprehensive benefit), which fluctuated between 0.0346 and 0.1142.
From 2003 to 2007, the coordination degree between subsystems was between 0.2 and 0.3. The coordination relationship was in the “moderate imbalance” state, and the coordination had improved compared with the previous stage. At this stage, the gap in operating performance between the subsystems began to gradually narrow, and was reversed in 2005. This transition was a process in which the coordination between subsystems tended to improve, and in a sense, it also characterizes the supporting role of the eco-environmental benefits of land use on the realization of socio-economic benefits.
From 2008 to 2012, the coordination degree between subsystems was between 0.3 and 0.4, so it was in the “mild imbalance" state. At this stage, the operating performance of the socio-economic benefit subsystem was significantly better than that of the eco-environmental benefit subsystem.
From 2013 to 2017, the coordination degree between subsystems was between 0.4 and 0.5, which represented a stage of “the verge of imbalance”. Both the coordination between subsystems and their operational performance had improved, and the operating performance of the socio-economic benefit subsystem was better than that of the eco-environment benefit subsystem. As a typical “water scarcity” city, Zhengzhou launched the construction of the national pilot city of water ecological civilization in 2014, and also implemented a package of protection plans for the urban water system and the ecological environment. With the subsequent slowdown of urban space expansion and the continuous strengthening of ecological environmental protection, the growth of the eco-environmental benefits of urban land use was still slow, which led to the relative lag in the evolution of this subsystem.
From 2018 to 2019, the coordination degree between subsystems was between 0.51 and 0.53. Therefore, the coordination relationship between the socio-economic benefit and the eco-environmental benefit of urban land use fell in the “minimal coordination” state, but the former still continuously replaced the latter.

5.3 Comprehensive analysis on the coupling and coordination relationship of the land use system

During the observation period (1998-2019), the coupling relationship between subsystems was good, with the progression from the extreme imbalance, moderate imbalance, mild imbalance, the verge of imbalance to minimal coordination, showing a continuous evolutionary trend on the whole. The land use benefit system has gradually changed from the “eco-environmental benefit type” (1998-2005) to the “socio-economic benefit type” (2006-2019). From 1998 to 2002, the land use benefit system was of the “eco-environmental benefit type”, the coupling relationship between subsystems was in a situation of coordinated development, and the coordination relationship reflected an extreme imbalance situation. From 2003 to 2007, it evolved into a “socio-economic benefit type”. The coupling relationship between subsystems was still in a situation of coordinated development, but the coordination relationship was transformed into a state of moderate imbalance. From 2008 to 2012, the operating performance of the socio-economic benefit subsystem was significantly better than that of the eco-environmental benefit subsystem, while the coupling relationship between the subsystems remained unchanged and the coordination relationship achieved mild imbalance.
From 2013 to 2017, the land use benefit system belonged to the “socio-economic benefit type”. The coupling relationship between subsystems was still in a state of coordinated development, while the coordination relationship was gradually transformed into “the verge of imbalance”, indicating that the coordination relationship between the subsystems tended to improve. From 2018 to 2019, the land use benefit system was still in a coordinated development state, while the coordination relationship had been converted to minimal coordination, which is a strong indication that the socio-economic benefits and eco-environmental benefits of land use in Zhengzhou had embarked on the express train of harmonious development. In general, over the observation period of this article (1998-2019), Zhengzhou, as a typical representative of rapidly expanding cities, showed dynamic evolutionary features in the coupling and coordination relationship between the subsystems of urban land use benefit, which imposes a great constraint on the realization and improvement of the operational performance of the urban land use benefit system. Based on the characteristics of the urban land use benefit system and the evolution of the coupling and coordination relationship between the subsystems, differentiated ULU strategies should be implemented to maximize the comprehensive benefits and sustainable use capacity of the urban land.

5.4 Transfer matrix analysis

With the help of remote sensing image interpretation on the ENVI platform, Zhengzhou’s land use types were divided into six categories: construction land, arable land, grassland, woodland, water area and sandy land. After verifying the supervised classification results, the overall accuracy was 98.77% in 1998 and 84.82% in 2019, while the kappa coefficients were 0.98 in 1998 and 0.80 in 2019. Therefore, the classification results were ideal, providing effective support for the subsequent research and analysis. For the classification accuracy results, a kappa coefficient greater than 0.8 indicates that the classification results are highly consistent, and the values for both years in this study are greater than or equal to 0.8, so the errors caused by the subsequent calculations should be negligible. However, there are several reasons behind the large difference in overall classification accuracy. For example, the 1998 remote sensing image data source was Landsat 4-5 satellites while the 2009 remote sensing satellite data were from Landsat 8 satellites, which resulted in differences in map resolution quality. In addition, the variability in the selection of validation points and sample points during the actual operation also resulted in a higher overall classification accuracy, but the effect was minor in the overall view. In the land use status map obtained from the interpretation of remote sensing images, it can be clearly seen that the city’s rapid expansion is obviously manifested by the increase in construction land and the declines in arable land, grassland and woodland. Figure 5 shows the land use status map of the main urban area of Zhengzhou in 1998 and 2019. Through the further analysis of the transfer matrix, the transformation amplitude of each land cover type can be observed intuitively. The land use transfer matrix describes the conversion of a certain land cover type during different periods in a region, which reflects the utilization intensity and the trend of a certain land cover type. Table 4 represents the land use transfer matrix of Zhengzhou with 1998 as the starting year and 2019 as the ending year.
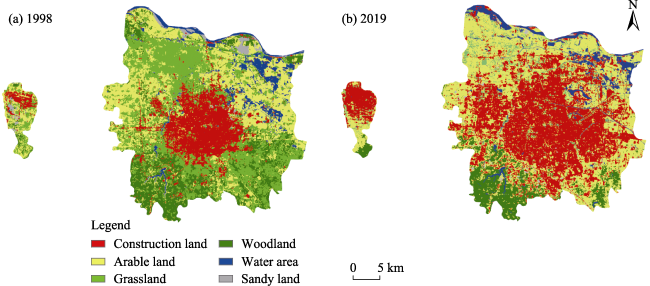
Fig. 5 Evolution of land use types in Zhengzhou from 1998 to 2019

Note: The small image on the left represents Shangjie District, one of the 6 districts under the jurisdiction of Zhengzhou City.

Table 4 The transfer matrix of urban land use in Zhengzhou from 1998 to 2019
2019 1998
Construction land Arable land Grassland Woodland Water area Sandy land
% km2 % km2 % km2 % km2 % km2 % km2
Construction land 88.01 161.75 33.23 102.52 39.01 132.33 24.99 46.22 23.46 13.36 25.96 4.91
Arable land 5.82 10.69 47.19 145.59 40.66 137.91 35.13 64.97 25.11 14.29 41.66 7.88
Grassland 4.11 7.55 8.14 25.13 9.83 33.35 3.88 7.18 7.53 4.29 9.71 1.84
Woodland 0.33 0.61 4.48 13.83 8.08 27.42 32.69 60.46 0.43 0.24 0.36 0.07
Water area 0.97 1.77 6.00 18.50 1.42 4.81 1.96 3.62 42.51 24.20 18.32 3.46
Sandy land 0.76 1.4 0.93 2.86 0.97 3.29 1.32 2.44 0.89 0.51 3.98 0.75

Note: The % and km2 headers indicate the percentage and area of a site type shifting to other site types from 1998 to 2019. For example, (88.01, 161.75) indicates that from 1998 to 2019, 88.01% of the construction land remained construction land with an area of 161.75 km2; and (33.23, 102.52) indicates that from 1998 to 2019, 33.23% of the arable land was converted to construction land with a conversion area of 102.52 km2.

This section uses the land use matrix analysis as a supplementary analysis to reveal the dynamic land use change process from a spatial perspective, and the response of the ongoing impact of land use type transformation on land use effectiveness. The impacts brought about by land use change are, on the one hand, structural changes in land use, but on the other hand, they are changes in the benefits created by land use change, including socio-economic benefits and ecological and environmental benefits. As an important part of the terrestrial ecosystem, structural changes in urban land will affect natural factors such as the atmosphere, soil, vegetation, water resources and biodiversity, thus having an obvious impact on the ecological environment. On the other hand, urban land change will not only directly affect human socio-economic development, but it will also have a greater impact on socio-economic development indirectly through its effect on the ecological environment.
This analysis found that the land use types with the largest conversion range in Zhengzhou from 1998 to 2019 were grassland, arable land, woodland, and water areas. Among them, 39.01% of grassland was converted to construction land, totaling 132.33 km2; 33.23% of arable land was converted to construction land, totaling 102.52 km2; 24.99% of woodland was converted to construction land, totaling 46.22 km2; and 23.46% of water areas were converted to construction land, with a total of 13.36 km2. Since the sandy land is mainly located on the banks of the Yellow River, it is difficult to convert it into construction land, and only 4.91 km2 of it was converted into urban construction land during the 22 years. In the same period, Zhengzhou’s urban built-up area expanded from 119.8 km2 in 1998 to 580.8 km2 in 2019, a total increase of 461 km2. This urban space expansion process mainly depended on changes in the use and occupation of arable land, woodland and grassland around the city. In the early stage of spatial expansion with a relatively sufficient land supply, the economic and social development of Zhengzhou obtained a significant “land dividend”, and its land use benefit type has also changed from an ecological benefit preference to a social and economic benefit preference since 2006. Since then, the social and economic benefits of land use in Zhengzhou have continuously replaced the ecological and environmental benefits. The realization of the comprehensive benefits of urban land use and the improvement of the city’s comprehensive carrying capacity are both restricted to a certain extent. However, the local governments have basically maintained the harmonious coexistence between ecological and environmental protection and social and economic development by implementing both urban boundary control policies and construction land reduction policies. The coupling and coordination relationship between the socio-economic benefit and eco-environmental benefit subsystems of urban land use has also been relatively improved. In 2018, Zhengzhou broke the thresholds of one trillion yuan in economic aggregate, ten million in population and 100000 yuan in per capita income, and became the fourth largest city in north China after Peking, Tianjin and Tsingtao.

6 Conclusions and implications

By sorting out the coupling and coordination relationship of the urban land use benefit system and its working mechanism, the evaluation index system and the coupling and coordination relationship model of urban land use were constructed. Taking Zhengzhou, the national central city construction target, as the actual observation object, in combi- nation with an analysis of the land use transfer matrix, this study investigated the evolutionary law governing land use- benefit system, the dynamic coupling and coordination relationship, as well as the land use matrix transformation logic of rapidly expanding cities, and reached several conclusions.
First, during the observation period from 1998 to 2019, the land use benefit system of Zhengzhou gradually changed from an eco-environmental benefit type (1998-2005) to a socio-economic benefit type (2006-2019). The absolute difference between the two benefits increased from 0.0273 in 1998 to 0.3266 in 2017, revealing the continuous substitution of socio-economic benefits of urban land use for eco-environmental benefits in the process of rapid urbanization. Second, the land use benefit subsystem of Zhengzhou is in the second level of the coupling relationship, namely, the coordinated development stage, but the specific coupling level has undergone a process of continuous evolution. The coupling degree between subsystems continued to increase year by year, from a minimum of 9.26° in 1998 to a maximum of 62.37° in 2012, and then it decreased gradually to 60.57° in 2019, presenting an inverted U-shaped evolutionary process in general. Third, the coordination relationship of the land use benefit subsystem in Zhengzhou presents a trend of continuous improvement that can be divided into five stages: severe imbalance (1998-2002), moderate imbalance (2003-2007), mild imbalance (2008-2013), the verge of imbalance (2014-2017) and minimal coordination (2018-2019). Fourth, during the past 22 years, from 1998 to 2019, the urban space of Zhengzhou has rapidly increased by 461 km2. As shown by the results of the land use transfer matrix, Zhengzhou’s land use types with the largest conversion ranges during this period were grassland, arable land, woodland, and water areas in sequence. Among them, 39.01% of grassland (132.33 km2), 33.23% of arable land (102.52 km2), 24.99% (46.22 km2) of woodland, and 23.46% (13.36 km2) of water area have been continuously converted into urban construction land in the past 22 years, while only 4.91 km2 of sandy land on the southern bank of the Yellow River has been converted. The rapid expansion of urban space in a limited period of time has had a negative impact on the urban ecological environment, but the local government has basically maintained the harmonious symbiosis between eco-environmental protection and socio- economic development by implementing policies for both urban boundary control and construction land reduction. In fact, the coupling and coordination relationship between the socio-economic benefit and eco-environmental benefit subsystems of urban land use has also been relatively improved.
Based on these conclusions, several policy suggestions are proposed. First, it is necessary to actively grasp the opportunity of urban boundary delineation in order to promote urban transformation and upgrading as well as ecological city construction. The Zhengzhou Municipal Government should 1) Choose an accurate development path and constantly promote the upgrading and transformation of the city, 2) Strictly observe the “ecological bottom line” of urban land use and build a real-time monitoring system for urban ecology, and 3) Promote the construction of ecological city actively and enhance the city’s sustainable operation capacity. The Zhengzhou Municipal Government should insist on the combination of urban boundary delineation and dynamic adjustment, and explore a feasible path that balances ecological safety bottom-line protection and dynamic urban development needs, in order to ultimately guide and constrain the orderly development of urban space. Second, it is essential to continuously promote the optimization of urban land use patterns. The government needs to continue to reduce its “profit margins” in land transfers, which can force it to rationally return from “incremental development preference” to “stock development preference”. Zhengzhou should also further strengthen the intensive and economical use of urban land, create a friendly land use system, include the comprehensive benefits of urban land use in the performance evaluation system of grassroots officials, and correct the behavior of “blindly granting urban land for economic benefits”. Third, it is crucial to promote the rational return of local governments to the basic functions of land management. The government should improve the management and control system of land transfer revenue and expenditure, and weaken the monopolistic property of land transactions. In general, Zhengzhou City should pay more attention to the synergistic development of urban economic growth and urban ecological protection in the process of rapid urbanization, while simultaneously developing a more reasonable urban master plan and strengthening the supervision and control by the relevant departments, which will ultimately provide key support for high-quality urban development.

The authors wish to thank the anonymous reviewers and editors for their helpful reviews and critical comments.

[1]
Bennett R, Tambuwala N, Rajabifard A, et al. 2013. On recognizing land administration as critical, public good infrastructure. Land Use Policy, 30(1): 84-93.

[2]
Camagni R, Gibelli M C, Rigamonti P. 2002. Urban mobility and urban form: The social and environmental costs of different patterns of urban expansion. Ecological Economics, 40(2): 199-216.

[3]
Chen B M. 2002. Design and evaluation of indicator system of regional land for sustainable use. Progress in Geography, 21(3): 204-215. (in Chinese)

[4]
Chen D L, Lu X H, Liu X, et al. 2019. Measurement of the eco-environmental effects of urban sprawl: Theoretical mechanism and spatiotemporal differentiation. Ecological Indicators, 105: 6-15.

[5]
Chen L S. 2011. Study on the eco-environmental effects of Lianyungang City caused by rapid urbanization. Journal of Anhui Agricultural Sciences, 39(23): 14468-14470, 14472. (in Chinese)

[6]
Cong D M, Zhao S H, Yu T, et al. 2018. Urban growth boundary delimitation method integrating comprehensive ecological security pattern and urban expansion simulation—A case study of planning areas in Tianshui City (2015-2030). Journal of Natural Resources, 33(1): 14-26. (in Chinese)

[7]
Gao P P, Li Y P, Gong J W, et al. 2021. Urban land-use planning under multi-uncertainty and multiobjective considering ecosystem service value and economic benefit—A case study of Guangzhou, China. Ecological Complexity, 45(3): 100886. DOI: 10.1016/j.ecocom.2020.100886.

[8]
He C C, Han Q, de Vries B, et al. 2017. Evaluation of sustainable land management in urban area: A case study of Shanghai, China. Ecological Indicators, 80(9): 106-113.

[9]
He W K, Yang J, Li X S, et al. 2021. Research on the interactive relationship and the optimal adaptation degree between land use benefit and industrial structure evolution: A practical analysis of Jiangsu Province. Journal of Cleaner Production, 303: 127016. DOI: 10.1016/j.jclepro.2021.127016.

[10]
Hersperger A M, Oliveira E, Pagliarin S, et al. 2018. Urban land-use change: The role of strategic spatial planning. Global Environmental Change, 51: 32-42.

[11]
Hu F, Ke X L, Chai M, et al. 2019. Determining the urban growth boundary by balancing urban expansion and permanent basic farmland protection: A case study of Wuhan. Geography and Geo-Information Science, 35(3): 72-77. (in Chinese)

[12]
Hu P P, Li F, Hu D, et al. 2021. Spatial and temporal characteristics of urban expansion in Pearl River Delta urban agglomeration from1980 to 2015. Acta Ecologica Sinica, 41(17): 7063-7072. (in Chinese)

[13]
Huang K, Dai W Y, Huang W L, et al. 2020. Study on land reserve potential evaluation and layout with rapid urban expansion: A case study of Ningde main urban area. Areal Research and Development, 39(2): 137-142. (in Chinese)

[14]
Hui E, Wu Y Z, Deng L J, et al. 2015. Analysis on coupling relationship of urban scale and intensive use of land in China. Cities, 42: 63-69.

[15]
Jenerette D G, Potere D. 2010. Global analysis and simulation of land-use change associated with urbanization. Landscape Ecology, 25(5): 657-670.

[16]
Jia Q, Yun Y X, Yin Z K. 2014. Spatial and temporal coupling analysis of land use efficiency and urbanization level of city-regions—An empirical study of three big city-regions in China. Modern Urban Research, 28(8): 9-13. (in Chinese)

[17]
Jiao L M, Xu Z B, Xu G, et al. 2020. Assessment of urban land use efficiency in China: A perspective of scaling law. Habitat International, 99: 102172. DOI: 10.1016/j.habitatint.2020.102172.

[18]
Kong X S, Liu Y F, Tan C F. 2009. Correlation analysis of the changes of land use structure and land use efficiency: A case study of Jiayu County in Hubei Province. Resources Science, 31(7): 1095-1101. (in Chinese)

[19]
Li C X, Wu K N, Liu P J, et al. 2017. Research on the economic benefits and development types of urban land utilization: Taking the Beijing-Tianjin-Hebei region as an example. Jiangsu Agricultural Sciences, 45(3): 281-286. (in Chinese)

[20]
Li Y, Meng D, Ye H. 2021. Spatiotemporal pattern and driving forces of typical Russian cities: Based on remote sensing decision fusion and multiple discrete regression model. Geographical Research, 40(11): 2967-2985. (in Chinese)

[21]
Liang H M, Liu W D, Liu H P, et al. 2008. Coupling relationship between socio-economy benefits and eco-environment benefits of land use in Shenzhen City. Scientia Geographica Sinica, 28(5): 636-641. (in Chinese)

[22]
Liao H P, Shen Q, Liao W L, et al. 2002. Research on establishing the evaluation index system for sustainable and use of small town. Economic Geography, 22(S1): 82-85. (in Chinese)

[23]
Liu J H, Huang L C, Zuo Q T, et al. 2021. Evaluation of harmonious development of economy-population-resource-environment in the lower reaches of the Yellow River. Resources Science, 43(2): 412-422. (in Chinese)

[24]
Liu S C, Ye Y M, Zhong S Q. 2020. Research on shift route of gravity center and decoupling relationship between urban land expansion and economic growth in China. Resources and Environment in the Yangtze Basin, 29(12): 2563-2571. (in Chinese)

[25]
Liu W, Zhan J Y, Zhao F, et al. 2019. Impacts of urbanization-induced land-use changes on ecosystem services: A case study of the Pearl River Delta Metropolitan Region, China. Ecological Indicators, 98: 228-238.

[26]
Liu Y, Qi Z F, Cai W B, et al. 2013. The control approach of the construction land disorder sprawl based on ecosystem service evaluation—A case study of Fuzhou. Journal of Fudan University (Natural Science), 52(6): 836-844. (in Chinese)

[27]
Liu Y S, Fang F, Li Y H. 2014. Key issues of land use in China and implications for policy making. Land Use Policy, 40: 6-12.

[28]
Lu X H, Ke S G. 2018. Evaluating the effectiveness of sustainable urban land use in China from the perspective of sustainable urbanization. Habitat International, 77: 90-98.

[29]
Niu W T, Nie T, Chen X, et al. 2022. Understanding the corrective effect of the urban growth boundary policy on land finance dependence of local governments in China. International Journal of Environmental Research and Public Health, 19(8): 4785. DOI: 10.3390/ijerph19084785.

[30]
Ouyang X, Zhu X, He Q. 2020. Study of spatio-temporal pattern and driving mechanism of urban land expansion in urban agglomeration: A case study of the Changsha-Zhuzhou-Xiangtan urban agglomeration. Resources and Environment in the Yangtze Basin, 29(6): 1298-1309. (in Chinese)

[31]
Ren P. 2006. Space justic—Contemporary China towards the sustainable urbanization. Urban Development Studies, 13(5): 1-4. (in Chinese)

[32]
Şen G, Güngör E, Şevik H. 2018. Defining the effects of urban expansion on land use/cover change: A case study in Kastamonu, Turkey. Environmental Monitoring and Assessment, 190(8): 454. DOI: 10.1007/s10661-018-6831-z.

[33]
Sheng Y X, Liu Q, Ou M H, et al. 2014. The Kuznets Curve relationship between urban land expansion and economic development across 13 municipalities in Jiangsu. Resources Science, 36(2): 296-302. (in Chinese)

[34]
Simwanda M, Murayama Y. 2018. Spatiotemporal patterns of urban land use change in the rapidly growing city of Lusaka, Zambia: Implications for sustainable urban development. Sustainable Cities and Society, 39: 262-274.

[35]
Song G, Gao N. 2008. Economic benefit analysis of urban land utilization based on DEA method—A case of Harbin City. Scientia Geographica Sinica, 28(2): 185-188. (in Chinese)

[36]
Song X Q, Chang K T, Yang L, et al. 2016. Change in environmental benefits of urban land use and its drivers in Chinese cities, 2000-2010. International Journal of Environmental Research and Public Health, 13(6): 535. DOI: 10.3390/ijerph13060535.

[37]
Tan S K, Qi R. 2011. Land expropriation conflicts during rapid urban expansion. China Land Science, 25(3): 26-30. (in Chinese)

[38]
Tan Y Z, Wu C M, Ye Z X, et al. 2003. The indicator system and method to assess the sustainability of urban land use. China Soft Science, (3): 139-143. (in Chinese)

[39]
Tian J F, Wang B Y, Wang S J. 2019. Urban land use efficiency and its coupling relationship in the three provinces of Northeast China. Scientia Geographica Sinica, 39(2): 305-315. (in Chinese)

[40]
Wei Y D, Ewing R. 2018. Urban expansion, sprawl and inequality. Landscape and Urban Planning, 177: 259-265.

[41]
Wu J H, Wu K N, Li C X, et al. 2017. Coupling coordination degree and spatial analysis on economic benefit of land utilization—A case study in Beijing, Tianjin and Hebei region. Chinese Journal of Agricultural Resources and Regional Planning, 38(6): 38-44. (in Chinese)

[42]
Xi J, Zhang Y, Yang X Q. 2013. Evaluation on the coupling and coordination development between urban land use benefits and urbanization in Shaanxi Province. Journal of Central China Normal University (Natural Sciences), 47(1): 117-123. (in Chinese)

[43]
Xu X R, Wu Z J, Zhang J Y, et al. 2003. Research on the path and early warning of sustainable development. Mathematics in Practice and Theory, 33(2): 31-37. (in Chinese)

[44]
Yang J X, Li Y. 2020. Research on the influence of urban expansion on the price of commercial housing—Panel data analysis based on 277 cities. Prices Monthly, 41(9): 1-6. (in Chinese)

[45]
Yang Y Z, Feng Z M, Zhao Y D, et al. 2013. Coordination between urban land expansion and population growth in China. Geographical Research, 32(9): 1668-1678. (in Chinese)

[46]
Ye H, Wei D. 2018. Urban expansion, sprawl and inequality. Landscape and Urban Planning, 177: 259-265.

[47]
You H Y, Yang X F. 2017. Urban expansion in 30 megacities of China: Categorizing the driving force profiles to inform the urbanization policy. Land Use Policy, 68: 531-551.

[48]
You L, Li Y R, Wang R, et al. 2020. A benefit evaluation model for build-up land use in megacity suburban districts. Land Use Policy, 99: 104861. DOI: 10.1016/j.landusepol.2020.104861.

[49]
Zhang J F, Zhang A L, Dong J. 2014. The evaluation on land use efficiency and an analysis on its temporal- spatial differences of Wuhan urban agglomeration. East China Economic Management, 28(5): 60-64. (in Chinese)

[50]
Zhang M D, Mo D Y. 2014. Coupling coordination degree of urban land use benefit and urbanization. Resources Science, 36(1): 8-16. (in Chinese)

[51]
Zhao A Z, Pei T, Cao S, et al. 2020a. Impacts of urbanization on vegetation growth and surface urban heat island intensity in the Beijing-Tianjin- Hebei. China Environmental Science, 40(4): 1825-1833. (in Chinese)

[52]
Zhao C, Pan X Y, Li H B, et al. 2020b. Urban private traffic, urban expansion and PM 2.5 pollution: On panel data of 65 large and medium-sized cities in China. Finance and Trade Research, 31(10): 20-29. (in Chinese)

[53]
Zhen J H, Wang Y F, Tian Y Y, et al. 2019. Study on ecological environment effects of urban spatial expansion: Taking Inner Mongolia Hohhot City as an example. Geographical Research, 38(5): 1080-1091. (in Chinese)

[54]
Zhou Y, Huang X J, Xu G L, et al. 2016. The coupling and driving forces between urban land expansion and population growth in Yangtze River Delta. Geographical Research, 35(2): 313-324. (in Chinese)

[55]
Zhu X H, Zhang P F, Wei Y G, et al. 2019. Measuring the efficiency and driving factors of urban land use based on the DEA method and the PLS-SEM model—A case study of 35 large and medium-sized cities in China. Sustainable Cities and Society, 50: 101646. DOI: 10.1016/j.scs.2019.101646.

Outlines

/