Ecosystem Services and Sustainable Development

Changes in the “Production-Living-Ecological Space” Pattern in the Interlocking Mountain and River Zones of the Yellow River Basin—Taking Xinxiang City as an Example

  • ZOU Zeduo , 1, 2 ,
  • YOU Mou 1, 2 ,
  • ZHAO Wei , 1, 2, * ,
  • FU Canfang 1, 2 ,
  • ZHANG Wenwen 1, 2 ,
  • HE Zhixiao 1, 2
Expand
  • 1. College of Geography and Environmental Science, Henan University, Kaifeng, Henan 475004, China
  • 2. National Experimental Teaching Demonstration Center of Environment and Planning, Kaifeng, Henan 475004, China
*ZHAO Wei, E-mail:

ZOU Zeduo, E-mail:

Received date: 2022-03-22

  Accepted date: 2022-08-08

  Online published: 2023-04-21

Supported by

The National Natural Science Foundation of China(41271144)

Abstract

Based on the land use data of Xinxiang City from 2010 to 2020, this study integrates the methods of dynamic degreetransfer matrix, landscape pattern index and geographical detector to explore the quantitative structural changes, mutual transformations and landscape pattern characteristics of the “production-living- ecological space” (PLES) in Xinxiang City, and also analyzes the driving factors that affect the characteristic changes to reveal the laws governing the changes in the PLES and the current land use process. The results of this study reveal four important aspects of this system. (1) The changes in the PLES in Xinxiang City have accelerated significantly, and the overall performance shows that the production space continues to decrease, the living space keeps increasing, and the ecological space changes are more stable. (2) Regarding the spatial transfer characteristics, the ecological space has mainly transformed to production space, and the production space has mainly transformed to living space. (3) The landscape pattern characteristics show that the landscape types in Xinxiang City are diversified in terms of their components. (4) The spatial differentiation of the PLES is influenced by the combined effect of socio-economic and natural factors. Based on the empirical research results, we can not only propose corresponding optimization strategies for the better utilization of the PLES in Xinxiang City, but also provide important scientific references for the high-quality development of the prefecture-level cities in the Yellow River Basin.

Cite this article

ZOU Zeduo , YOU Mou , ZHAO Wei , FU Canfang , ZHANG Wenwen , HE Zhixiao . Changes in the “Production-Living-Ecological Space” Pattern in the Interlocking Mountain and River Zones of the Yellow River Basin—Taking Xinxiang City as an Example[J]. Journal of Resources and Ecology, 2023 , 14(3) : 479 -492 . DOI: 10.5814/j.issn.1674-764x.2023.03.005

1 Introduction

Since 1978, China has made brilliant achievements in industrialization and urbanization, and the urbanization rate in China has risen from 17.9% in 1978 to 60.6% in 2019 (Liu et al., 2017). However, rapid urbanization has also caused some problems for social development, such as urban population expansion (Lu et al., 2007), inefficient land use (Yao et al., 2011) and other “urban diseases” which are mainly characterized by an aging and weak population (Liu, 2011) and hollowing out of villages (Liu and Liu, 2010). The coexistence of “rural diseases”, resource scarcity, increased environmental pollution, and fragile ecosystems are crises and challenges that hinder China’s future development (Yu, 2005; Shen, 2013). In order to eliminate these difficulties, in 2012, Chinese policy makers proposed to build a PLES with “intensive and efficient production space, livable and moderate living space, and clear and beautiful ecological space” (Liu et al., 2014). The Central Urbanization Work Conference proposed to improve the efficiency of urban construction land development and utilization, and to coordinate production, living and ecology to form a scientific and reasonable structure, which is the main task of promoting new urbanization. The parallel development approach will become the focus in the future (Huang et al., 2017). As a special part of the national land space, the interlocking mountain and river areas have a fragile ecological environment, frequent natural disasters, and a gradient of resource distribution, all of which affect the development of the national land space (Deng et al., 2018; Ling et al., 2022). Since the 1980s, the inadequate and unreasonable exploitation of the PLES in the mountains has led to a series of environmental problems, such as soil erosion, land desertification, and serious vegetation destruction (Jansky et al., 2002). The excessive rate of urbanization, industrial and agricultural modernization, poverty alleviation and development, and easy relocation in mountainous areas have affected the development of the spatial patterns in mountainous areas (Deng et al., 2015), and these developments have also posed new challenges to the sustainable development and rational exploitation of the national land space.
The concept of the PLES was first derived from the EU’s multifunctional classification system for agriculture (Andersen et al., 2013). Scholars in related fields in China have carried out further research around this concept, successively in the connotation interpretation (Hu et al., 2016; Li and Fang, 2016), classification system (Chen and Shi, 2005; Zhang et al., 2015), pattern evolution (Xi et al., 2011; Wang and Tang, 2018; Duan et al., 2021; Wei et al., 2021), and spatial optimization (Zhu et al., 2015; Jiang et al., 2022). Among these studies, Li and Fang (2016) was the first to explain the concept of the production-living-ecological functions, while Hu et al. (2016) explained the connotation and relationship of the PLES in more depth. For the study of the classification system, Chen and Shi (2005) constructed the classification system of the production-living-ecological lands from the perspective of the national macroscopic scale, dividing all land uses in a certain region into three primary types: production land, living land, and ecological land, using a six-digit code. For the study of pattern evolution, Wang and Tang (2018) found the poor coordination of the coupling of living and ecological spatial functions in the study area by studying the evolution of the spatial pattern of the PLES in rural Chongqing. Zhu et al. (2015) quantitatively delineated the spatial scope of the PLES based on NPP’s ecological space assessment model, and put forward the concept of building an intensive and efficient production space, a livable and moderate living space, and a beautiful ecological space in Wufeng County. In addition, Wang et al. (2020) built an indicator system and a coupling coordination degree model to comprehensively assess the development status of the PLES in China. Among the various aspects, the evolution of the spatial pattern of the PLES has received increasing attention, but studies on the changes in the spatial pattern of the PLES in special areas such as “mountain-river-sea” have been relatively weak.
Based on the land use classification data of Xinxiang City from 2010 to 2020, this study analyzes the influences of different dimensions, such as the socio-economic and natural dimensions, on the spatial pattern of the PLES in the case study area by using dynamic degree transfer matrix, landscape pattern index and geographical detector. In addition, the evolution of the spatial pattern and driving forces of the PLES in Xinxiang City in the past 10 years were studied in order to identify the spatial characteristics of the PLES in Xinxiang City so that its territorial spatial pattern could be optimized. The results of this study provide a theoretical basis and empirical reference for the optimization of the spatial planning layout in the coastal cities of the Yellow River Basin.

2 Materials and methods

2.1 Study area

Xinxiang, a prefecture-level city in Henan Province, is located in the middle and lower reaches of the Yellow River on the northern bank of the Yellow River, and across the Yellow River from Zhengzhou, the national central city. It is an important city in the Yellow River ecological and economic belt, with a total area of 8269 km2 and a specific location in Henan Province (Fig. 1). In 2019, the target task of ecological protection and high-quality development of the Yellow River Basin was raised to a national strategy, and the implementation of “Yellow River Strategy”will surely have a significant and far-reaching impact on the high-quality development of all of the cities in the Yellow River Basin. Xinxiang is a key provincial city in Henan Province, an important province in the middle and lower reaches of the Yellow River, with different natural resource endowments in the region. Its urbanization is entering a rapid development stage, which is an important force for achieving high-quality development in the Central Plains Economic Zone in the future.
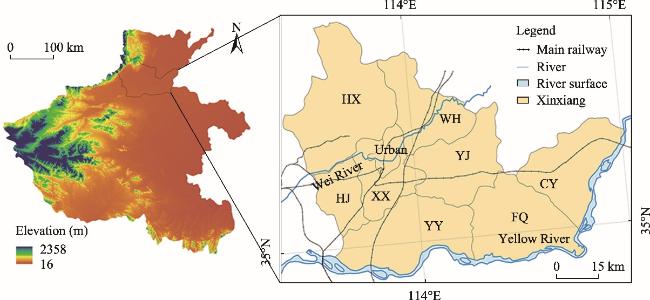
Fig. 1 Overview of the location of Xinxiang City

Notes: HX-Huixian; WH-Weihui; HJ-Huojia; XX-Xinxiang; YY-Yuanyang; YJ-Yanjin; CY-Changyuan; FQ-Fengqiu.

2.2 Research methods

2.2.1 Classification system

In this study, according to the secondary classification system of the remote sensing monitoring dataset of land use land cover changes from CAS (Shi et al., 2018; Song et al., 2021), we constructed a table showing the spatial classification of the PLES and land use types in each county (city and district) of Xinxiang City (Table 1), taking into account the actual situation of Xinxiang City.
Table 1 Land use types and spatial classification of the PLES in Xinxiang
PLES Codes for the types of land use in Xinxiang Type of the PLES in Xinxiang
Production space 11 Paddy field, 12 Dry land, 53 Other construction land Agricultural and industrial and mining production space
Living space 51 Town land, 52 Rural settlements Town and rural living space
Ecological space 21 Woodland, 22 Shrub woodland, 23 Sparse woodlands, 24 Other woodlands, 31 High coverage grass, 32 Medium coverage grass, 33 Low coverage grass, 41 Canals, 42 Lakes, 43 Reservoir ponds, 6 Unused land Green vegetation, water area and other ecological spaces

2.2.2 Land use dynamic degree analysis method

The land use dynamic degree refers to a change in the quantity of a certain land use type per unit of time, and its expression is (Song et al., 2021):
K = U b U a U a × 1 T × 100 %
where Ua and Ub represent the values of a certain land space type during the period from the beginning to the end of the study; and T represents the study time. If the unit of T is years, the value of K represents the dynamic degree of a certain land space type in the study area in a certain unit of time. In this study, using the land use dynamic degree analysis method, the data of land space types in Xinxiang City were substituted into the formula to obtain the required results.

2.2.3 Land use transfer matrix method

The land use transfer matrix method is based on the Markov model, with the help of its model in land use changes, and provides a way to show the rate of conversion of a certain land use type and the number of conversions in a certain timeframe. The rows represent the spatial type of the country at point T1 and the columns represent the spatial type of the country at point T2. In this study, the land use transfer matrix method was used to calculate the transformation values of various land use spatial types in different time periods by substituting the areas of land use spatial types in Xinxiang City for different years into the formula (Zhen et al., 2022).
S = ( S i j ) n × n = S 11 S 12 S 1 n S 21 S 22 S 2 n S n 1 S n 2 S n n
where S is the area; Sij represents the area where the i-th land use type in the initial stage is transformed into the j-th land use type in the end stage; and n is the number of land use types. In the transition matrix, the rows represent the i-th land use type in the initial stage, and the columns represent the j-th land use type in the end stage.

2.2.4 Landscape pattern index analysis method

The landscape pattern index refers to the landscape pattern and the landscape index. The landscape pattern usually refers to the spatial characteristics of the landscape, specifically the arrangement of the landscape mosaic formed by natural or human factors in the landscape space; while the landscape indices mainly include three horizontal scales of patch, type and landscape (Fu and Chen, 1996), and the landscape level indices can measure the overall structure and function of the whole landscape. In this study, a total of four landscape pattern indices, namely, the Number of Patches (NP), Spreading Index (CONTAG), Shannon Diversity Index (SHDI) and Shannon Evenness Index (SHEI) (Wu, 2007), were selected for calculating the landscape level indices, with the aim of analyzing the changing characteristics of the landscape pattern of the PLES in Xinxiang City.

2.2.5 Geographical detector

As a powerful tool for the exploratory analysis of spatial data, the geographical detector can be fully exploited and used to reveal the mechanistic processes behind spatial differentiation. In this study, the spatial area of the PLES Xinxiang City in different periods of time was taken as the dependent variable, and nine natural and human economic factors were selected as the independent variables. The factor detection tool in the geographical detector was used to detect the driving effects of the nine indicator factors on the dynamic changes in the spatial area of the PLES in Xinxiang City, in order to show the degrees of influence of each of the factors on the spatial differentiation of the phenomenological factors, so as to compare the relative importance. Factor detection mainly uses the value of the q statistic to measure the explanatory power of each of the nine indicator factors (independent variable X) on the spatial variation of the PLES area (dependent variable Y). Where, the larger the value of q, the stronger the explanatory power of X to Y, and the smaller the value of q, the weaker the explanatory power (Wang and Xu, 2017; Huang et al., 2019). The calculation formula is:
q = 1 h = 1 L N h δ h 2 N δ 2
where h is the classification or partition of variable Y or factor X; Nh and N are the number of cells in layer h and the whole region, respectively; and
δ h 2
and
δ h 2
are the variances of the Y values in layer h and the whole region, respectively.

2.3 Data sources

The land use data for Xinxiang City from 2010 to 2020 were obtained from the data platform of the Resource and Environment Science and Data Center of the Chinese Academy of Sciences (http://www.resdc.cn). The land use types in Xinxiang City in the three periods of 2010, 2015 and 2020 were classified according to the land resource classification standards, and the data were obtained for agricultural production land, green cover ecological land, and water ecological land. The data were obtained for seven types of land use: agricultural production land, green ecological land, water ecological land, urban living land, rural living land, industrial and mining production land and unused ecological land.
The driving factor indicators in the geographical detector include two natural factors, namely, the average elevation and average slope of each county (city and district) in Xinxiang City, and seven socio-economic factors, namely, the proportion of primary industry, the proportion of secondary industry, the proportion of tertiary industry, the per capita GDP, the urbanization rate, the resident population and the proportion of ecological space. The above required data were obtained from the data platform of the Resource and Environment Science and Data Center of the Chinese Academy of Sciences (http://www.resdc.cn), and some of the missing socio-economic data came from The Henan Provincial Statistical Yearbook and The Xinxiang National Economic and Social Development Statistical Bulletin for the corresponding years.
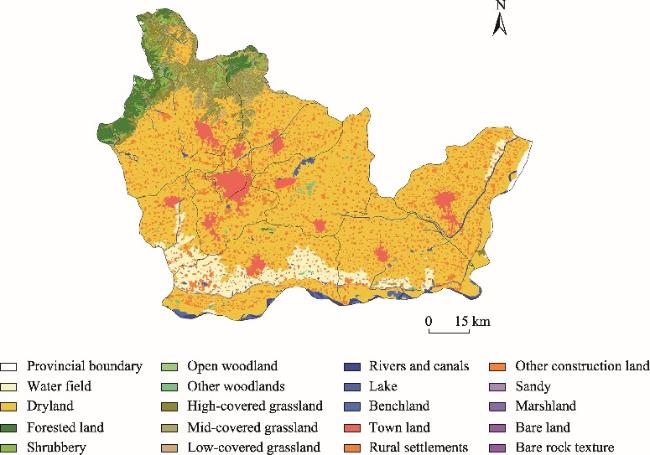
Fig. 2 Land use types in Xinxiang City in 2020

3 Results

3.1 General characteristics of the spatial pattern of the PLES in Xinxiang City

3.1.1 Horizontal spatial characteristics

The proportions of the production, living and ecological space in Xinxiang City in 2020 were 79.68%, 15.64% and 14.68%, respectively, with the production space being the absolute main component. Within the production space, the agricultural production space occupies a larger part, and the industrial and mining production space and service production space occupy smaller parts. Comparing the areas of the PLES in each county (city and district) in the past 10 years (Fig. 3-Fig. 5) shows that the proportions of the PLES in each county (city and district) vary significantly, among which the largest difference is located in the south of Yuanyang County, followed by Fengqiu County. The areas of production space and living space in the southern region (mainly Yuanyang County, Fengqiu County and Changyuan County) occupy a larger proportion in the city. The area of ecological space in the city is mainly concentrated in the northern area, primarily in Huixian City and Weihui City.
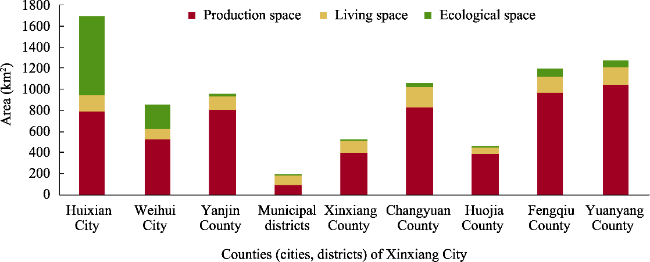
Fig. 3 Areas of the PLES in each of the counties (cities, districts) of Xinxiang City in 2010
Fig. 4 Areas of the PLES in each of the counties (cities, districts) of Xinxiang City in 2015
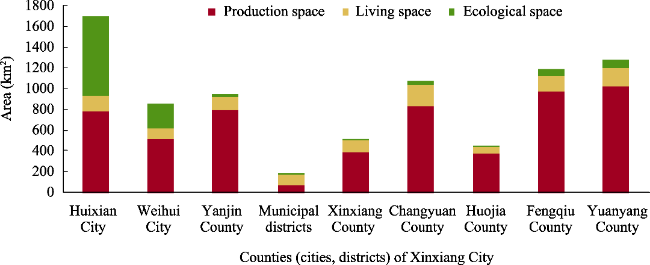
Fig. 5 Areas of the PLES in each of the counties (cities, districts) of Xinxiang City in 2020

3.1.2 Vertical spatial features

The average elevation of Xinxiang City is 79 m, and the northwestern Taihang Mountains area is the highest place in the city, with an elevation of 1570 m. Overall, the elevation of Xinxiang City shows a high altitude in the northwest and southwest but a low altitude in the southeast and northeast. The area of living space decreases as the altitude rises. Among the spatial types, the urban living space and rural living space are concentrated in the central area, while the ecological space is concentrated in the northwest area with a higher altitude, and the production space is concentrated in the southern plain area with flatter terrain.

3.2 Evolution of the spatial-temporal pattern of the PLES in Xinxiang City

3.2.1 Characteristics of changes in the numeric structure

From 2010 to 2020, the spatial dynamics of the PLES in Xinxiang County (city and district) varied significantly (Table 2). Among them, the dynamic degree of the industrial and mining production space was the largest at 11.15%, and positive at different periods, while the dynamic degree of the other production spaces were the smallest and negative at different periods. The agricultural production space continued to decrease, with an annual dynamic degree of -0.29%. The urban living space and rural living space had dynamic degrees of 2.65% and 0.48%, respectively, while the green ecological space had an annual dynamic degree of -0.06%; and the degree of the water ecological space was 0.41%.
Table 2 The dynamics degree of the PLES from 2010 to 2020 in Xinxiang City (Unit: %)
Spatial type 2010-2015 2015-2020 2010-2020
Agricultural production space -0.15 -0.43 -0.29
Vegetation ecological space 0.04 -0.16 -0.06
Aquatic ecological space 1.44 -0.58 0.41
Town living space 1.65 3.37 2.65
Rural living space 0.51 0.45 0.48
Industrial and mining
production space
9.67 8.52 11.15
Other ecological spaces -13.02 -1.65 -6.80
Using ArcGIS software to visualize the spatial distribution patterns of the PLES in each county (city and district) of Xinxiang at different times showed that the spatial pattern of the PLES in Xinxiang has changed significantly, and the spatial and temporal differences are significant (Fig. 6). During 2010-2020, the production space in Xinxiang generally continued to decrease, the living space kept increasing, and the ecological space changes were more volatile, showing an increase followed by a decrease (Fig. 7). Between 2010 and 2015, the production space in Xinxiang City decreased by 0.56%, while the living space increased by 0.48%, and the ecological space increased slightly by 0.08%. Between 2015 and 2020, the production space in Xinxiang City decreased by 0.37%, the living space increased significantly by 0.94%, and the ecological space decreased by 0.12%.
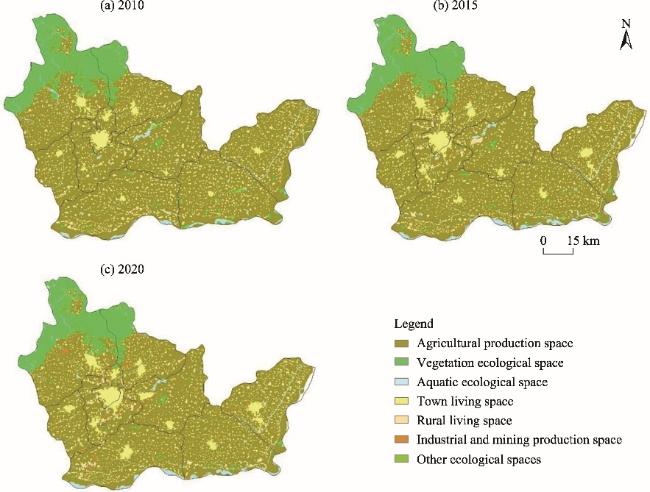
Fig. 6 Evolution of the pattern of the PLES from 2010 to 2020 in Xinxiang City
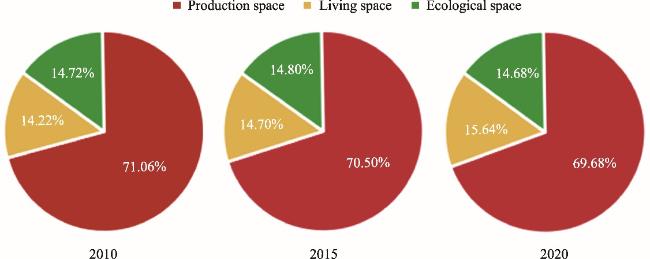
Fig. 7 The ratios of the PLES in Xinxiang City in 2010, 2015 and 2020
There are obvious regional differences in the quantitative changes in the areas of the PLES in Xinxiang City over the past 10 years. In terms of production space, the area of production space decreased in all nine county-level study areas, among which it decreased the most in Yuanyang County, Xinxiang County and Changyuan County, totaling about 70.56 km2. The counties with significantly larger areas of agricultural production space were all concentrated in Yuanyang County and Fengqiu County in the south. In terms of living space, the area of living space in Xinxiang City generally increased, and the county unit with the smallest increase in living space area was the city district. In terms of ecological space, the ecological space area increased in three counties, among which the largest increase was in Yuanyang County, with a total of about 5.47 km2, and the counties with significant decreases in ecological space area were concentrated in Fengqiu County in the southeast. By comparing the agricultural production space and ecological space in each county, there is a clear correlation in some counties between a decrease in the area of agricultural production space and an increase in the area of ecological space. In general, the regional differences in the changes of the PLES structures of Xinxiang City during the 10-year period are obvious. The area of living space increased more in the eastern and southern regions, and the changes in the area of ecological space were more volatile. The areas of both living space and ecological space increased in the northwestern region, and the area of production space decreased significantly; while the area of living space increased significantly in the central region, and the areas of production space and ecological space decreased.

3.2.2 Spatial transfer characteristics

The spatial changes in Xinxiang City are not only the changes in quantitative structure, but also the mutual transformation of spatial types. The spatial transfer matrix of the PLES in Xinxiang City from 2010 to 2015 are shown in Table 3. From the transfer out perspective, the agricultural and industrial and mining production spaces mainly shifted to rural living space with a total area of 51.82 km2, while the rural and urban livingspace space mainly shifted to agricultural production space with a total area of 32.3 km2, and the ecological space mainly shifted to agricultural production space, totaling 20.11 km2. From the transfer-in perspective, the production space was mainly derived from rural living space with an area of 30.15 km2, the living space was mainly derived from agricultural production space with an area of 76.22 km2, and the ecological space was mainly derived from agricultural production space with an area of 19.85 km2.
Table 3 The transfer matrix of the PLES areas in Xinxiang City from 2010 to 2015 (Unit: km2)
2010-2015 Transfer matrix Transfer in total
A B C D E F G
A - 11.44 6.36 2.26 30.04 4.81 2.31 57.23
B 4.35 - 0.70 0.02 0.39 0.21 2.22 7.89
C 15.50 0.77 - 0.05 0.35 0.05 0.50 17.23
D 24.43 0.03 0.13 - 0.45 0.35 - 25.39
E 51.79 0.46 0.74 0.11 - 0.03 0.02 53.14
F 27.98 0.46 0.10 0.03 0.11 - - 28.67
G 0.04 0.10 - - 0.01 - - 0.15
Transfer out total 124.08 13.27 8.03 2.46 31.34 5.46 5.06 -

Note: A-Agricultural production space; B-Vegetation ecological space; C-Aquatic ecological space; D-Urban living space; E-Rural living space; F-Industrial and mining production space; G-Other ecological spaces.

The results of the spatial area transfer matrix for the PLES in Xinxiang City from 2015 to 2020 are shown in Table 4. From the transfer-out perspective, the agricultural and industrial and mining production space mainly shifted to the rural living space with a total of 80.81 km2, the rural and urban living space mainly shifted to the agricultural production space with a total of 44 km2, and the ecological space mainly shifted to the agricultural production space with a total of 18.46 km2. From the transfer-in perspective, production space mainly originated from rural living space with an area of 40.63 km2, living space mainly originated from agricultural production space with an area of 112.37 km2, and ecological space mainly originated from agricultural production space with an area of 18.06 km2.
Table 4 The transfer matrix of the PLES areas in Xinxiang City from 2015 to 2020 (Unit: km2)
2015-2020 Transfer matrix Transfer in total
A B C D E F G
A - 6.78 11.37 3.64 40.36 7.35 0.31 69.81
B 6.24 - 1.09 0.04 0.56 0.33 0.12 8.39
C 11.72 0.92 - 0.09 0.42 0.45 - 13.60
D 31.68 0.05 0.97 - 19.30 2.61 - 54.62
E 80.69 0.65 0.44 0.17 - 0.12 0.01 82.10
F 39.88 0.50 0.66 0.04 0.27 - - 41.36
G 0.10 0.12 0.01 - 0.01 - - 0.24
Transfer out total 170.32 9.03 14.54 3.98 60.93 10.87 0.45 -

Note: A-Agricultural production space; B-Vegetation ecological space; C-Aquatic ecological space; D-Urban living space; E-Rural living space; F-Industrial and mining production space; G-Other ecological spaces.

Over the whole study period from 2010 to 2020, Xinxiang City’s transfer matrix for the three spatial areas is shown in Table 5. From the transfer-out perspective, the agricultural and industrial and mining production space mainly shifted to rural living space, totaling 81.95 km2; rural and urban living space mainly shifted to agricultural production space, totaling 22.52 km2; and ecological space mainly shifted to agricultural production space, totaling 23.18 km2. From the perspective of transfer in, production space mainly originated from rural living space with an area of 21.05 km2, living space mainly originated from agricultural production space with an area of 136.86 km2, and ecological space mainly originated from agricultural production space with an area of 22.34 km2.
Table 5 The transfer matrix of the PLES areas in Xinxiang City from 2010 to 2020 (Unit: km2)
2010-2020 Transfer matrix Transfer in total
A B C D E F G
A - 11.33 9.29 1.61 20.91 4.97 2.56 50.67
B 3.6 - 0.67 0.02 0.33 0.17 2.24 7.03
C 18.66 0.6 - 0.03 0.25 0.45 0.48 20.47
D 54.93 0.04 1.02 - 18.48 0.83 - 75.3
E 81.93 0.49 0.59 0.06 - 0.02 0.01 83.1
F 58.83 0.54 0.62 0.02 0.14 - - 60.15
G 0.08 0.07 0.01 - 0.01 - - 0.17
Transfer out total 218.03 13.07 12.2 1.74 40.12 6.44 5.29 -

Note: A-Agricultural production space; B-Vegetation ecological space; C-Aquatic ecological space; D-Urban living space; E-Rural living space; F-Industrial and mining production space; G-Other ecological spaces.

From 2010 to 2020, among the production spaces, the agricultural production space decreased a lot and transformed the largest amount with the rural living space; while the industrial and mining production space changed only slightly, mainly in the transformation of the agricultural production space. Among the living spaces, the urban living space increased significantly and the rural living space increased slightly, both mainly in the occupation of the agricultural production space. Among the ecological spaces, the watershed ecological space had the largest reduction in area, mainly in the occupation of agricultural production space, while the green cover ecological space was slightly reduced, mainly transformed into agricultural production space, and the other ecological spaces changed less. The overall change is characterized by the transformation of ecological space to production space and production space to living space, which shows that human activities have a significant impact on the changes in the spatial pattern of the production-living-ecological functions in Xinxiang.

3.2.3 Characteristics of the changing landscape pattern of Xinxiang City’s PLES

For the landscape index analysis in this study, the four landscape indexes of Shannon Diversity Index (SHDI), Contagion Index (CONTAG), Number of Patches (NP) and Shannon Evenness Index (SHEI), were applied with the help of Frag stats software to analyze the landscape pattern characteristics of the PLES in Xinxiang City. The changes in landscape connectivity, fragmentation, diversity and dominance reveal the process of landscape pattern changes in the last 10 years in the triple life space of Xinxiang City (Fig. 8). The results show that the number of landscape patches in Xinxiang City has continued to show an upward trend since 2010, reaching 3881 in 2020. The landscape Spreading Index was decreasing during the 10 years, from 72 in 2010 to 70 in 2020, and there are several reasons for this. Firstly, the ecological space is mainly concentrated in the northwest high altitude area of the city, which has less living space, a lack of financial support and primitive transportation infrastructure. Secondly, the spatial proportion of ecological space in some counties is relatively small, and there is a lack of awareness of the inherent value of ecological space and no timely adjustment of policies to control the situation. These factors lead to a continuous decline in the landscape spreading degree and a significant weakening of landscape connectivity. The Shannon Evenness Index of the landscape in Xinxiang City increased and the landscape dominance decreased between 2010 and 2020. The Shannon Diversity Index increased from 0.99 to 1.05 between 2010 and 2020, and the landscape diversity was enhanced in general, which may be mainly due to the influence of national policies in recent years. Therefore, the ecological environmental quality in Xinxiang City has improved significantly and the landscape diversity has been enhanced. Overall, with the increase in the population and the expansion of the living space in Xinxiang City, the increased fragmentation of the landscape pattern, and enhanced landscape connectivity and landscape diversity in Xinxiang City indicate a more scientific use of the land space in Xinxiang City in the future.
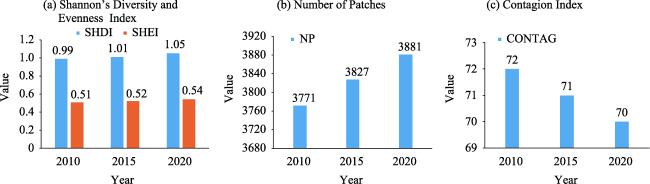
Fig. 8 The changes in the landscape pattern index of the PLES in Xinxiang City

3.3 Analysis of the forces driving the evolution of the spatial pattern of the PLES in Xinxiang City

The formation and evolution of the three spatial patterns are influenced by a combination of socio-economic factors and natural factors in the region where they are located. In this study, the selection of factors and variables was made with reference to the relevant studies of Tang et al. (2021) and Zhu et al. (2022), based on the detection of socio-economic factors and natural factors by the geographical detector, and combined with the actual situation of land space development in Xinxiang City. In total, the seven socio-economic factors of primary industry share, secondary industry share, tertiary industry share, per capita GDP, urbanization rate, resident population and ecological space share of each county (city and district) domain in Xinxiang City were selected as the independent variables; while the two natural factors of average elevation and average slope (Table 6), and three spatial areas of the production-living-ecological in Xinxiang City in 2010, 2015 and 2020 were selected as the dependent variables for the factor detection of natural and socio-economic factors (Tables 7-9).
Table 6 The construction of indicators for the evolution of the pattern of the PLES
Level 1 indicators Level 2 indicators Indicators Units
Socio-economic factors Percentage of primary industry X1 %
Percentage of secondary industry X2 %
Tertiary industry share X3 %
GDP per capita X4 yuan
Urbanization X5 %
Percentage of ecological space in the current year X6 %
Resident population X7 ten thousand people
Natural factors Average altitude X8 m
Average slope X9 °
Table 7 Geographical detector calculation results for the production space
Indicators Agricultural production space Industrial and mining production space
2010 2015 2020 2010 2015 2020
X1 0.57* 0.63* 0.65* 0.05 0.25 0.23
X2 0.26 0.16 0.39 0.25 0.17 0.05
X3 0.51 0.82* 0.55 0.31 0.54 0.30
X4 0.62 0.61 0.48 0.17 0.58 0.72
X5 0.81* 0.79* 0.80* 0.32 0.25 0.22
X6 0.43 0.58 0.52 0.38 0.30 0.27
X7 0.90** 0.90** 0.90** 0.56* 0.52 0.43
X8 0.37 0.38 0.38 0.55 0.56 0.57*
X9 0.13 0.12 0.13 0.24 0.39 0.47

Note: ** and * indicate significance levels of 0.05 and 0.1, respectively.

Table 8 Geographical detector calculation results for the living space
Indicators Urban living space Rural living space
2010 2015 2020 2010 2015 2020
X1 0.98** 0.98** 0.86 0.51 0.42 0.41
X2 0.34 0.33 0.75 0.15 0.24 0.38
X3 0.98** 0.57 0.98** 0.52 0.83* 0.48
X4 0.93 0.84* 0.96* 0.55 0.56 0.43
X5 0.92 0.90 0.96 0.62* 0.61 0.58*
X6 0.81 0.84 0.56 0.29 0.35 0.39
X7 0.90 0.88 0.87 0.86** 0.86** 0.87*
X8 0.23 0.84 0.36 0.41 0.40 0.34
X9 0.63 0.69 0.64 0.07 0.07 0.06

Note: ** and * indicate significance levels of 0.05 and 0.1, respectively.

Table 9 Geographical detector calculation results for the ecological space
Indicators Vegetation ecological space Aquatic ecological space Other ecological spaces
2010 2015 2020 2010 2015 2020 2010 2015 2020
X1 0.19 0.38 0.21 0.33 0.56 0.54 0.98** 0.98** 0.86
X2 0.44 0.44 0.40 0.49 0.38 0.30 0.99 0.99 0.75
X3 0.95** 0.40 0.38 0.35 0.58 0.29 0.22 0.22 0.98**
X4 0.93* 0.40 0.95 0.92** 0.27 0.19 0.40 0.40 0.96*
X5 0.25 0.93 0.39 0.65 0.57 0.55 0.13 0.13 0.96
X6 0.73 0.95* 0.73 0.42* 0.87** 0.90** 0.32 0.32 0.56
X7 0.40 0.22 0.22 0.45 0.74* 0.72* 0.15 0.15 0.87
X8 0.99*** 0.99*** 0.99*** 0.19 0.18 0.13 0.26 0.26 0.36
X9 0.73 0.72 0.73 0.49 0.08 0.08 0.41 0.41 0.64

Note: ***, ** and * indicate significance levels of 0.01, 0.05 and 0.1, respectively.

The analysis of the processing results for the independent and dependent variables by the geographical detector indicated that the changes in the land use pattern in the Huaihe Eco-economic Zone are subject to the joint action of several socio-economic factors, and they show characteristics of spatial divergence. Among the factors, primary industry share, tertiary industry share, GDP per capita, urbanization rate, resident population, ecological space share in the current year, and average elevation have a largest contributions to the spatial pattern variation in Xinxiang City. In terms of the explanatory power (q-statistic size) of each socio-economic factor, the ratio of primary industry, the ratio of tertiary industry and the urbanization rate are the main drivers of the evolution of the spatial pattern of production; while the ratio of primary industry, the ratio of tertiary industry, GDP per capita, the urbanization rate and the resident population are the main drivers of the evolution of the spatial pattern of living; and finally the ratio of primary industry, the ratio of tertiary industry, GDP per capita, the ratio of ecological space and the resident population are the main drivers of the evolution of the spatial pattern of ecological space. In other words, the primary industry share, tertiary industry share, GDP per capita, ecological space share and resident population are the main drivers of the evolution of the ecological spatial pattern.
In terms of the time dimension, the influence of primary industry share on agricultural ecological space was significantly enhanced from 2010 to 2020; the influence of urbanization rate and resident population on agricultural production space was significant during the study period; and the influence of the resident population on industrial and mining production space was significant in 2010. For the living space, the influence of the primary industry share and tertiary industry share on urban living space was significant, the influence of GDP per capita on urban living space and urbanization rate on urban living space was significantly enhanced, the influence of urbanization rate on rural living space fluctuated and was weakened, and the influence of the permanent population on rural living space was significantly enhanced. For the ecological space, the influence of the proportion of ecological space on watershed ecological space was significantly enhanced in 2010, and the explanatory power of the proportion of primary industry on the other ecological spaces was stronger.
As for natural factors, the overall degree of influence of the natural factors on the ecological space was higher, while the influences on the industrial and mining production space and living space varied greatly. The average elevation had the most significant influence on green cover ecological space from 2010 to 2020, and the average elevation had a significant influence on industrial and mining production space in 2020, but the average slope did not have a significant influence on the evolution of the spatial pattern of the PLES in Xinxiang City during the study period.

3.4 Analysis of the problems existingin the pattern of the PLES in Xinxiang City

(1) The spatial distribution of land in Xinxiang City varies greatly, and its ecological space is mainly distributed in the northwest, which carries most of the city’s ecological service functions so its role is very important. From 2010 to 2020, the proportion of ecological space in Xinxiang City as a whole showed a slight downward trend, and the area of ecological space decreased by about 0.12%. Among the counties, the ecological space areas of six counties (cities and districts) in the nine county study unit domains were reduced (except for Weihui City and Hui County in the northwest and Yuanyang County in the south). The northwest is the most concentrated area of ecological space in Xinxiang City, so the change in the ecological service quality in the mountainous areas of Xinxiang City was not obvious.
(2) Regarding the spatial transfer characteristics, the transferred out area of industrial and mining production space was smaller than the transferred in area during 2010-2020. The growth of the industrial and mining production space area has led to a series of environmental problems, and a large amount of mining activity has destroyed the ecosystem balance. Deforestation and land reclamation have led to the emergence of a “bald mountain”, which has seriously affected the development of ecotourism. The most typical example is Huixian City, once called the “Grey County”, where the unreasonable development of the industrial and mining production space has led to the destruction of the local ecological environment, thus causing a serious decline in the quality of Huixian's air environment.
(3) The expansion of living space is closely related to the contraction of production space, and the living space area of Xinxiang City as a whole tended to increase from 2010 to 2020. The growth of living space was mainly concentrated in the central area, which is closer to the urban area. There are two reasons for this pattern. Firstly, due to the influence of the trend of regional integration, the development of the urban area must rely on the advantages of the region, and the development of the region cannot be separated from the driving role of the urban area. Both of these are indispensable, and common development is the inevitable result of the concentration of living space to the central area. Secondly, the geographical conditions are the constraints. The northwestern part of Xinxiang City is the Taihang Mountains, with a high altitude, which affects the expansion of living space and production space. In contrast, the southern part is the Yellow River Alluvial Fan Plain, with superior geographical conditions, which is generally high in the northwest and low in the southeast. As a result, the expansion of living space in Xinxiang City is concentrated in the central area.

4 Discussion

The PLES changes in the Yellow River Basin are comprehensive and complex, with strong regional development characteristics (Hua et al., 2021). The PLES functions are constrained by different dominant functions in the system in different periods but evolve in synergy, and the spatial balance of the PLES is the key to rationalizing the spatial development order, and coordinating urban-rural relations and high-quality development of the county economy. Therefore, the future policy formulation related to economic and social development and ecological protection in the Henan section of the Yellow River Basin should take into full consideration the dominant factors influencing the changes in the PLES, promote the rational distribution of the land use structure of the PLES, and promote the construction of regional ecological civilization and high-quality development. Based on the main conclusions of this paper, and in conjunction with the Outline of the Plan for Ecological Protection and High- Quality Development of the Yellow River Basin, the following three suggestions are made in order to consolidate Xinxiang’s important position in the Yellow River Ecological and Economic Belt and to address the problems identified in the process of exploring the characteristics of changes in the spatial pattern of the PLES in Xinxiang.
(1) For the ecological space, Xinxiang City has rich and diverse ecological resources in its northwestern mountain range, which has great potential for development. Xinxiang should promptly adjust its economic policies, strengthen the construction of ecological projects, improve and enhance the regional environmental quality, strictly control the development of land use, and formulate scientifically sound and reasonable industrial development plans.
(2) In terms of production space, the economic growth structure should be transformed. The development mode of the production space and the ecological space should be adjusted reasonably, especially for the industrial and mining production space. The development intensity and scale of the industrial and mining production space must be controlled, and the ecology of some areas should be protected and restored at the same time. The development of ecological resources, such as tourism resources, should be intensified to compensate for the loss of production space.
(3) In terms of living space, the distribution of the living space in Xinxiang is fragmented but mainly concentrated in the central region, while its expansion in the eastern region is more obvious and borders with Shandong Province, and its development potential is unlimited. For areas with complex terrain and frequent geological disasters, when arranging the engineering treatment of important disaster sites, it is necessary to incorporate a large regional disaster prevention and detection system to minimize the losses caused by geological disasters. At the same time, it is also necessary to strengthen the infrastructure construction in rural living spaces, make preparations for disaster prevention and mitigation, and strive to construct a safe and stable living space disaster prevention and mitigation system.
The combination and coordinated development of the PLES functions serve as an important basis for the sustainable development of Xinxiang City. Previous studies have mostly focused on land use transformation, with insufficient research on the deep evaluation of land multifunctionality, resulting in the contraction of a large amount of ecological and production space. The factors influencing the synergy of the PLES and their functional coupling have complex interactions, and there are differences in the degrees of interaction and directions of action between different factors of nature and the social economy. Compared with the previous qualitative studies, this study based its interpretation of the PLES functional level divergence from different dimensions of the influencing factors by means of geographical detector. The results clearly show that the PLES structure and its functional coupling in different regions are influenced by the positioning of the main functional area planning, and the division of “three zones and three lines” in the new round of territorial spatial planning is being carried out. The measurement of the factors influencing the spatial differentiation of the PLES has important guidance and practical significance for the construction of a new pattern of urban territorial spatial development and protection. In view of the disorderly expansion of the living space and contraction of the production and ecological space, we should strictly control both the blind expansion of urban construction land and the scale of urbanization in the plain area, systematically decongest the population, strengthen the efficient gathering, and promote the transformation and upgrading of modern agriculture, all while taking into account the bearing capacity of regional resources and the environment. The mountainous area in the northwest of the city should continue to strengthen its vegetation protection, further enhance its ecosystem service function, and strictly control the transformation of its ecological space to production and living space. This study has only analyzed the characteristics of dynamic changes in the PLES in Xinxiang City so far, and explored the problems in the utilization of national land space. In the future, we need to establish new measurement models and methods to further quantitatively evaluate the degree of coordination among the PLES areas, scientifically evaluate the level of national land space utilization in Xinxiang City, and refine the ways to optimize the national land space pattern.

5 Conclusions

Based on the land use data for Xinxiang City from 2010 to 2020, this study explored the evolution and driving forces of the spatial pattern of the PLES in Xinxiang City by using the dynamic degree, transfer matrix, landscape pattern index and geographical detector. Based on this analysis, the following conclusions are drawn.
(1) The overall dynamic characteristics of the PLES in Xinxiang City have changed significantly. During 2010- 2020, the production space in Xinxiang City has been decreasing, the living space has been increasing, and the ecological space has been changing more steadily, showing an increasing and then decreasing trend.
(2) The overall transfer characteristics of the PLES in Xinxiang City are significant. During 2010-2020, the overall change in spatial transfer was mainly characterized by the transformations of ecological space to production space and production space to living space.
(3) The characteristics of landscape pattern changes in the PLES in Xinxiang City are significant. During 2010-2020, the number of landscape patches in Xinxiang City has been on the rise; the landscape sprawl index has kept decreasing; the landscape Shannon uniformity index has increased; the Shannon Diversity Index has kept increasing; and the landscape types in Xinxiang City are diversified in terms of components.
(4) The changes in PLES in Xinxiang City are influenced by the combined effect of socio-economic factors and natural factors. The primary industry share, tertiary industry share, per capita GDP, urbanization rate, resident population and ecological space share in the socio-economic index are the main forces driving the evolution of the spatial pattern of the PLES in Xinxiang City. In addition, the average altitude in the natural index has a higher degree of influence on the ecological space in Xinxiang City.
[1]
Andersen P S, Veire H, Dalgaard T, et al. 2013. An indicator-based method for quantifying farm multifunctionality. Ecological Indicators, 25: 166-179.

[2]
Chen Q, Shi P J. 2005. Exploring the classification of land use function. Journal of Beijing Normal University (Natural Science Edition), (5): 536-540. (in Chinese)

[3]
Deng W, Dai E F, Jia Y W, et al. 2015. Spatial and temporal coupling characteristics and effects of water and soil elements in mountainous areas and their regulation. Journal of Mountain Science, 33(5): 513-520. (in Chinese)

[4]
Deng W, Nan X, Shi Z Q, et al. 2018. Study on spatial characteristics and regional development of mountainous areas in China. Journal of Nature, 40(1): 17-24. (in Chinese)

[5]
Duan Y, Wang H, Huang A, et al. 2021. Identification and spatial-temporal evolution of rural “production-living-ecological” space from the perspective of villagers’ behavior—A case study of Ertai Town, Zhangjiakou City. Land Use Policy, 106: 105457. DOI: 10.1016/J.LANDUSEPOL.2021.105457.

[6]
Fu B J, Chen L D. 1996. Types of landscape diversity and their ecological significance. Acta Geographica Sinica, 51(5): 454-462. (in Chinese)

[7]
Hu W T, Wang L G, Shu M H. 2016. Considerations on the delineation of “the Production-living-ecological space” in urban and rural planning. Urban Planning, 40(5): 21-26. (in Chinese)

[8]
Hua G, Huan Z. 2021. Study on coordination and quantification of ecological protection and high quality development in the Yellow River Basin. IOP Conference Series: Earth and Environmental Science, 647(1): 012168. DOI: 10.1088/1755-1315/647/1/012168.

[9]
Huang J C, Lin H X, Qi X X. 2017. Advances in the research of three-living space for the optimization of national land space. Progress in Geography, 36(3): 378-391. (in Chinese)

[10]
Huang M Y, Yue W Z, Fang B, et al. 2019. Response characteristics of ecological service value scales and geodetection mechanism in Dabie Mountain area from 1970-2015. Acta Geographica Sinica, 74(9): 1904-1920. (in Chinese)

[11]
Jansky L, Ives J D, Furuyashiki K, et al. 2002. Global mountain research for sustainable development. Global Environmental Change, 12(3): 231-239.

[12]
Jiang X T, Zhai S, Liu H, et al. 2022. Multi-scenario simulation of production-living-ecological space and ecological effects based on shared socioeconomic pathways in Zhengzhou, China. Ecological Indicators, 137: 108750. DOI: 10.1016/J.ECOLIND.2022.108750.

[13]
Li G D, Fang C L. 2016. Quantitative function identification and analysis of urban ecological-production-living spaces. Acta Geographica Sinica, 71(1): 49-65. (in Chinese)

[14]
Ling Z Y, Li Y S, Jiang W G, et al. 2022. Characteristics of spatial dynamics of national terrestrial triple life in urban agglomerations of mountain-river-sea interlacing zones—Taking the Beibu Gulf urban agglomeration of Guangxi as an example. Economic Geography, 42(2): 18-24. (in Chinese)

[15]
Liu J L, Liu Y S, Li Y R. 2017. Classification evaluation and spatial-temporal analysis of “production-living-ecological” spaces in China. Acta Geographica Sinica, 72(7): 1290-1304. (in Chinese)

[16]
Liu Y S. 2011. Scientific promotion of rural land improvement strategy in China. China Land Science, 25(4): 3-8. (in Chinese)

[17]
Liu Y S, Chen C, Li Y H. 2014. The town-villages construction pattern under new-type urbanization in China. Areal Research and Development, 33(6): 1-6. (in Chinese)

[18]
Liu Y S, Liu Y. 2010. Progress and prospect of rural hollowing in China. Geographical Research, 29(1): 35-42. (in Chinese)

[19]
Lu D D, Yao S M, Li G P, et al. 2007. Comprehensive analysis of the urbanization process based on China’s national conditions. Economic Geography, 27(6): 883-887. (in Chinese)

[20]
Shen Q J. 2013. Study on new urbanization based on ecological civilization. Urban Planning Forum, 206(1): 29-36. (in Chinese)

[21]
Shi Z Q, Deng W, Zhang S Y. 2018. Spatial pattern and spatio-temporal change of territory space in Hengduan Mountains region in recent 25 years. Geographical Research, 37(3): 607-621.

[22]
Song Y Y, Xue D Q, Xia S Y, et al. 2021. Change characteristics and formation mechanism of the territorial spatial pattern in the Yellow River Basin from 1980 to 2018. Geographical Research, 40(5): 1445-1463. (in Chinese)

[23]
Tang X M, Liu Y, Ren Y M. 2021. Spatial function measurement and spatial-temporal variation analysis of three lives in Miyun Reservoir region based on grid scale. China Agricultural Resources and Zoning, 42(5): 60-69. (in Chinese)

[24]
Wang C, Tang N. 2018. Spatio-temporal characteristics and evolution of rural productionliving-ecological space function coupling coordination in Chongqing Municipality. Geographical Research, 37(6): 1100-1114. (in Chinese)

[25]
Wang D, Jiang D, Fu J, et al. 2020. Comprehensive assessment of production-living-ecological space based on the coupling coordination degree model. Sustainability, 12(5): 2009. DOI: 10.3390/su12052009.

[26]
Wang J F, Xu C D. 2017. Geodetectors: Principles and prospects. Acta Geographica Sinica, 72(1): 116-134. (in Chinese)

[27]
Wei S Y, Lu R C, Lin X N, et al. 2021. Study on the evolution and mechanism of the spatial pattern of land in Guangxi land border zone. China Land Science, 35(12): 98-108. (in Chinese)

[28]
Wu J G. 2007. Landscape ecology-patterns, processes, scales and hierarchies. Beijing, China: Higher Education Press: 31-45. (in Chinese)

[29]
Xi J C, Zhao M F, Ge Q S. 2011. The micro-scale analysis of rural settlement land use pattern: A case study of Gouge Village of Yesanpo Scenic Area in Hebei Province. Acta Geographica Sinica, 66(12): 1707-1717. (in Chinese)

[30]
Yao S M, Lu D D, Wang C. 2011. Urbanization in China needs comprehensive scientific thinking: Exploration of the urbanizationmode adapted to the special situation of China. Geographical Research, 30(11): 1947-1955. (in Chinese)

[31]
Yu K P. 2005. Scientific development concept and ecological civilization. Marxism and Reality, (4): 4-5. (in Chinese)

[32]
Zhang H Q, Xu E Q, Zhu H Y. 2015. Classification and spatial pattern of “three living lands” in China. Resources Science, 37(7): 1332-1338. (in Chinese)

[33]
Zhen Y, Wu Z P, Yin Z H, et al. 2022. Study on spatio-temporal change of land use in Zoige County, Sichuan Province. Ecological Science, 41(2): 41-49. (in Chinese)

[34]
Zhu Q K, Qiao J J, Han D, et al. 2022. Spatial and temporal changes in the sales market of professional villages in Henan Province—A case study of 50 professional villages. Geographical Research, 41(3): 794-809. (in Chinese)

[35]
Zhu Y Y, Yu B, Zeng J X, et al. 2015. Optimization of “production-life-ecology” space in national restricted development zones: The case of Wufeng County, Hubei Province. Economic Geography, 35(4): 26-32. (in Chinese)

Outlines

/