
Journal of Resources and Ecology >
Ecosystem Services Valuation and Payment for Livelihood Sustainability in the Indian Central Himalayan Region
Received date: 2021-04-29
Accepted date: 2022-03-08
Online published: 2023-04-21
This article examines the valuation and payment of ecosystem services for livelihood sustainability in the Indian Central Himalayan Region (ICHR). Data were gathered from both primary and secondary sources on biodiversity resources-tangible (goods) and intangible (services) as the Himalaya is a repository of these resources, also called ecosystem services. The ecosystem services are interlinked with the highlands (providers) and the lowlands (beneficiaries) and providing livelihoods to the large populations. Forests cover about 63% of the total geographical area with rich biodiversity. Water resources are abundant as about 42% of the national water need is met by the Ganga River and its tributaries that originate and flow through the region. The hydroelectricity generating capacity is about 30000 MW. The environmental sustainability index is high due to the clean and pollution-free environment. Agro-biodiversity is substantially high and therefore, several crop races/cultivars grow here, although, arable land is only 18%. However, the people of the highlands are unable to use these biodiversity resources optimally because of the rugged terrain, remoteness, and adverse situation. As a result, the people of the highlands are poor, facing acute malnutrition and food scarcity problems. Valuation of both tangible and intangible ecosystem services can be done and payment can be made. Taxes can be levied on the intangible resources mainly used by the downstream people and green bonuses can be paid to the upstream people.
Key words: ecosystem services; valuation; payment; biodiversity resources; ICHR
Vishwambhar Prasad SATI . Ecosystem Services Valuation and Payment for Livelihood Sustainability in the Indian Central Himalayan Region[J]. Journal of Resources and Ecology, 2023 , 14(3) : 468 -478 . DOI: 10.5814/j.issn.1674-764x.2023.03.004
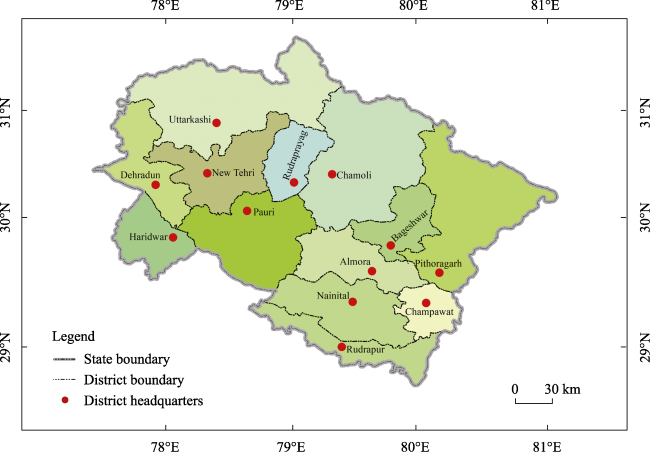
Fig. 1 Location map of Indian Central Himalayan Region |
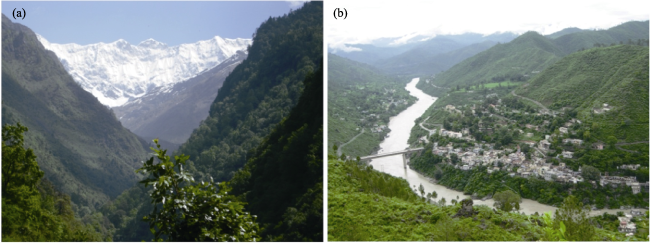
Fig. 2 Ecosystem services (a) the mighty Himalaya and highland forests ecosystem services, Kedarnath Valley; (b) water ecosystem services, the Alaknanda valley, near Srinagar Garhwal |
Table 1 Major rivers, their length, and annual drainage |
| River name | Outlet | Inlet | Length (km) | Annual drainage* (Million m3 yr-1) |
|---|---|---|---|---|
| Yamuna | Yamunotri | Dhalipur | 284 | 6495 |
| Kali | Kalapani (Nepal) | Ghagara River (UP) | 220 | 7300 |
| Bhagirathi | Gaumukh | Devprayag | 205 | 2533 |
| Alaknanda | Alkapuri Bank | Devprayag | 195 | 5342 |
| Ramganga | Dudhatoli Mountain | Ganga River (UP) | 155 | 5000 |
Note: Data was gathered from the ‘Survey of India Toposheeds’; *Report of the Central Water Commission of India, Sati, 2019. |
Table 2 Density and distribution of forest cover in Uttarakhand |
| Altitudinal zones | VDF (km2) | MDF (km2) | OF (km2) | Total area (km2) Proportion (%) | |
|---|---|---|---|---|---|
| <500 m | 548 | 1732 | 546 | 2826 | 11.65 |
| 500-1000 m | 1035 | 2189 | 794 | 4018 | 16.57 |
| 1000-2000 m | 1727 | 5477 | 2820 | 10024 | 41.35 |
| 2000-3000 m | 1345 | 3074 | 1202 | 5621 | 23.18 |
| 3000-4000 m | 99 | 1126 | 506 | 1731 | 7.14 |
| >4000 m | 0 | 4 | 16 | 20 | 0.08 |
| Total | 4754 | 13602 | 5884 | 24240 | |
| Proportion (%) | 19.61 | 56.11 | 24.47 | 100 | |
Note: Source: Sati (2018). VDF: Very Dense Forests; MDF: Moderate Dense Forests; OF: Open Forests. |
Table 3 Agro-ecological zones and agro-ecosystem services |
| Altitude (m) | Agro-ecological zone | Agro-ecosystem services | |
|---|---|---|---|
| <500 | Tropical | Cereals | Paddy, wheat, mustard, and sugarcane (Irrigated) |
| Fruits | Mango, guava, papaya, and litchi | ||
| Vegetables | Onion, tomato, beans, and green leaves | ||
| 500-1200 | Subtropical | Cereals | Paddy, wheat, barley, mustard, pulses, oilseed (Rainfed) |
| Fruits | Orange, elephant citrus, lemon, and plum (Citrus) | ||
| Vegetables | Onion, beans, tomato, and green leafy vegetables | ||
| 1200-2200 | Temperate | Cereals | Millets (twelve grains) including pulses and oilseeds |
| Fruits | Apple, pear, peach, and apricot | ||
| Vegetables | Potato, leafy vegetables, chili, eggplants, cucumber, pumpkin, bottle guard, garlic, and turmeric | ||
| >2200 | Alpine | Natural herbs and medicinal plants, alpine pasture lands of summer dwellers | |
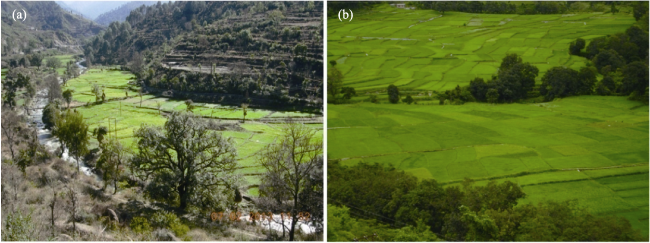
Fig. 3 Agroecosystem services (a) wheat and mustard crops are grown as Rabi crop in the Khanda Garh and (b) paddy is grown as a Kharif crop in the Maletha Village, the Alaknanda Basin |
Table 4 Tourists/Pilgrims’ inflow in the major pilgrimages and tourist places |
| Places | Altitude (m) | Number of tourists/pilgrims | ||
|---|---|---|---|---|
| 2000 | 2010 | Increased (%) | ||
| Haridwar | 314 | 5324639 | 8261078 | 35.50 |
| Nainital | 1939 | 39696 | 258713 | 84.70 |
| Mussoorie | 2000 | 850746 | 980921 | 13.30 |
| Gangotri | 3293 | 208407 | 329111 | 36.70 |
| Badrinath | 3415 | 695332 | 921950 | 24.60 |
| Kedarnath | 3553 | 300000 | 400014 | 25.00 |
| Yamunotri | 4421 | 88672 | 287688 | 30.82 |
Note: Source: Sati (2013). |
Table 5 General information about the village population, land use, and ecosystem services |
| Location | About 80 km from Dehradun to the northwest direction in Chakrata development block |
|---|---|
| Altitude (m) | 1500-1700 |
| Latitude | 30°40°58N |
| Longitude | 77°51°23E |
| Total households (number) | 60 |
| Total population (number) | 500 |
| Family size (mean value) | 8.3 |
| Settlement area (ha) | 50 |
| Area of community forests (ha) | 800 |
| Area of reserved forests (ha) | 2000 |
| Grassland (ha) | 1500 |
| Tree species | Pine, mixed oak, cedar, and coniferous |
| Water availability | Perennial natural springs |
| Agriculture | Rain-fed |
| Arable land (ha) | 200 |
| Crop diversity | High (principal crop races/cultivars: paddy, wheat, barley, millets, pulses, oilseeds, beans, apple, and citrus fruits) |
| Animal | Each household has a pair of oxen, a buffalo, goat, and a cow (average); mean value: 5 |
| Milk availability | High |
| Manure availability | High |
| Forest dependency | High |
| Wood requirement | Each household consume an average of 10 kg of wood during the summer and 20 kg of wood during the winter |
| Fodder requirement | Each household consume about 15 kg of dry grasses and 12 kg of green leaves per day |
| Out-migration | Household-level migration is negligible while about 10% of individuals seasonally out-migrated |
| Landscape and climate ecosystems | Panoramic landscape and climate. Local people have many resorts to facilitate the exodus of tourists |
| Forest ecosystem conservation | Local people along with forest department officials |
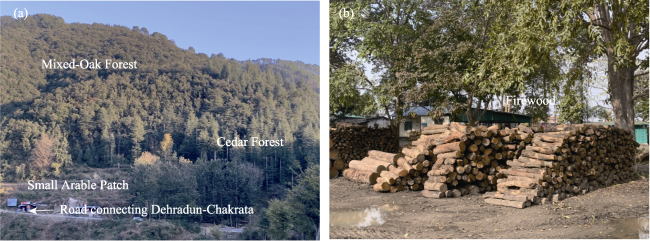
Fig. 4 Unique ecosystem services of the Korba Village |
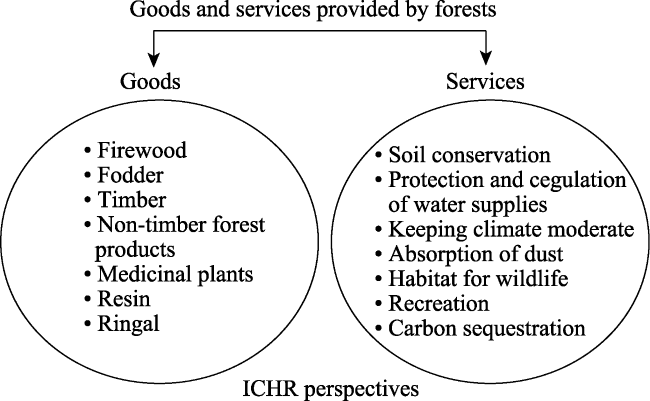
Fig. 5 (a) Forest ecosystem services and (b) Timber |
Fig. 6 Goods (tangible) and services (intangible) provided by forests in ICHR (Indian Central Himalayan Region) |
Table 6 Valuation of ecosystem services in ICHR |
| No. | Ecosystem service | Valuation (INR)* |
|---|---|---|
| Tangible benefits | ||
| 1 | Timber logging | 550 million |
| 2 | Fuelwood | 1900 million |
| 3 | Fodder (Collection) | 1370 million |
| 4 | Grazing | 6520 million |
| 5 | Minor forest produce | 490 million |
| 6 | Ecotourism | 8180 million |
| Intangible benefits | ||
| 7 | Watershed benefits | 1247610 million |
| 8 | Microclimatic factors | 2440 million |
| 9 | Carbon stock and flux | 279780 million |
| 10 | Biodiversity | 69890 million |
| 11 | Employment generation | 421 million |
| 12 | The total economic value of ecosystem services | 1619210 million |
Note: Source: Framework adapted from Verma, 2000 (as used in IIFM-CSO study, 2006). *Extrapolated value of forest and tree cover area in ICHR. |
| [1] |
|
| [2] |
|
| [3] |
|
| [4] |
|
| [5] |
|
| [6] |
|
| [7] |
|
| [8] |
|
| [9] |
|
| [10] |
|
| [11] |
|
| [12] |
|
| [13] |
GOI. 2009. Governance for sustaining Himalayan ecosystem: Guideline and best practices. New Delhi, India: Ministry of Environment and Forests, Government of India.
|
| [14] |
|
| [15] |
|
| [16] |
|
| [17] |
MA Millennium Ecosystem Assessment. 2005. Ecosystem and human well-being, Synthesis report. Washington DC, USA: Island Press.
|
| [18] |
|
| [19] |
|
| [20] |
MoEF. 2005. Proceedings of the national workshop on joint forest management. New Delhi, India: MoEF.
|
| [21] |
|
| [22] |
|
| [23] |
|
| [24] |
|
| [25] |
|
| [26] |
|
| [27] |
|
| [28] |
|
| [29] |
SFRI. 2005. Forest survey of India. Dehradun, India: Ministry of Environment & Forest, Government of India.
|
| [30] |
|
| [31] |
|
| [32] |
|
| [33] |
|
| [34] |
|
| [35] |
TEEB. 2009. TEEB climate issues update. Bonn, Germany: TEEB. www.teebweb.org/LinkClick.aspx?fileticket=L6XLPaoaZv8%3d&tabid=1278&language=en-US.
|
| [36] |
TEEB. 2010. The economics of ecosystems and biodiversity:An interim report. Brussels, Belgium: European commission. www.teebweb.org/LinkClick.aspx?fileticket u2fMSQoWJf0%3d&tabid=1278&language=en-US.
|
| [37] |
|
| [38] |
UK National Ecosystem Assessment. 2010. Progress and steps towards delivery. Cambridge, UK: UNEP-WCMC.
|
| [39] |
|
| [40] |
|
| [41] |
|
/
| 〈 |
|
〉 |