Plant Ecology

Response of Natural Regeneration of Pinus massoniana and Quercus variabilis Mixed Forest to Thinning Intensity and Environmental Factors

  • GUO Shiyu , 1 ,
  • SONG Dekai 2 ,
  • XU Zijing , 1, * ,
  • CHEN Shiyun 2 ,
  • CHEN Zeyan 2 ,
  • DU Peng 2 ,
  • WANG Yang 1
Expand
  • 1. Hubei Ecology Polytechnic College, Wuhan 430200, China
  • 2. Huashanzhai Forest Farm of Zhongxiang City, Zhongxiang, Hubei 431900, China
*XU Zijing, Email:

GUO Shiyu, E-mail:

Received date: 2021-12-02

  Accepted date: 2022-04-02

  Online published: 2023-02-21

Supported by

The Key Forestry Research Project Sponsored by Sino-German Financial Cooperation(zdczhz2021ky09)

The Key Forestry Research Project Sponsored by Sino-German financial cooperation(zdczhz2019ky01)

The Forest Sustainable Management Project Sponsored by Sino-German Financial Cooperation in Southern China (Hubei Province)(BMZ ID 2006 65 778)

Abstract

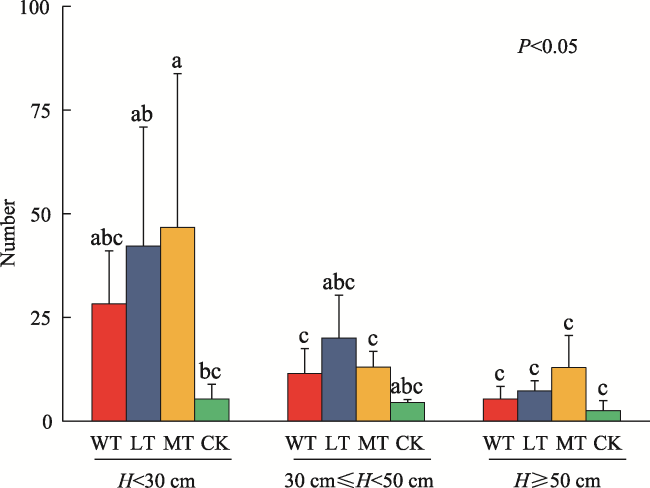
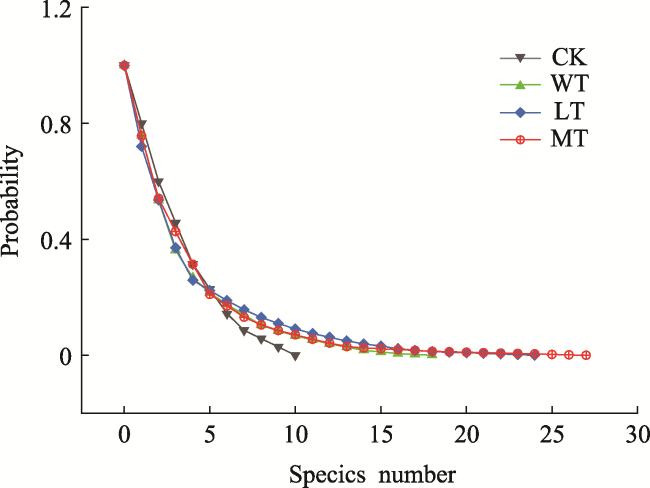
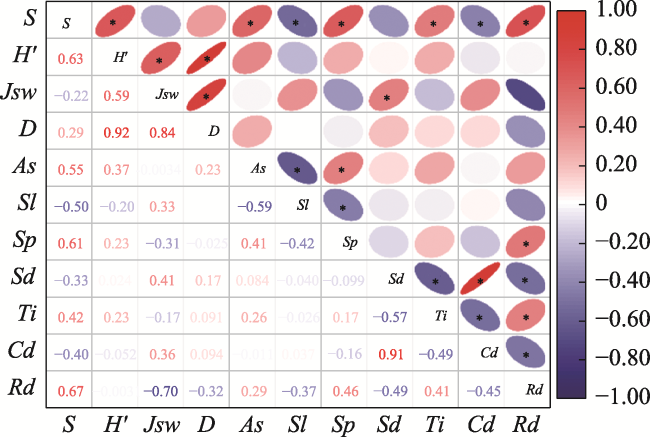
Based on target tree management, the effects of different thinning intensities and environmental factors on the natural regeneration of a Pinus massoniana and Quercus variabilis mixed forest were explored in order to provide a theoretical basis for the natural regeneration and sustainable forest management of P. massoniana and Quercus L. mixed forests. Taking the mixed forest after thinning as the research object, three average thinning intensities of WT (7.6%) for weak thinning, LT (15.3%) for light thinning, and MT (24.3%) for moderate thinning were carried out in 5 m×5 m quadrats with 7-10 replicates for each intensity level and 3 replicates for the control. Three years after the thinning, the amount of natural regeneration, growth height, regeneration density, diversity of regenerated tree species and their influencing factors at different thinning intensities were measured and analyzed. The results indicated four main features of the subsequent regeneration. (1) There were 32 species of vascular plants in the 28 quadrats 3 years after thinning, belonging to 22 families and 30 genera, and the dominant species for regeneration were arbor species. The number of regeneration species increased with increasing thinning intensity. (2) As thinning intensity increased, the number of natural regeneration plants between various height classes rose; so, the increased thinning intensity promoted the density of different height classes during regeneration. (3) As thinning intensity increased, so did species abundance S and species evenness. The degree and intrinsic diversity increased, while the Shannon-Weiner and Simpson indices showed no discernible trends. (4) Slope, aspect, and slope position, as well as thinning intensity, all had significant impacts on species richness, species evenness, and regeneration density. MT has the most appropriate promoting effect on natural regeneration and species diversity, so increased thinning intensity can promote natural regeneration and species diversity in the P. massoniana and Q. variabilis mixed forest. In addition, aspect and slope position can increase the species richness S and diversity of natural regeneration, whereas slope has a clear inhibitory effect on the species richness S and diversity during natural regeneration.

Cite this article

GUO Shiyu , SONG Dekai , XU Zijing , CHEN Shiyun , CHEN Zeyan , DU Peng , WANG Yang . Response of Natural Regeneration of Pinus massoniana and Quercus variabilis Mixed Forest to Thinning Intensity and Environmental Factors[J]. Journal of Resources and Ecology, 2023 , 14(2) : 423 -432 . DOI: 10.5814/j.issn.1674-764x.2023.02.020

1 Introduction

Natural regeneration is a process in which forest ecosystems continuously improve themselves in time and space, spontaneously repairing the ecosystems by relying on natural forces (Chazdon and Guariguata, 2016). Natural regeneration replenishes enough seedlings and saplings to form a continuous coverage, stable and healthy forest ecosystem, which affects the future species composition and stand structure of the forest. Natural regeneration, therefore, has a decisive impact on future forest biodiversity and forest structure and the study of natural regeneration is of great significance to the succession and sustainable management of natural forests.
The interaction between the environment and plants is an intrinsic feature of forest communities (Adams et al., 2005), and this interaction has a great impact on the forest regeneration process (Li et al., 2012; Rocha et al., 2016; Caughlin et al., 2018). Each process of forest self-improvement is affected by various external factors and the interactions of the factors (Olson et al., 2014; Gavinet et al., 2016; Piiroinen et al., 2017). However, the natural process of forest regeneration is relatively slow. Forest management is the main technical measure for man-made disturbance of forest ecosystems (Yan et al., 2019). Reasonable forest management intensity can improve stand quality, enhance stand stability, increase stand productivity, and give full play to the ecological benefits of forests (Dong et al., 2019). Many scholars have studied the effects of different forest management intensities on soil physicochemical properties (Liu et al., 2019), species diversity (Yan et al., 2019), stand structure (Wei et al., 2019), stand growth (Zhang et al., 2020), the situation of stand mixture (Cao et al., 2021), and many other aspects, and a large number of studies have demonstrated the promotion effect of rational forest management on forest regeneration. However, different stand conditions, tree species compositions, stand factors and environmental factors are all prerequisites that affect natural regeneration (Fischer et al., 2016). Determining how to promote natural regeneration and ultimately achieve stand transformation with a suitable forest management model based on the stand environment is extremely important in management practice, and its related research is indispensable.
For many years, coniferous forests have suffered from a series of problems, such as severe declines in biodiversity and soil fertility, ecological functions and productivity (Yang, 2005), and pine wood nematode disease has become a very serious problem for the Pinus plants in Hubei (Xu et al., 2021). Therefore, it is very urgent to transform the stands with P. massoniana as the dominant tree species, and tree species regeneration is the key to realizing this transformation. The close-to-nature forest management approach originated in Germany and is currently an advanced, internationally-recognized forest management method (Guo et al., 2021b). With close-to-nature forest management, Bavaria successfully transformed its coniferous forests, which greatly increased the proportion of broad-leaved forests in mixed coniferous and broad-leaved forests, and greatly improved forest quality (Guo et al., 2021a). This study took the natural mixed forest of P. massoniana and Quercus variabili after 3 years of target tree management in Huashanzhai Forest Farm, Zhongxiang City, as the research object, selected three types of stands with different average thinning intensities, and set up sample plots taking different terrain conditions into account. Our purposes were to study the effects of natural regeneration on the number of natural regeneration species, regeneration quantity, plant growth characteristics and the diversity of regenerated species resulting from different thinning intensities; to explore the responses of natural regeneration to stand factors and environmental factors; and to reveal the most appropriate thinning intensity that affects the natural regeneration of P. massoniana and Q. variabili forests. The results of this study can provide a theoretical basis for promoting the conversion of coniferous and broad-leaved forests in this area and for increasing the proportion of broad-leaved tree species in mixed coniferous and broad-leaved forests.

2 Materials and methods

2.1 Overview of the research site

The research site is located in the Heihuya branch of Huashanzhai State-owned Forest Farm (112°45°48ʺ- 112°46°15ʺE, 31°24°00ʺ-31°25°00ʺN), Zhongxiang City, Hubei Province, with a total area of 2 600 ha. This area has a subtropical monsoon climate, with four distinct seasons and the same period of rain and heat. The average annual temperature is about 16.4 ℃, the annual precipitation is 1100 mm, which is mostly concentrated in April-August, and the frost-free period is 240 d throughout the year. The site is a low-mountain hilly landform with a gentle slope. Most of the forestry sub-compartments have a slope between 15° and 25°, and the altitude range is between 150 m and 300 m. The soil is mostly limestone-developed yellow loam, and the soil thickness is evenly distributed, generally 30-50 cm. The forest land of the research site is a P. massoniana forest that was air-seeded in the 1980s. The vegetation is mainly coniferous and broad-leaved mixed forest, and the dominant tree species is P. massoniana, with tree ages spanning 32-36 years. The subdominant tree species are mainly Q. variabilis, followed by Ilex chinensis, Pistacia chinensis and Cupressus funebris. The main regenerated tree species are Q. variabilis, Ilex chinensis, Cupressus funebris and Pistacia chinensis; the main shrubs are Lindera glauca, Mallotus apelta and Vitex negundo; and the main herbs are Carex breviculmis, Phaenosperma globosa, Lophatherum gracile, Oplismenus undulatifolius, and others.

2.2 Plot setting and investigation

With the goal of cultivating multi-functional forests and funding from the Sino-German Financial Cooperation Project on Sustainable Forest Management in Southern China, 15 forestry sub-compartments in the Heihuya branch farm were surveyed in November 2017, and the stand factors covering canopy density and other indicators were determined. The average distance between target trees was 8.8 m (average 165 trees ha-1). Due to the epidemic of pine wood nematode, broad-leaved tree species were preferentially chosen as the target trees under the same conditions; and 1-3 disturbing trees were felled for each target tree, along with a small amount of poor-quality trees and vines that affected tree growth in the stand. The target-tree management was carried out in February 2018, with a total area of 133.3 ha. The average thinning intensity was calculated according to the stand volume before and after the management, and 5 m × 5 m fixed quadrats were randomly set according to different thinning intensities to observe the subsequent natural regeneration. Among the 28 quadrats set for the four treatments, weak thinning WT (7.6%) was repeated 8 times, light thinning LT (15.3%) was repeated 7 times, moderate thinning MT (24.3%) was repeated 10 times and control CK (0%) was repeated 3 times. The stand density, canopy closure, slope, aspect and slope position were recorded, and the species of trees and shrubs that were naturally regenerated in the quadrats were recorded and marked in November each year after thinning. In November 2020, the numbers and plant heights of naturally regenerated species were recorded. The basic information for the stands and quadrats is shown in Table 1.
Table 1 Basic conditions of sampling plots
Thinning
intensity
Quadrat
No.
Composition of trees Aspect Slope
(°)
Slope
position
DBH (cm) Tree height
(m)
Canopy
density
Stand density
after thinning
(plants ha-1)
WT 1 Pm: Qv: Cf (7:2:1) E 6 up 13.00±3.72 10.67±1.22 0.82 1577
2 Pm: Qv :Cf (6:3:1) NW 7.5 middle 13.36±5.06 11.04±1.21 0.84 1535
3 Pm: Qv: Cf: Ic (4: 4:1:1) S 6.5 middle 12.96±5.18 10.54±1.23 0.84 1395
4 Pm: Qv: Cf (6:3:1) SE 5 down 15.14±4.56 12.22±1.24 0.85 1231
5 Pm: Qv (7:3) NW 5 down 15.38±4.75 12.56±1.22 0.81 1382
6 Pm: Qv: Cf (7:2:1) E 6 middle 17.33±6.98 12.86±1.35 0.79 1425
7 Pm: Qv: Cf (7:2:1) S 10 down 15.56±4.59 12.66±1.23 0.80 1580
8 Pm: Qv: Cf (7:2:1) E 6 down 14.00±4.12 11.49±1.22 0.82 1635
LT 9 Pm: Qv: Cf (7:2:1) NE 9.5 down 14.67±4.37 11.94±1.23 0.72 1055
10 Pm: Qv: Cf: Ic (6:2:1:1) SE 4.5 middle 14.06±4.83 11.82±1.19 0.75 1266
11 Pm: Qv: Cf (6:2:2) S 4.5 down 16.67±7.59 13.23±1.26 0.75 1302
12 Pm: Qv: Cf (7:2:1) SE 5 down 15.45±6.05 12.17±1.27 0.65 972
13 Pm: Qv: (7:3) S 4.5 middle 14.91±4.43 11.93±1.25 0.75 1569
14 Pm: Qv (7:3) SW 6.5 middle 14.41±4.97 12.02±1.20 0.79 1302
15 Pm: Qv: Cf (8:1:1) E 15.5 down 15.55±4.52 12.08±1.29 0.77 1149
MT 16 Pm: Qv (8:2) N 15.5 down 17.45±4.29 13.22±1.32 0.71 935
17 Pm: Qv: Cf (6:3:1) N 11 down 14.26±4.16 11.42±1.25 0.80 1181
18 Pm: Qv (7:3) N 15.5 down 14.92±4.81 11.84±1.26 0.70 956
19 Pm: Qv (8:2) E 9.5 down 14.70±4.54 11.77±1.25 0.60 680
20 Pm: Qv (9:1) S 5 up 17.57±5.56 13.11±1.34 0.71 971
21 Pm: Qv: Cf (6:3:1) W 10 down 15.92±7.12 12.44±1.28 0.68 818
22 Pm: Qv (9:1) E 6.5 up 15.71±3.39 12.60±1.25 0.60 649
23 Pm: Qv (8:2) S 11 middle 17.72±6.36 13.32±1.33 0.75 894
24 Pm: Qv: Cf (7:2:1) W 9.5 up 15.43±4.78 11.96±1.29 0.65 726
25 Pm: Qv (8:2) SE 8.5 up 18.09±7.64 13.11±1.38 0.65 793
CK 26 Pm: Qv: Cf (6:3:1) E 10 middle 12.65±6.10 11.307±1.12 0.92 2121
27 Pm: Qv: Cf: Pc (2:6:1:1) E 12.5 middle 11.31±4.45 12.64±1.06 0.90 1661
28 Pm: Qv: Cf (7:2:1) E 13.5 down 12.84±4.48 11.27±1.14 0.90 2052

Note: WT: weak thinning; LT: light thinning; MT: moderate thinning; CK: control; and the same applies to the other figures and tables. Pm: Pinus massoniana; Qv: Quercus variabilis; Cf: Cupressus funebris; Ic: Ilex chinensis; Pc: Pistacia chinensis.

2.3 Data analysis

2.3.1 Regeneration density

Regeneration density Rd was applied to describe the natural regeneration characteristics for the different thinning intensities.
Rd=$\frac{{{R}_{t}}}{{{A}_{t}}}$×10000
where Rd is the species regeneration density (plants ha-1), Rt is the total number of natural regeneration plants in the research unit, and At is the area of the research unit (25 m2).

2.3.2 Diversity of regenerated species

Species diversity characteristics were analyzed using the species richness index S, Shannon-Weiner index H′, Pielou evenness index Jsw, Alatalo evenness index Ea and Simpson index D.
Species richness:
R=S
Simpson index:
$~D=1-\sum\limits_{i=1}^{n}{p_{i}^{2}}$
Shannon-Weiner index:
${H}'=-\sum\limits_{i=1}^{n}{{{p}_{i}}\text{ln}{{p}_{i}}}$
Pielou evenness index:
${{J}_{sw}}=-\frac{\sum\limits_{i=1}^{n}{{{p}_{i}}\text{ln}{{p}_{i}}}}{\text{ln}S}$
Alatalo evenness index:
${{E}_{a}}=\frac{\left( \sum\limits_{i=1}^{n}{p_{i}^{2}-\text{1}} \right)-\text{1}}{\text{exp}\left( -\sum\limits_{i=1}^{n}{{{p}_{i}}\text{ln }{{p}_{i}}} \right)-\text{1}}$
where S indicates the total number of species in the quadrat in which species i is located; and pi is a ratio of the number of the ith species to the total number of plants in the quadrat.

2.3.3 Intrinsic diversity of regenerated species

Due to the inconsistency between the Shannon-Weiner index and the Simpson index in diversity comparisons, we used the intrinsic diversity defined by Patil to compare the right-tailed sum curves of species in different thinning intensities (Patil and Taillie, 1982; Lei and Tang, 2002). The intrinsic diversity is defined as follows: for species abundance vector P=(P1P2≥…≥Pn) arranged in descending order, Tj=$\sum\limits_{i=j+1}^{s}{{{P}_{i}}}$∈[01], j=1, 2, …, s, Tj is the right-tailed sum curve or intrinsic diversity curve of P. If the whole right-tailed sum of community C′ is greater than the right-tailed sum of the community C, namely: ${{{T}'}_{k}}$=$\sum\nolimits_{i>k}{{{{{P}'}}_{k}}}$Tk$\sum\nolimits_{i\text{}k}{{{P}_{i}}}$, k=1, 2, …, then the intrinsic diversity of community C' is greater than C, that is, C'C (Tang et al., 2009).

2.3.4 Environmental factor index conversion

According to the grading method of slope aspect, slope and slope position proposed by Zheng et al. (2009), the slope aspect was divided into eight grades according to the lighting conditions, and the slope position was divided into three grades from bottom to top (1-3 in order). The transformed values were used for the correlation analysis of environmental factors, natural regeneration density and species diversity.
Origin2021 was used to conduct intra-group and inter-group variance analyses on the natural regeneration quantities of different plant heights, and to conduct correlation analyses on different thinning intensities, stand factors, environmental factors, stand regeneration density and regeneration species diversity. Forstat was used to compare the intrinsic diversity of thinning intensities.

3 Results

3.1 Effects of thinning on quantitative characteristics of naturally regenerated species

The main regenerated species are listed in Table 2. Increasing thinning intensity had a great impact on the composition and quantity of the natural regeneration species. Three years after thinning, there were 32 naturally regenerated vascular plants, belonging to 22 families and 30 genera. They included 22 species of trees in 17 families and 19 genera. The dominant tree species were C. funebris, I. chinensis, Q. variabilis, R. chinensis and Symplocos sumuntia. There were 11 species of shrubs in 11 genera of 10 families. The dominant shrub species were M. apelta, Pittosporum truncatum, and Lindera glauca. The increase in plant composition of the tree regeneration species was greater than that of the shrub layer after thinning. The trees (7 species) and shrubs (3 species) in the CK quadrats were the fewest. With the increase of thinning intensity, the probability of species emergence gradually increased. In the WT, LT and MT intensities, the tree species increased by 85.7%, 128.6% and 142.9% compared with CK, respectively; while the shrub species increased by 66.7%, 166.7% and 200.0% compared with CK, respectively. With the increase of thinning intensity, the natural regeneration showed a change in the tendency from species that were suitable for shade tolerance at a young age (such as C. funebris, M. apelta, and Symplocos sumuntia) to positive species (such as Mallotus sebifera, P. massoniana and Celtis sinensis), indicating that the understory light, temperature and humidity conditions were improved with an increase in the thinning intensity. Therefore, increasing thinning intensity accelerated the species regeneration and community succession, which was beneficial to the richness of the regenerated species.
Table 2 Regenerated species associated with different thinning intensities
Family Genus Species CK WT LT MT
Cupressaceae Cupressus C. funebris
Euphorbiaceae Vernicia V. fordii
Euphorbiaceae Triadica T. sebifera
Euphorbiaceae Mallotus M. apelta
Euphorbiaceae Glochidion G. puberum
Aquifoliaceae Ilex I. cornuta
Aquifoliaceae Ilex I. chinensis
Fabaceae Dalbergia D. hupeana
Fabaceae Albizia A. kalkora
Ericaceae Rhododendron R. simsii
Eucommiaceae Eucommia E. ulmoides
Pittosporaceae Pittosporum P. truncatum
Juglandaceae Platycarya P.strobilacea
Fagaceae Quercus Q. variabilis
Meliaceae Melia M. azedarach
Verbenaceae Vitex V. negundo
Oleaceae Ligustrum L. lucidum
Anacardiaceae Cotinus C. coggygria
Anacardiaceae Rhus R. chinensis
Anacardiaceae Pistacia P. chinensis
Rosaceae Dichotomanthes D. tristaniicarpa
Rosaceae Prunus P. salicina
Moraceae Broussonetia B. papyrifera
Symplocaceae Symplocos S. sumuntia
Staphyleaceae Euscaphis E. japonica
Ebenaceae Diospyros D. kaki
Ebenaceae Diospyros D. lotus
Rhamnaceae Ziziphus Z. jujuba
Pinaceae Pinus P. massoniana
Ulmaceae Celtis C. sinensis
Rutaceae Zanthoxylum Z. avicennae
Lauraceae Lindera L. glauca

3.2 Effects of thinning on plant height and regeneration density of the regenerated species

There were significant differences in the numbers of different height grades among the natural regeneration trees in different thinning intensities 3 years after thinning (Fig. 1). There were significant differences between MT and CK in the growing height of regenerated plants at the plant height classes of H<30 cm, 30 cm≤H<50 cm and H≥50 cm (P< 0.05). However, there were no significant differences between LT and the other thinning intensities in the height of regenerated plants at the height level of H<30 cm, while there were significant differences between LT and the other thinning intensities at the height levels of 30 cm≤H<50 cm and H≥50 cm (P<0.05). There were no significant differences in the height of regenerated species with different thinning intensities between the height classes of 30 cm≤H<50 cm and H≥50 cm. The differences between different thinning intensities and between different plant heights gradually decreased with an increase in the plant height classes.
Fig. 1 Height distribution of regenerated trees in different thinning intensities
The data in Table 3 show that the regeneration density distribution was different among the different height classes. Three years after thinning, the total natural regeneration densities of WT, LT and MT increased by 13383, 23104 and 24355 plants ha-1, respectively, compared with CK. The total density of the different height classes under natural regeneration was significantly higher than that of CK. Except for the height class of 30 cm≤H<50 cm, the regeneration densities of the other height classes increased with an increase in the thinning intensity, indicating that increasing the thinning intensity could effectively promote the quantity of natural regeneration of understory plants on the whole.
Table 3 Natural regeneration seedling heights and regeneration densities at each thinning intensity
Thinning
intensity
Different height class (H) regeneration densities
(plants ha-1)
H<30 cm 30 cm≤H<50 cm H≥50 cm Total
CK 2133 2000 533.2 4667
WT 11300 4600 2150 18050
LT 16857 8000 2914 27771
MT 18667 5200 5156 29022

3.3 Effects of thinning on the diversity of regenerated species

There were significant differences between species richness S, Pielou evenness index Jsw and Alatalo index Ea among the different thinning intensities (P<0.05), but no significant differences in the Shannon-Weiner index H′ or Simpson index D (Table 4). The mean S values of the different thinning intensities were all higher than that of CK (5.67). The mean S in LT was the highest (9.57), the mean S in MT was the second (9.55), and the mean S in WT (7.38) was only slightly higher than in CK. The H′ and D of regenerated plant species had no obvious trends of change among the different thinning intensities. Jsw (0.92) and Ea (0.87) were the highest in CK, while Jsw (0.73) and Ea (0.68) were the lowest in MT, indicating that increasing thinning intensity could promote the aggregation of regenerated species.
Table 4 Richness and diversity of regenerated species in the undergrowth
Thinning
intensity
S D H Jsw Ea
CK 5.67±0.58b 0.75±0.03a 1.52±0.18a 0.92±0.03a 0.87±0.06a
WT 7.38±2.20ab 0.70±0.14a 1.49±0.39a 0.77±0.13b 0.74±0.12ab
LT 9.57±4.08a 0.73±0.10a 1.63±0.38a 0.75±0.09b 0.70±0.08b
MT 9.55±2.55a 0.70±0.11a 1.54±0.24a 0.73±0.13b 0.68±0.15b
Table 5 shows the multiple comparisons of the diversities of regenerated species for the different thinning intensities, and Fig. 2 shows the right-tail sum curve graphs of comparable diversities for the different thinning intensities. Among the different thinning intensities, the order of intrinsic diversities of regenerated plant species was: MT≥LT≥WT≥CK, and the increase in thinning intensity effectively promoted greater diversity of the regenerated species.
Table 5 Multiple comparisons of intrinsic diversities of regenerated tree species
Thinning
intensity
Species count Intrinsic diversity higher than the stand Intrinsic diversity lower than the stand
CK 10 CK≤WT, LT, MT ≤CK
WT 18 WT≤LT, MT CK≤WT
LT 24 LT≤MT CK, WT≤LT
MT 27 MT≤ CK, WT, LT≤MT
Fig. 2 The curves of right-tailed sums of diversities of regenerated tree species for the different thinning intensity levels

3.4 Impact of stand and environmental factors on natural regeneration

The correlations between stand and environmental factors on natural regeneration (Fig. 3) show that slope aspect was positively correlated with species richness S (R=0.52). There was a significant negative correlation between slope and S (R=-0.49), and a significant negative correlation with regeneration density (R=-0.45). Slope position and S (R=0.60) were significantly positively correlated. Stand density and S (R=-0.34) were negatively correlated but not significantly, and stand density was significantly positively correlated with the Pielou index Jsw (R=0.47). Thinning intensity was positively correlated with S (R=0.49), and had a significant negative correlation with stand density (R= -0.79). Canopy density was significantly positively correlated with stand density (R=0.88), and significantly negatively correlated with both S (R=-0.42) and thinning intensity (R=-0.76). Regeneration density was significantly positively correlated with both S (R=0.72) and thinning intensity (R=0.55), while regeneration density was significantly negatively correlated with Jsw (R=-0.67), slope (R=-0.45), stand density (R=-0.49) and canopy density (R=-0.43). Thus, environmental factors and thinning intensity profoundly affected species richness, evenness and regeneration density.
Fig. 3 Effects of stand factors and environmental factors on regeneration

Note: P<0.05; S: Richness; H′: Shannon-Weiner index; Jsw: Pielou evenness; D: Simpson index; As: Aspect; Sl: slope; Sp: slope position; Sd: stand density; Ti: thinning intensity; Cd: canopy density; Rd: regeneration density.

4 Discussion

4.1 Effect of thinning intensity on natural regeneration

Thinning effectively increased the number and regeneration density of natural regenerated species in the mixed forest of P. massoniana and Q. variabilis, and promoted the growth potential of regenerated woody plants. There are many factors that affect the growth of understory vegetation, and the fundamental driver is the competition between the upper trees and understory vegetation for light, water, and nutrients (Wang et al., 2014). The enhanced light environment in the thinned understory was beneficial for allowing seedlings and young trees to absorb water from the soil, accelerating the decomposition of organic matter, and increasing soil fertility (Gong et al., 2015). By selectively felling the interfering trees and inferior trees that had a negative impact on the growth of target trees, the competition environment under the mixed P. massoniana and Q. variabili forest was improved, the light environment, temperature and physiological and biochemical conditions were enhanced, and the natural regeneration of the forest was promoted. In this study, the regenerated P. massoniana showed the largest number at the MT intensity, but there were none in CK, indicating that the understory light environment is an important limiting factor for the growth and development of light-loving saplings (Bellow and Nair, 2003). With the increase of thinning intensity, the number of naturally regenerated woody plants showed an upward trend, which might be due to the fact that the regenerated woody species were mainly composed of light-loving plants, such as P. massoniana, Q. variabilis, and I. chinensis. Q. variabilis is a light-loving species with a large seed-bearing capacity and strong tillering ability, and it has broad adaptability to environmental conditions (Lu et al., 2006). Among the different thinning intensities, the sum of natural regeneration quantity, regeneration density and regeneration frequency of Q. variabilis was the largest in each thinning intensity, which was consistent with the research results of Li et al. (2011) on the natural regeneration of Quercus wutaishanica. The average intensity level of MT was 24.3%, and the number of regenerated plants and regeneration density of each dominant species were relatively higher, while the species richness S and intrinsic diversity were the highest, followed by LT (15.3%) and WT (7.6%). The regeneration number, regeneration density and growth potential of natural regeneration species at different heights with different thinning intensities were all much higher than those of CK, indicating that target tree management had a better effect on promoting natural regeneration, and was conducive to promoting the stratification, a range of different ages and mixed construction of stands (Xiao et al., 2019).

4.2 Effect of thinning on the diversity of regenerated woody species

Thinning could improve the understory vegetation richness and diversity index (Hurlbert, 1971). Theoretically, there should be a corresponding relationship between natural regeneration and the diversity of regenerated species and thinning intensity, that is, as the thinning intensity increases, the species richness should also increase. However, the commonly used diversity indices are known to be inconsistent when they are compared between communities (Lei and Tang, 2002). In this study, the Shannon-Weiner index and Simpson index of natural regeneration had no obvious trends with different thinning intensities, which made the diversity of the regeneration species incomparable. Thus, the intrinsic diversity of the community was defined according to the right-tailed curve (Patil and Taillie, 1982), and through multiple comparisons, the species diversities associated with different thinning intensities can be compared, and the community with high intrinsic diversity has truly high diversity (Lei and Tang, 2002). After this analysis, the intrinsic diversity of the natural regeneration species at each thinning intensity was higher than that of CK, and the intrinsic diversity of MT was the highest. These results showed that moderate thinning increased the survival chances of community species, with the largest number of species and the highest diversity, which was consistent with the moderate disturbance theory proposed by Connell (1978) and Hari (2021). These research results were also in accordance with the conclusions put forward by Zhang et al. (2017) and Yan et al. (2019), that increasing thinning intensity could promote the diversity of natural regeneration species.

4.3 Responses of natural regeneration to stand and environmental factors

Correlation analyses showed that the greater the value of the slope aspect, the better the light conditions, and the greater the positive effect on the species richness S (R=0.52) of regenerated woody species in the mixed forest of P. massoniana and Q. variabili. In this study, there was a significant negative correlation between slope and species richness S (R=-0.49), indicating that slope changes alone did not effectively promote natural regeneration, which might be due to the comprehensive effects of slope, slope aspect and slope position on natural regeneration. Natural regeneration is an extremely complex ecological process with many influencing factors. Environmental conditions, natural and human disturbances, the biological and ecological characteristics of the regeneration tree species, and the relationships with associated species all have a great impact on the regeneration process (Li et al., 2012; Rocha et al., 2016; Caughlin et al., 2018).
In a given area, changes in different topographical features have an impact on plant community structure and species composition by affecting the stand light conditions, soil nutrients, water and temperature (Peterson and Baldwin, 2004). Changes in topography often lead to changes in key environmental factors such as light, temperature, and humidity, which have an important impact on species composition (Sweson et al., 2011), and are therefore important indirect environmental factors (Cantón et al., 2004). Since the slope aspect affects the intensity and timing of solar radiation received by plants, and greatly affects the ambient temperature (Hutchinson et al., 1999), Ou et al. (2011) proposed that the slope aspect is one of the main factors affecting the hydrothermal conditions in subtropical montane forests. In a study of the regeneration of Castanopsis hystrix, Deng et al. (2013) found that slope position was a major environmental factor affecting the regeneration of red cones. Hosseinzadeh et al. (2016) studied the relationship between woody plant species diversity and terrain factors, and found that when the slope is less than 15º and the slope aspect is shady, there is no difference in the change in diversity. Due to the large differences in regions, species, topography and landforms among different experiments, the distribution and diversity characteristics of plant communities are often variable due to factors such as slope and slope position (Wen and Jin, 2019). In this study, the quadrats with MT intensities had the steepest slope (15.5º) and the slope aspects were north or east, the value of the slope aspect was lower, and most of the quadrats were located on the downslope. Therefore, due to the combined impact of the multiple factors of slope aspect, slope and slope position, the effect of increasing thinning intensity on improving the understory light and thermal conditions was weakened, resulting in the overall low level of natural regeneration and species diversity in the LT and MT intensities. At the same time, the increase in the Pielou index Jsw indicated that the comprehensive effect of slope aspect, slope and slope position had a certain influence on the species distribution patterns of the different growth types of plants (Ou et al., 2011).

5 Conclusions

Targeted tree management significantly improves the light environment of the managed stands, and promotes the quantity of natural regeneration and the diversity of regenerated species in the understory. Under the premise of the same environmental conditions, with an increase in the thinning intensity, the number of natural regeneration species, species richness and species diversity in the mixed forest of P. massoniana and Q. variabilis increased accordingly. Moderate thinning (MT, 24.3%) was the optimal thinning intensity for natural regeneration. Due to restrictions by the relevant policies for forest thinning in Hubei Province, the maximum thinning intensity of this project was limited to about 25%. Whether further increases in the thinning intensity would be more conducive to the natural regeneration of the mixed forest of P. massoniana and Q. variabilis needs to be further verified in practice.
[1]
Adams V M, Marsh D M, Knox J S. 2005. Importance of the seed bank for population viability and population monitoring in a threatened wetland herb. Biological Conservation, 124: 425-436.

[2]
Bellow J G, Nair P. 2003. Comparing common methods for assessing understory light availability in shaded-perennial agroforestry systems. Agricultural and Forest Meteorology, 114(3/4): 197-211.

[3]
Cantón Y, Barrio G D, Solé-Benet A, et al. 2004. Topographic controls on the spatial distribution of ground cover in the Tabernas badlands of SE Spain. CATENA, 55(3): 341-365.

[4]
Cao H, Zhang C Y, Gong X F, et al. 2021. Effect of target tree management in subtropical secondary evergreen broad-leaved forest. Journal of Zhejiang Forestry of Sciences and Technology, 41(4): 15-23. (in Chinese)

[5]
Caughlin T T, Peña-Domene M, Martínez-Garza C. 2018. Demographic costs and benefits of natural regeneration during tropical forest restoration. Ecology Letters, 22(1): 34-44.

[6]
Chazdon R L, Guariguata M R. 2016. Natural regeneration as a tool for large-scale forest restoration in the tropics: Prospects and challenges. Biotropica, 48(6): 716-730.

[7]
Connell J H. 1978. Diversity in tropical rain forests and coral reefs. Science, 199(4335): 1302-1310.

[8]
Deng S K, Liao S S, Huang B H, et al. 2013. Natural regeneration and its influencing factors of Castanopsis hystrix plantation at Pingxiang, Guangxi. Guangxi Forestry Science, 42(1): 48-51, 60. (in Chinese)

[9]
Dong L L, Zhao J C, Wang C C, et al. 2019. Study on diameter structure and growth dynamics of mixed Quercus mongolica broad-leaved natural stands after tending thinning. Journal of Southwest Forestry University, 39(6): 98-104. (in Chinese)

[10]
Fischer H, Huth F, Hagemann U, et al. 2016. Developing restoration strategies for temperate forests using natural regeneration processes. In: Stanturf J A(Restoration of boreal and temperate forests(second edition). Boca Raton, USA: CRC Press:103-164.

[11]
Gavinet J, Prévosto B, Femandez C. 2016. Do shrubs facilitate oak seedling establishment in Mediterranean pine forest understory? Forest Ecology and Management, 381: 289-296.

[12]
Gong G T, Niu M, Mu C L, et al. 2015. Impacts of different thinning intensities on growth of Cupressus funebris plantation and understory plants. Scientia Silvae Sinicae, 51(4): 8-15. (in Chinese)

[13]
Guo S Y, Forster H, Chen X L. 2021a. Target tree management: German experience and Hubei practices. World Forestry Research, 34(2): 14-20. (in Chinese)

[14]
Guo S Y, Zhou X L, Shi L Z, et al. 2021b. Effectiveness of close-to-nature forest management in Bavaria of Germany. Forest Inventory and Planning, 46(1): 129-134. (in Chinese)

[15]
Hari P. 2021. Implications of anthropogenic disturbances for species diversity, recruitment and carbon density in the mid-hills forests of Nepal. Journal of Resources and Ecology, 12(1): 1-10.

[16]
Hosseinzadeh R, Soosani J, Alijani V, et al. 2016. Diversity of woody plant species and their relationship to physiographic factors in central Zagros forests (Case study: Perc forest, Khorramabad, Iran). Journal of Forestry Research, 27(5): 1137-1141.

[17]
Hurlbert S H. 1971. The nonconcept of species diversity: a critique and alternative parameters. Ecology, 52: 577-586.

[18]
Hutchinson T F, Boerner R E J, Iverson L R, et al. 1999. Landscape patterns of understory composition and richness across a moisture and nitrogen mineralization gradient in Ohio (USA) Quercus forests. Plant Ecology, 144: 177-189.

[19]
Peterson J E, Baldwin A H. 2004. Seedling emergence from seed banks of tidal fresh water wetlands: Response to inundation and sedimentation. Aquatic Botany, 78: 243-254.

[20]
Lei X D, Tang S Z. 2002. Community intrinsic diversity ordering and its application. Forest Research, 15(3): 285-290. (in Chinese)

[21]
Li R, Zhang W H, He J F, et al. 2011. Effect of thinning on natural regeneration and growth of Quercus wutaishanica saplings. Journal of Northwest A&F University(Natural Science Edition), 39(1): 52-60. (in Chinese)

[22]
Li Y Y, Tsang E P K, Cui M Y, et al. 2012. Too early to call it success: An evaluation of the natural regeneration of the endangered Metasequoia glyptostroboides. Biological Conservation, 150(1): 1-4.

[23]
Liu L, Cai M K, Liu X, et al. 2019. Effects of thinning on ecological stoichiometry C, N and P in leaves, roots and soil of Larix principis-rupprechtii plantation. Journal of Northeast Forestry University, 47(8): 1-7. (in Chinese)

[24]
Lu Y C, Zhang W H, Lu Y C. 2006. Effects of different management practices on population structure and dynamics of Quercus liaotungensis. Acta Botanica Boreali-Occidentalia Sinica, 26(7): 1407-1413. (in Chinese)

[25]
Olson M G, Meyer S R, Wagner R G, et al. 2014. Commercial thinning stimulates natural regeneration in spruce-fir stands. Canadian Journal of Forest Research, 44(3): 173-181.

[26]
Ou Y D, Su Z Y, Li Z K, et al. 2011. Effects of topographic factors on the distribution patterns of ground plants with different growth forms in montane forests in North Guangdong, China. Chinese Journal of Applied Ecology, 22(5): 1107-1113. (in Chinese)

[27]
Patil G P, Taillie C. 1982. Diversity as a concept and its measurement. Journal of American Statistical Association, 77(379): 548-561.

[28]
Piiroinen T, Valtonen A, Roiniene H. 2017. The seed-to-seedling transition is limited by ground vegetation and vertebrate herbivores in a selectively logged rainforest. Forest Ecology and Management, 384: 137-146.

[29]
Rocha G P E, Vieira D L M, Simon M F. 2016. Fast natural regeneration in abandoned pastures in southern Amazonia. Forest Ecology and Management, 370: 93-101.

[30]
Sweson N G, Aaglada-Cordero P, Barone J A. 2011. Deterministic tropical tree community turnover: Evidence from patterns of functional beta diversity along all elevational gradient. Biological Sciences, 278(1707): 877-884.

[31]
Tang S Z, Lang J K, Li H S. 2009. Forestry statistics. Beijing, China: Science Press: 447-457. (in Chinese)

[32]
Wang R H, Ge X M, Tang L H. 2014. A review of diversity, biomass and nutrient effect of understory vegetation. World Forestry Research, 27(1): 43-48. (in Chinese)

[33]
Wei A R, Zhang Y Q, Tan L Z, et al. 2019. Effects of tending felling on stand structure and species diversity of mixed coniferous and broadleaved forest, Journal of Beijing Forestry University, 41(5): 148-158. (in Chinese)

[34]
Wen P Y, Jin G Z. 2019. Effects of topography on species diversity in a typical mixed broadleaved-Korean pine forest. Acta Ecologica Sinica, 39(3): 945-956. (in Chinese)

[35]
Xiao Z L, Jing S H, Liang G Z, et al. 2019. Natural population distribution pattern of Pinus mossoniana in Dayan Nature Reserve of Yuan’an County. Journal of Hunan Ecological Science, 6(2): 20-26. (in Chinese)

[36]
Xu X W, Xu X H, Luo Z J, et al. 2021. Occurrence and control of pine wood nematode disease in Hubei. Hubei Forestry Science and Technology, 50(2): 54-59. (in Chinese)

[37]
Yan D F, Ma R T, Yang Q P, et al. 2019. Effect of thinning intensity on seedling regeneration characteristics in natural secondary oak forests. Journal of Henan Agricultural University, 53(2): 187-192. (in Chinese)

[38]
Yang X Y. 2005. Preliminary discussion on closing-to-nature treatment of China’s man-made forest. Central China Forest Inventory and Planning, 24(4): 7-9. (in Chinese)

[39]
Zhang X H, Zhang H R, Lu J, et al. 2020. Early effects of crop tree release tending on growth of natural secondary Quercus mongolica forest. Scientia Silvae Sinicae, 56(10): 83-92. (in Chinese)

[40]
Zhang X P, Wang D X, Zhang P, et al. 2017. Effects of thinning on the diversity of undergrowth of Pinus armandii plantation in Xiaolong Mountainous region. Journal of Northwest Forestry University, 32(2): 37-42. (in Chinese)

[41]
Zheng J K, Wei T X, Zheng L K, et al. 2009. Effects of landforms on α biodiversity in slope scale. Ecology and Environmental Sciences, 18(6): 2254-2259. (in Chinese)

Outlines

/