Land Resources and Land Use

The Evolution of Land Spatial Pattern in Chengdu during the Period of Rapid Urbanization from the Perspective of Land Function

  • HOU Langong , 1 ,
  • LIU Tao , 1, * ,
  • HE Xiaoqin 2
Expand
  • 1. School of civil engineering and architecture, Southwest University of science and technology, Mianyang, Sichuan 621010, China
  • 2. Huzhou Normal University, Huzhou, Zhejiang 313000, China;
*LIU Tao, E-mail:

HOU Langong, E-mail:

Received date: 2021-04-26

  Accepted date: 2022-02-10

  Online published: 2023-02-21

Supported by

The Key Projects of Zhejiang Province’s Philosophy and Social Science Planning Projects in 2019(19NDJC003Z)

The Soft Science Project of Zhejiang Science and Technology Department(2018C35063)

Abstract

Chengdu has experienced a rapid urbanization in the past two decades, and its land spatial pattern has undergone severe changes. It’s meaningful to investigate the tempo-spatial evolution of land spatial pattern and then contribute to high-quality development in Chengdu. Based on the Landsat-series satellite imagery and land use/cover datasets, this paper investigates Chengdu’s land function change concerning Production, Living and Ecological (PLE) land. The methods of land dynamics degree, landscape pattern index and Pearson correlation were be employed to analyzes the tempo-spatial evolution of landscape pattern in Chengdu, and some suggestions were finally made. We found that there were severe dynamic degree of PLE land in Chengdu and the production and ecological land were decrease obviously before 2015. Contrastingly, the dynamic degree is decrease after 2015, high dynamic degree regions are move to the northeast from 2000-2019. In addition, the change of production land is the main factor affecting the landscape pattern of Chengdu. In general, we put forward the macroscopic strategy and suggestions of “one core, two belts, four regions, and one direction” to support the high-quality development of Chengdu.

Cite this article

HOU Langong , LIU Tao , HE Xiaoqin . The Evolution of Land Spatial Pattern in Chengdu during the Period of Rapid Urbanization from the Perspective of Land Function[J]. Journal of Resources and Ecology, 2023 , 14(2) : 410 -422 . DOI: 10.5814/j.issn.1674-764x.2023.02.019
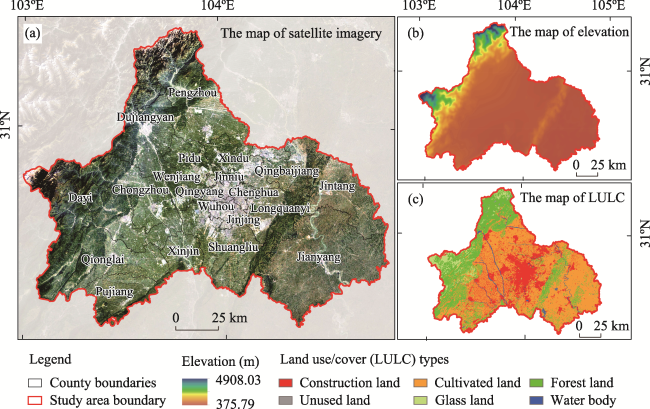
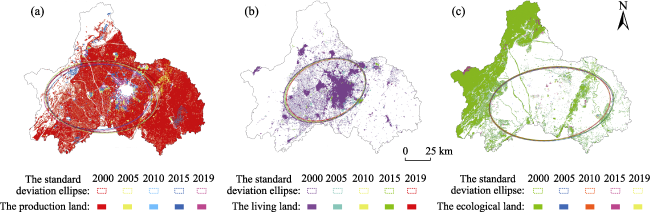
1 Introduction

After the reform and opening up, the process of industrialization and urbanization in China has been booming (Chen et al., 2022). Driven by human activities and climate changes, the scale of urban and rural construction land have been sprawling significantly (Li et al., 2018). The early land use development mode, which focused on economic development, lacked the horizon of sustainable development and ecological protection, is no more adequate for high quality development facing the management of land functions in coordination with man-land (Liu et al., 2023). With the decrease of agricultural and ecological land, the pollution and environmental degradation problem has become more obvious. Chinese governments highlighted that the establishment of the principal functional zoning of China's terrestrial resources, namely production, living and ecological land function space system (PLES), was the key to sustainable management of land functions in 2010 (Liu et al., 2021). In the framework of sustainable development of urban land pattern and PLES, the scholar being explored a new way of optimizing the land spatial pattern (Chen et al., 2019a) and attempt to establish a set of land spatial pattern development systems to give full play to the synergy and multiplier effect among production, living and ecological land. (Jiang et al., 2022).
The concept of land functional zoning originated from the European Union’s agricultural multi-functional classification system (Peter et al., 2013) which strikingly improves agricultural production efficiency, and increased focus on sustainability and environmental change (Kates et al., 2001). In the early stage, the main studies of land spatial function zoning was the perspective of socio-economic development. After the development of the Netherlands, Japan, Germany and other countries were considered to have reached a certain stage, the functional division of the land has begun to bear in consideration the coordination of conflicts (Priemus, 2004) and the British territorial space planning was committed to the realization of three dimensions of social, economic and environment sustainability (Wang et al., 2014). It is clear that different countries have widely distinguish land spatial policy (Lin et al., 2022) and intricate connections in the PLE system. However, the common feature is that the land structural transformate from the emphasis on socio-economic development to coordinated and sustainable territorial space and PLES (Fu et al., 2022).
In the 1990s, based on the perspective of man-land relationship, some scholars divided the land function into production-living-ecological system (PLES) land (Sun et al., 2017) which was more comprehensive, subjective and coordinated (Wang et al., 2011). In the early stage, there were relatively few studies on PLES. In the 18th National Congress of China’s Communist Party clearly put forward the total requirements of PLES land development, which is “intensive and efficient production land, moderate living land, beautiful ecological land” (Sun et al., 2018). In 2013, the Third Plenary Session of the 18th CPC Central Committee proposed the division of PLES land regulatory boundary (Liu et al., 2016) marking the coordinated transformation of PLES land in China. Therefore, the study of the PLES land is increasing rapidly, and the research content mainly includes the theoretical framework of PLES land (Lin et al., 2022), the spatial classification system of PLES land, the tempo-spatial evolution of PLES land (Qin et al., 2019), Influence factors (Sun et al., 2017), reconstruction and optimization of PLES land, complete carrying capacity of PLES land (Zhang et al., 2016), spatial coordination of PLES land and other. The studies areas are mainly concentrated in administrative regions (Peng et al., 2015), watersheds (Hou et al., 2021), urban agglomerations and minority areas. However, from the perspective of land function, there is a lack of research on the evolution of urban land use in southwest China under the background of rapid urbanization.
The tempo-spatial changes of land function, mainly reflect by human activities and urban sprawl, receiving a widespread attention. For instance, Yu et al. (2020a) analyzed the spatial coordination and conflict of PLES land in beijing-tianjin-hebei region by identifying the differentiation of the spatial function types; Li et al. (2020) studied the change of rural PLES land from the perspective of village scale. It can be seen that the research on PLES land was more concentrated in urban agglomerations, provinces and cities. However, the research on PLES land change mainly focuses on the identification of quantitative structure change and spatial distribution. At present, there is a lack of research on the relationship between land spatial change and landscape pattern.
Chengdu is one of the fastest growing cities in Western China (Yu et al., 2020b). Rapid urban construction and rapid economic development have led to rapid PLES land changes in Chengdu. Affected by many factors, such as distribution of geographical environment and natural resources, the tempo-spatial change of PLES land is significantly obvious. Based on this, this study will establish the relationship between land use and PLES land function, and the following issues will be clearer: 1) the tempo-spatial pattern of PLES land change in Chengdu; 2) evolutionary features of PLES land landscape pattern index during two decades; 3) the correlation between land use/cover change and landscape pattern. It is suggested to optimize the urban PLES land pattern of Chengdu City, and provide scientific basis for the construction of ecological and park city, and accelerate the formation of a coordinated development model of high-quality PLES land.

2 Materials and methods

2.1 Study area

Chengdu (30°05°-31°26°N and 102°54°-104°53°E), the capital city of Sichuan province, is one of the core city of the Chengdu-Chongqing urban agglomeration (Fig. 1a). There are 20 counties with a total area of 14335 km2. It is located in southwest China, the west of Sichuan basin, and the core area of Chengdu plain (Fig. 1b). Topography, the terrain is flat, and including many rivers, rich products, and developed agriculture (Fig. 1c). It belongs to a subtropical monsoon humid climate, with an average temperature of 16 ℃ and precipitation of about 1000 mm.
Fig. 1 Location map of the study area

Note: (a) is the satellite remote sensing image of the study area in 2019, (b) is the elevation map, and (c) is the 2019 land use/cover map.

From 2000 to 2019, the proportion of primary, secondary and tertiary industries of Chengdu will change from 10:43:47 to 3:42:55, the overall population of Chengdu will increase from 10.1335 million to 14.7605 million, and the urbanization rate of Chengdu increase from 34.1% to 72.1%, 2000-2010 has the largest increase of 26.8%; the GDP per capita increase from 12631 yuan to 103944 yuan, with the largest increase from 2010 to 2015 of 48444 yuan. After 2015, Chengdu has entered the “low speed” stage of urban development (Peng et al., 2015). How to adjust the PLES land pattern is of positive significance to promote the construction of ecological city, park city and high-quality development.

2.2 Data sources

The multi-band image data of Chengdu are comes from the geospatial data cloud platform (http://www.gscloud.cn/), including Landsat 4-5 TM in 2000, 2005 and 2010 and Landsat 8 OLI-TIRS 2015 and 2019, with 129-130 strip number and 38-39 rows, less than 8% cloud cover and resolution of 30×30 m. ENVI 5.3 instrument for radiometric calibration, atmospheric correction and clipping, then adoption maximum likelihood method to monitor and classify false color (band 3, 4, 5) images (Fig. 2). Kappa coefficients of Chengdu city in 2000, 2005, 2010, 2015 and 2019 are 0.9741, 0.9364, 0.9426, 0.9769 respectively. The accuracy resolution images of Google Earth are used to verify the correctness of the classification results. Accuracy rates are 92.3%, 91.6%, 89.1%, 90.5% and 91.1% respectively, which indicate that the classification results can provide basic data for this study.
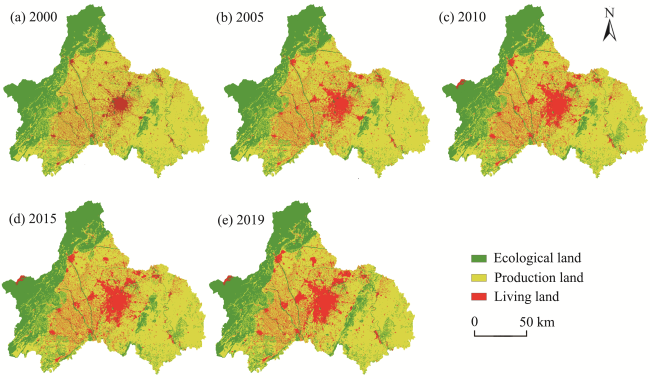
Fig. 2 Production-living-ecological spatial classification map
In addition, all raster datasets in this paper were adopted the WGS_1984_UTM_Zone_ 43N coordinate system. The land area and the landscape index is obtained through the build raster attribute table step in ArcMap 10.2 and the GeoTIFF grid is used to import the FRAGSTATS 4.2.1 tool. Direction distribution and average center of geographical distribution are measured by using spatial statistical tools and the standard deviation ellipse and gravity center offset in ArcMap 10.2 are obtained. The correlation between PLES land and landscape pattern index was analyzed by SPSS 2.0.

2.3 Methods

2.3.1 The classification and connection of PLE land

Land is the carrier of natural resources and human activities. It is the most basic form of land on the earth (Chen et al., 2019b). The mainland types have been typically divided into six categories: grassland, forestland, construction land, water area, cultivated land and unused land. There is, however, a lack of unified discussion on the land function. Land function can clearly reflect the change of human activities on land. The change of land function is directly related to human survival and development. Therefore, analyzing the change of land function is of great significance to realize sustainable development. From the perspective of man-land relationship, some scholars divide land into production land, living land and ecological land function (PLE). The construction of the PLE land function classification system is a premise of PLE land optimization. Referring to the relevant studies (Lin et al., 2022) the land use classification is linked to PLE land as follows (Table 1).
Table 1 The link table between PLE land and land use
Land type First land use
classification
Secondary land use
classification
Production land Urban and rural, industrial and mining, residential land Other construction land
Arable land Paddy field, dry land
Woodland Other woodland
Living land Urban and rural, industrial and mining, residential land Rural settlement
Urban and rural, industrial and mining, residential land Urban land
Ecological land Woodland There are woodland, shrubland, sparse woodland
Grassland I Medium coverage grassland, low coverage grassland
Waters I Permanent glaciers, snowfields, beaches, beaches
Unused land Sandy land, Gobi, saline-alkali land, marshland, bare land, bare rock texture, etc.
Grassland II High coverage grassland
Waters II Canals, lakes, reservoirs and ponds

Note: For detailed classification information, refer to the Chinese academy of sciences land use coverage classification system. (www.resdc.cn)

2.3.2 Land function transfer matrix

The land function transfer matrix can directly reflect the flow of various land. Through the analysis of land use function flows, which reflects the response to human activities. Understanding the functional flow of Chengdu under the background of rapid urbanization in the past 20 years is of great significance for optimizing the national taste pattern and realizing sustainable development. Using the land use transfer matrix, this study analyzes the internal process and trend of PLE land function change. The formula is as follows:
${{T}_{ij}}=\left[ \begin{matrix} {{S}_{11}} & {{S}_{12}} & \ldots & {{S}_{1j}} \\ {{S}_{21}} & {{S}_{22}} & \ldots & {{S}_{2j}} \\ \vdots & \vdots & \vdots & \vdots \\ {{S}_{i1}} & {{S}_{i2}} & \cdots & {{S}_{ij}} \\ \end{matrix} \right]$
where: Tij is the area of the initial i PLE land transformed into the j PLE land at the end; i and j represent the PLE land at the beginning and end of the study, respectively. In the transition matrix, the row represents the i PLE land at the initial stage and the column represents the j PLE land at the end.

2.3.3 The dynamics degree of PLE land

Based on the analysis of the functional flow characteristics of the land use in Chengdu, the flow intensity of each element is further analyzed. The greater the intensity, the greater the pressure on the functional changes of land use caused by human activities. Moreover, by analyzing the characteristics of land use changes in the past two decades, it can be seen from the regular characteristics of the tempo-spatial flow patterns, and it also reflects the large spatial distribution characteristics of the selection intensity of human activities in the context of rapid urbanization, which is of great significance to the realization of regional sustainable development. The specific formula is as follows:
$LC=\frac{\sum\limits_{i=1}^{n}{\Delta L{{U}_{i-j}}}}{2\sum\limits_{i=1}^{n}{L{{U}_{i}}}}\times \frac{1}{T}\times 100%$
where: LC is the dynamic degree of comprehensive PLE land; T is the span of time; LUi is the area of the initial land; △LUi-j is the absolute value of the converted area of PLE land.

2.3.4 PLE land spatial pattern evolution method

Geo-informatics graphic methodology can directly express the spatial differentiation of the PLE land. By superimposes two adjacent periods of PLE land, the four-phase PLE land geo-informatics graphic has obtained. It has positive significance to reveal the tempo-spatial characteristics of PLE land change.
Due to the point pattern analysis methods such as standard deviation ellipse and center of gravity shift model, various land patterns of spatial distribution can be well identified. Therefore, in recent years, it has been widely used in the study of various types of land expansion. The method of standard deviation ellipse is to establish new ellipse features on the basis of existing elements and then analyze the change features of ellipse features according to the major axis, minor axis and area features.

2.3.5 Selection of landscape pattern index

Landscape pattern index is a mathematical model, which expresses the composition and spatial heterogeneity of landscape structure. Six landscape levels were chosen to reflect the basic characteristics of land landscape pattern in the study area, and then the heterogeneity of land landscape in the study area was investigated (Table 2). The moving window method was used to reflect the spatial heterogeneity of land landscape pattern in the study area. The landscape pattern index are as follows:
Table 2 Landscape pattern index formula and its ecological significance
Landscape
pattern index
Formula Explanation Ecological significance
PD (Patch density) $PD=\frac{N}{A}$ N is the number of landscape plate ; A is the total landscape area It is an important indicator to describe the fragmentation of the landscape. The larger PD, the higher the degree of fragmentation
CONTAG (contagion index) $CONTAG=\left[ 1+\frac{\sum\limits_{i=1}^{m}{\sum\limits_{k=1}^{m}{\left[ {{P}_{i}}\times \left( \frac{{{g}_{ik}}}{\sum\limits_{k=1}^{m}{{{g}_{ik}}}} \right) \right]\left[ \ln {{p}_{i}}\times \left( \frac{{{g}_{ik}}}{\sum\limits_{k=1}^{m}{{{g}_{ik}}}} \right) \right]}}}{2\ln m} \right]\times 100$ Pi is the percentage of the area occupied by i lands; gik is the number of adjacent patches of i land and k land; m is the total number of patch in the landscape It can describe the degree of reunion or spreading trend of the landscape pattern. The larger CONTAG indicating that there have well connections in dominant landscape patch
LSI (Landscape shape index) $LSI=\frac{0.25E}{\sqrt{A}}$ E is the total length of boundaries in landscape, A is the total area of the landscape The index that reflects the shape of the landscape. The smaller LSI indicates that the plate shape tends to be regular
AI (Aggregation index) $AI=\frac{{{\text{g}}_{ii}}}{\max {{g}_{ii}}}\times 100$ gii is the number of similar adjacent patches The higher AI indicates that the better the agglomeration between the plates
SHDI (Shannon Diversity Index) $SHDI=-\sum\limits_{i=1}^{m}{({{P}_{i}}\ln ({{P}_{i}}))}$ Pi is the proportion of landscape patch type i area The higher SHDI and the higher the degree of fragmentation and the heterogeneity of the landscape
SHEI (Shannons Evenness Index) $SHEI=\frac{-\sum\limits_{i=1}^{m}{({{P}_{i}}\ln ({{P}_{i}}))}}{\ln m}$ Pi is the proportion of landscape patch type i area; m is the number of landscape types The higher SHEI indicating that each land type is equally distributed in the landscape and there is no obvious dominant landscape type

2.3.6 Pearson correlation

The Pearson correlation coefficient can clearly show the correlation between two variables (Liu et al., 2023), and the correlation coefficient ranges from -1 to 1. Pearson’s linear model can clearly reflect the relevance of human activities to the landscape characteristics and environment of Chengdu, which also indicates the driving effect of human activities on the landscape pattern and ecological environment quality under rapid urbanization, and explains its image factors in a more in-depth manner. So as to provide reference and reference for optimizing the quality of ecological environment and realizing sustainable development. The formula is as follows:
$r=\frac{\sum\limits_{i=1}^{n}{\left( {{X}_{i}}-\overline{X} \right)\left( {{Y}_{i}}-\overline{Y} \right)}}{\sqrt{\sum\limits_{i=1}^{n}{{{\left( {{X}_{i}}-\overline{X} \right)}^{2}}}}\sqrt{\sum\limits_{i=1}^{n}{{{\left( {{Y}_{i}}-\overline{Y} \right)}^{2}}}}}$
where: r represents the correlation coefficient of the two variables; X and Y represent the mean value of X and Y respectively. The greater the absolute value of the correlation coefficient, the stronger the correlation: the closer the correlation coefficient is to 1 or -1, the stronger the correlation, and the closer the correlation coefficient is to 0, the weaker the correlation. The correlation coefficient can be divided into five levels: 0.8-1.0 very strong correlation, 0.6-0.8 strong correlation, 0.4-0.6 moderate correlation, 0.2-0.4 weak correlation, 0-0.2 very weak correlation or no correlation.

3 Results

3.1 The change of PLE land function quantity

3.1.1 PLE land area change

The area of production land in the study area gradually decreased from 2000 to 2019 (Table 3), from 926256.0 ha to 844280.8 ha, while the area of living land increased gradually, from 107934.2 ha to 184024.7 ha and accounting for 7.53% to 12.84% from 2000-2019. In 2015, the ecological land area decreased first and then increased, with the minimum area of 394551.8 ha.
Table 3 The change of PLE land area and proportion from 2000-2019
Land type 2000 2005 2010 2015 2019
Area (ha) Proportion (%) Area (ha) Proportion (%) Area (ha) Proportion (%) Area (ha) Proportion (%) Area (ha) Proportion (%)
Production land 926256 64.62 900245.3 62.80 868985 60.62 867169.8 60.50 844280.8 59.90
Living land 107934.2 7.53 137330.4 9.58 169009.1 11.79 171700.6 11.98 184024.7 12.84
Ecology land 399198.9 27.85 395935.9 27.62 395501.4 27.59 394551.8 27.53 395117.4 27.56

3.1.2 The transfer of PLE land function

The transfer of production land to living land is the most obvious in 2000-2019, and frequently occurring in 2000-2010 (Table 4), indicating that the trend of urban land expansion and agricultural land reduction has been alleviated. From 2000 to 2010, about 18126.05 ha of ecological land was converted to production land and from 2010 to 2019 (Table 5), about 13825.47 ha of the ecological land was converted to production land. The transfer area of ecological land in 2010-2019 is significantly larger than that in 2000-2010, conveying the message that people have made positive contribution to the ecological construction of Chengdu.
Table 4 Land transfer in PLE land from 2000 to 2010 (Unit: ha)
Year Land type 2010
Production land Living land Ecological land
2000 Production land - 57933.63 14663.58
Living land 14185.53 - 1274.13
Ecological land 18126.05 4203.09 -
Table 5 Land transfer in PLE land from 2010 to 2019 (Unit: ha)
Year Land type 2019
Production land Living land Ecological land
2010 Production land - 36556.37 19034.71
Living land 12061.42 - 8195.1
Ecological land 13825.47 1532.30 -

3.1.3 Dynamic degree of PLE land

The dynamics degree of land function can reflect the response to human activities. In the past two decades, Chengdu has shown a trend of a changing from high dynamics degree to low dynamics degree. The highest land dynamic degree is 3.364 from 2005 to 2010 and the lowest is 0.9432 from 2010 to 2015 (Fig. 3c). It is found that the dynamic degree gap between counties in Chengdu tends to narrow, which is mainly reflected in the rapid decline of the dynamic degree in the central city, while the dynamic degree in other counties has increased significantly.
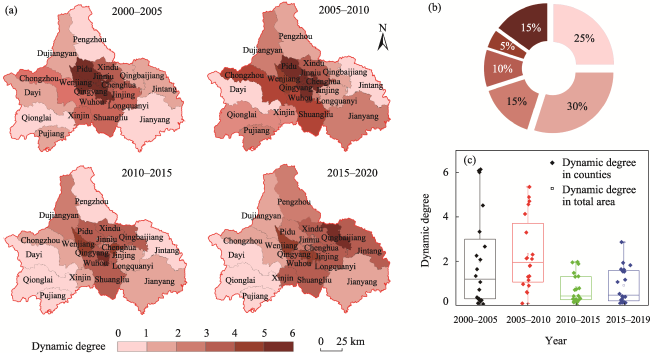
Fig. 3 The dynamic degree of PLE land in study area (a) is the spatial feature of difference county from 200 to 2019, (b) is the share of dynamic degree, and (c) is the dispersion of dynamic degree from 2000 to 2019
From county-size, the dynamic degree of each county from 2000 to 2005, and that of central cities was relatively high level (Fig. 3a), such as Jinjiang (6.128), Wuhou (6.064) and Jinniu District. However, the dynamic degree of many counties was low after 2010. Overall, from 2000 to 2019, the land dynamic degree of Chengdu showed a downward trend,the land dynamics degree of central cities decreased significantly, and the gap with other counties is gradually narrowing. From the spatial change from 2000 to 2019, the high dynamic degree area is moving to the northeast, and it shows that the main direction of the economic development of Chengdu.

3.2 The tempo-spatial evolution of PLE land function

3.2.1 The tempo-spatial evolution of the PLE land using geo-informatics graphic methodology

PLE land transfers is mainly concentrated in the middle of the study area from living land to ecological land. The results show that urban expansion is the main factor affecting PLE land change from 2000 to 2005 (Fig. 4a). From 2005 to 2010 (Fig. 4b), the creation of ecological land is mainly distributed in Dujiangyan, Pengzhou and Jianyang, and from 2010 to 2015 (Fig. 4c), production land for conversion to living was only distributed in urban-rural transitional areas. From 2015 to 2019 (Fig. 4d), the transfer of production land to ecological land is mainly distributed in the east of Chengdu, such as Jintang, Qingbaijiang and Longquanyi etc.
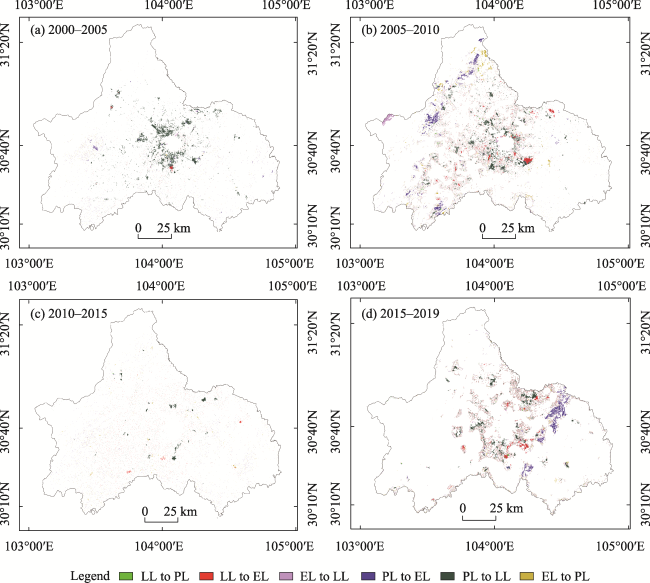
Fig. 4 The change and distribution characteristics of the PLE land

Note: (a) is the spatial change of PLE land from 2000 to 2005, (b) is the spatial change of PLE land from 2005 to 2010, (c) is the spatial change of PLE land from 2010 to 2015, (d) is the spatial change of PLE land from 2015 to 2019; LL, PL, and EL are the abbreviation of living land, production land and ecological land, respectively.

3.2.2 Identification and analysis of PLE land spatial changes

Through the tempo-spatial evolution of PLE land from 2000 to 2019 (Fig. 5), it can be seen that the long axis of the standard deviation ellipse of production land is east-west indicating that the spatial pattern of production land is mainly distribution east-west. The increase of standard deviation ellipse area and the decrease of oblateness indicate that the expansion trend of production land is mainly east-west and the eastern areas such as Qingbaijiang and Longquanyi are the main development direction of production land in the future.
Fig. 5 Spatial change of PLE land in 2000-2019 based on the standard deviation ellipse

Note: (a) is the standard deviation ellipse of production land, (b) is the standard deviation ellipse of living land, and (c) is the standard deviation ellipse of ecological land.

The area of the standard deviation ellipse of living land in Chengdu increases rapidly, which indicates that the spatial pattern of living land is expanding. The direction of th long axis is northeast-southwest and the angle increases gradually. It can be seen that the spatial pattern of living land increasing from northeast to southwest and the center
of living land is moving to the southwest with a total distance of 1.3744 km indicating that the southwest of Chengdu is the main direction of future living land expansion.
The main axis of the standard deviation ellipse of ecological land is east-west distribution (Table 6), the area is increasing gradually and the oblateness is gradually decreasing which indicates that the spatial pattern of ecological land is mainly distributed in the west of Dujiangyan and the east of Pengzhou. From 2000 to 2019, the gravity center of ecological land will move from east to west.
Table 6 Land standard deviation ellipse and center of gravity center migration data of Chengdu City from 2000 to 2019
Land type years Latitude and longitude Center of gravity shift (km) Corner θ (°) Long axis (km) Short axis (km) Flatness Ellipse area (km2)
Production land 2000 103°45′29″E, 30°36′22″N - 88.0206 52.2396 33.4193 0.63973 5484.26
2005 103°47'22″E, 30°36′48″N 2.9882 86.7115 52.8356 33.2584 0.63232 5552.81
2010 103°48′21″E, 30°36′17″N 1.5724 92.4864 55.5092 35.5251 0.62999 6194.71
2015 103°48′21″E, 30°36′95″N 0.7160 92.8809 55.9779 35.5809 0.62562 6256.84
2019 103°49′47″E, 30°36′21″N 2.3126 90.4683 57.0451 35.0956 0.61523 6289.13
Living land 2000 103°53′27″E, 30°39′44″N - 66.1751 40.9311 28.3425 0.69244 3644.30
2005 103°53′19″E, 30°38′55″N 0.7321 66.0304 51.4965 28.9465 0.69311 3773.48
2010 103°52′57″E, 30°38′52″N 0.1487 66.1583 42.4613 29.4028 0.69346 3921.99
2015 103°52′44″E, 30°38′34″N 0.3405 66.2928 42.5501 29.4263 0.69357 3946.69
2019 103°52′43″E, 30°38′50″N 0.1531 66.4900 42.7278 29.6295 0.69445 3977.02
Ecological land 2000 104°02′11″E, 30°31′49″N - 82.6157 60.2594 36.2860 0.60216 6868.83
2005 104°02′15″E, 30°31′47″N 0.1231 83.0477 60.3138 36.1136 0.59876 6842.35
2010 104°03′14″E, 30°31′33″N 0.6126 84.6219 61.4286 35.8244 0.58319 6912.96
2015 104°03′15″E, 30°31′27″N 0.1625 84.0783 61.5166 36.0460 0.58596 6965.74
2019 104°03′22″E, 30°31′52″N 0.7854 84.0349 62.0983 36.1845 0.5827 7058.61

3.3 The analysis of the landscape characteristics of land spatial pattern

3.3.1 Evolution of PLE land landscape pattern

The results showed that the fragmentation degree of patches in Chengdu showed an up ward trend and the connectivity between patches showed a downward trend (Table 7). With the decrease of the number of CONTAG, the LSI shows a downward trend and AI shows an upward trend. The shape of landscape patches tends to be regular and the clustering
degree between patches is improved. From 2000 to 2019, both SHDI and SHEI increased. The results shows that the landscape patches of PLE land pattern had diversity characteristics and the uniformity of landscape patch distribution was improved.
Table 7 Change characteristics of land space landscape pattern index in Chengdu from 2000 to 2019
Index 2000 2005 2010 2015 2019
PD 1.04565 1.088485 1.092145 1.17731 1.24853
CONTAG 50.03856 50.90553 50.731695 49.42980 49.54820
LSI 17.10176 16.825455 17.089595 17.67184 17.79669
AI 88.481425 88.52090 88.298525 87.17684 86.61744
SHDI 0.713695 0.722905 0.717375 0.71817 0.73410
It can be seen that under the influence of human activities, the fragmentation and heterogeneity of PLE land landscape pattern have been improved. The aggregation and connectivity between PLE land landscape patches is decreased. Landscape diversity increased and the PLE land patches were evenly distributed.

3.3.2 The tempo-spatial evolution of the PLE land landscape pattern

PD high value areas are mainly distributed in the midwest of the study area (Fig. 6), mainly in Xinjin, Dayi, Qionglai and the east of Chongzhou. This area is dominated by hilly landforms and the unique landform leads to the fragmentation of land landscape pattern in Chengdu. The expansion of living land in the midest of Chengdu has led to the reduction of PD around the built-up area. However, the production land of small towns is obviously fragmented, and the low value area are mainly distributed in the east and west of Chengdu, such as Wenjiang and Xinjin. The eastern region is dominated by production land with good integrity, and the western region is dominated by large-area ecological land. The dominant patch types in the two regions are different and the patches have good connectivity.
LSI high value regions is also distributed in Xinjin, Chongzhou, Dayi and the eastern city of Qionglai (Fig. 6). From 2000 to 2019, the LSI index of Chengdu decreased in the north and the high AI areas are mainly distributed in the east, West and middle of the study area of Chengdu City. The high value AI area in the central urban area of the study area is expanding which indicates that the area is highly clustered. The SHDI and SHEI index have a similar spatial distribution characteristics, mainly in the east part of Chongzhou and Dayi, due to the growth of the urban area in Chengdu, the landscape diversity in urban area has increased, indicating the production land of the integrity and evenness of production land were damaged.
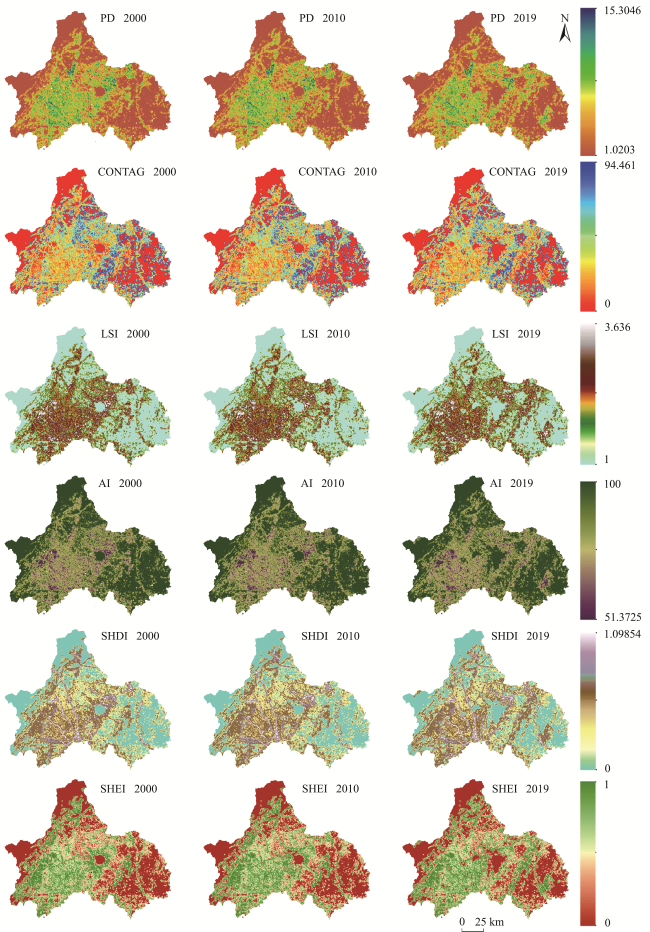
Fig. 6 Spatial change characteristics of land space landscape pattern index in Chengdu from 2000 to 2019

4 Discussion

4.1 Correlation between PLE land function change and landscape index

The correlation index between land change and landscape is discussed through Pearson correlation (Table 7). The correlation between the production land and the landscape indexes are relatively strong, and the correlation between the ecological land and the landscape indexes is relatively weak, indicating that the main factors affecting the change of ecological land is the changes of production land and living land, while the change of ecological land has a little impact.
Production land was negatively correlated with PD, AI, SHDI and SHEI, and positively correlated with CONTAG and LSI (Table 7). The results showed that with the increase of production land area, the accessibility of land landscape pattern decreased, the distribution of Landscape morphology tended to be regular and the landscape fragmentation and diversity of landscape increased.
The change of living land was negatively correlated with CONTAG and LSI and positively correlated with PD, AI, SHDI and SHEI. The increase of living land is the main cause of landscape fragmentation in the study area (Table 7). With the increase of living land, the density and diversity of patches increased and the connectivity between landscape patches decreased. The results showed that the expansion of living land has an excellent relationship with change of landscape and diversity. The correlation between living land and SHEI and SHDI was the highest. The results show that the expansion of living land has the greatest relationship with the change of landscape diversity and evenness. There was a negative correlation between ecological land and SHEI and SHDI, and the correlation degree was relatively moderate. The change of ecological land has little effect on the landscape pattern of the study area.

4.2 Optimization suggestion

According the contents of this study, we will construct Chengdu as the main development ecology pattern of "one core, two belts, four districts, and one direction" for development (Fig. 7). The details as follows:
The one core mainly refers to the urban dynamic degree control area that situated on the centered of the built-up area in Chengdu, which is a very high dynamic degree of development of the area (Fig. 7), it leads to the deterioration of the ecological environment. Reasonably control of the urban dynamic degree of the core area, realize the intensive and economical development of land, and realize the concept of harmony between man-land.
The two treatments mainly refer to the fragmented landscape protection belt and the landscape ecological corridor (Fig. 7). The delineation of the landscape fragmentation protection belt is intended to control the impact of the expansion of the scope of human activities on the ecological function land in the western part of the study area. The landscape ecological corridor is the result of the combined effect of typical topography and human activities. Restoring landscape features and constructing an ecological barrier in the eastern part of the study area are effective measures to achieve high-quality ecological development in the study area.
Based on the topographical features and the impact of human activities on the landscape ecology, this paper delineates four areas (Fig. 7). In the agricultural landscape restoration area, affected by human activities, the landscape of the agricultural production function area is significantly fragmented, the output is reduced, and the biodiversity is reduced. Therefore, the agricultural landscape restoration by means of “merger of cultivated land and merger of fields” is stable to the ecosystem It has a positive meaning. The hilly landscape restoration area is aimed at a series of ecological problems caused by the characteristics of the region and human activities, and prevents ecological problems such as soil erosion by restoring the characteristics of the concentration of the landscape in the region. The urban and rural landscape restoration area is a typical area where a large number of human activities damage the landscape. The landscape characteristics of this area are restored to provide a buffer area for ecological environment protection. The landscape ecological protection area is mainly located in the western part of the study area. It is the area with the least interference from human activities and the most complete ecological preservation. It has a high degree of connectivity and aggregation. Protecting this area is the key to ecologically achieving sustainable development in Chengdu.
Table 7 Study on the correlation between PLE land change and landscape index
Land type Correlation
PD CONTAG LSI AI SHDI SHEI
Production land -0.891*** 0.945*** 0.958*** -0.758*** -0.938*** -0.933***
Living land 0.598* -0.896** -0.732** 0.663** 0.969*** 0.968***
Ecology land -0.286* 0.325* -0.205* 0.468** -0.499** -0.402**

Note: ***Established in the confidence interval of 99%; **Established in the confidence interval of 95%; *Established in the confidence interval of 90%.

One direction is mainly reflected in the future development direction of the city (Fig. 7). From the perspective of the migration of the center of life land, the future development direction of Chengdu is northeast. Affected by the Chengdu-Chongqing double-city economic circle, the attraction between the two cities has caused its industries to gather in the northeast. From the perspective of topography, the topography of the northeastern part of the study area is relatively flat, which is suitable for human survival and social development, which indicates that for a long period of time in the future, the ecological and environmental issues in this direction should be paid special attention.
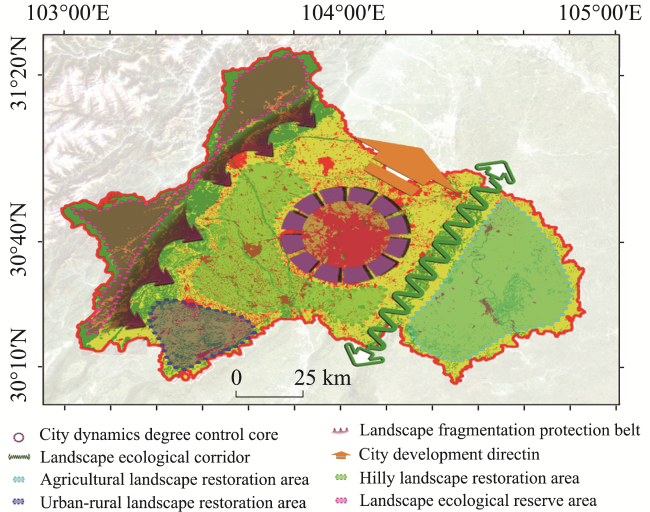
Fig. 7 Optimization land pattern space diagram in study area

Note: The optimization strategy of the study area was suggested by “one core, two belts, four regions, and one direction”.

5 Conclusions

(1) From 2000 to 2019, the area of production land decreased from 926 256.0 ha to 844 280.8 ha, and the area of living land increased from 107 934.2 ha to 184 024.7 ha. The area of ecological land was decreased first and then increased. The area of production land converted to living land is the largest. The highest dynamic degree of PLE land in the study area was 3.364 in 2005-2010 and the lowest dynamic degree was 0.9432 in 2010-2015. From the perspective of spatial distribution, the areas with high dynamic value of land use in the study area tend to move from the middle to the northeast.
(2) From 2000 to 2005, most of the PLE land transfer in Chengdu was mainly concentrated in the middle of the study area, mainly from living land to ecological land. From 2005 to 2010, mainly from ecological land to living land. From 2015 to 2019, most of the production land was transferred to the ecological land and mostly of in the east of the study area.
(3) The main axis of the standard deviation ellipse of the production land in study area is east-west, the area of the standard deviation ellipse increases and the oblateness decreases; the area of the standard deviation ellipse of the living land increases rapidly, the direction of the long axis is northeast southwest and the rotation angle increases gradually. The results showed that the center of gravity shifted to the southwest and the total distance was 1.3744 km; the long axis of the ecological spatial standard deviation ellipse was east-west distribution.
(4) From 2000 to 2019, the fragmentation of the landscape in the study area is increased and the overall increase of PD and CONTAG; LSI showed a downward trend AI and showed an upward trend which indicating that the landscape plate shape of PLE land tended to be regular; the integrity of production land and ecological land was destroyed, resulting in the fragmentation of landscape pattern in the study area.
(5) From 2000 to 2019, the correlation between production land and each landscape index is extremely strong and the overall correlation between ecological land and each landscape index is weakly correlated; production land is negatively correlated with the four landscape indices of PD, AI, SHDI, and SHEI and positively correlated with CONTAG and LSI; Living land is negatively correlated with CONTAG and LSI but positively correlated with PD, AI, SHDI, and SHEI; Ecological land is negatively correlated with SHEI and SHDI, and the degree of correlation is medium. Finally, we puts forward the overall strategy and suggestions of “one core, two belts, four regions, and one direction” for the development of Chengdu.
[1]
Chen F H, Fu B G, Xia J, et al. 2019a. Major advances in studies of the physical geography and living environment of China during the past 70 years and future prospects. Science China ( Earth Sciences), 62(11): 1665-1701.

[2]
Chen M X, Liang L W, Wang Z B, et al. 2019b. Geographical thinking on the relationship between beautiful China and land spatial planning. Acta Geographica Sinica, 74(12): 2467-2481. (in Chinese)

[3]
Chen X, Yu L, Du Z, et al. 2022. Toward sustainable land use in China: A perspective on China’s national land surveys. Land Use Policy, 123, 106428. DOI: 10.1016/j.landusepol.2022.106428.

[4]
Fu J, Bu Z, Jiang D, et al. 2022. Sustainable land use diagnosis based on the perspective of production-living-ecological spaces in China. Land Use Policy. 122:106386. DOI: 10.1016/j.landusepol.2022.106386.

[5]
Hou Q, Du Y, Dong W, et al. 2021. Smart city oriented ecological corridor layout of Sanshui River Basin in arid area of Loess Plateau. Sustainable Energy Technologies and Assessments. 44: 100993. DOI: 10.1016/j.set a.2021.100993.

[6]
Jiang X, Zhai S, Liu H, et al, 2022. Multi-scenario simulation of production-living-ecological space and ecological effects based on shared socioeconomic pathways in Zhengzhou, China. Ecological Indicators, 137, 108750. DOI: 10.1016/j.ecolind.2022.108750.

[7]
Kates R W, Clark W C, Corell R, et al. 2001. Environment and development-Sustainability science. Science, 292: 641-642.

[8]
Li X, Fang B, Yin R M, et al. 2020. Spatial pattern and association of Production-Living-Ecological function and life quality on the village scale: A case of Yangzhong City, Jiangsu Province. Scientia Geographica Sinica, 40(4): 599-607. (in Chinese)

[9]
Li X Y, Yang Y, Liu Y. 2018. The evolution process and its mechanism of man-land relationship in China. Geographical Research, 37(8): 1495-1514. (in Chinese)

[10]
Lin G, Jiang D, Fu J, et al. 2022. A review on the overall optimization of production-living-ecological space: Theoretical basis and conceptual framework. Land, 11(3): 345. DOI: 10.3390/land11030345.

[11]
Liu T, Hou L G. 2021. Evolution and Driving Forces of Spatial Pattern of Chengdu Plain from 2000 to 2018: Based on Multifunctional Perspective of “Production-Living-Ecological” Space. Southwest China Journal of Agricultural Sciences, 34(9): 2004-2013. (in Chinese)

[12]
Liu T, Yu L, Chen X, et al. 2023. Environmental laws and ecological restoration projects enhancing ecosystem services in China: A meta-analysis. Journal of Environmental Management, 327, 116810. DOI: 10.1016/j.j envman.2022.116810.

[13]
Liu Y S, Long H L, Chen Y F, et al. 2016. Research progress and prospects of China’s urban-rural transformation and rural development in the past decade. Journal of Geographical Sciences, 26(8): 1117-1132.

[14]
Peng W, Wang G, Zhou J, et al. 2015. Studies on the temporal and spatial variations of urban expansion in Chengdu, western China, from 1978 to 2010. Sustainable Cities and Society. 17: 141-150.

[15]
Peter S A, Henrik V, Tommy D, et al. 2013. An indicator-based method for quantifying farm multifunctionality. Ecological Indicators, 25: 166-179.

[16]
Priemus H. 2004. From a layers approach towards a network approach: A Dutch contributions to spatial. Planning, Practice & Research, 19(3): 267-283.

[17]
Qin L, Wen P Y, Ming G M, et al. 2019. Analysis of the spatial and temporal evolution of land cover and heat island effects in six districts of Chongqing’s main city. Sensors, 19(23): 5239. DOI: 10.3390/s19235239.

[18]
Sun P L, Xu Y Q, Liu Q G, et al. 2017. Spatiotemporal differentiation and driving factors of multi-functionality of land use in county scale in poverty belt around Beijing and Tianjin. Transactions of the Chinese Society of Agricultural Engineering, 33(15): 283-292. (in Chinese)

[19]
Sun T, Feng Z M, Yang Y Z, et al. 2018. Research on land resource carrying capacity: Progress and prospects. Journal of Resources and Ecology, 9(4): 331-340.

[20]
Wang P, Yang R Z, Liu W, et al. 2011. Reservoir characteristics and favorable area prediction of Devonian Kizirtag Formation in Bashituo Area, Tarim Basin. Energy Exploration & Exploitation, 29(5): 575-596.

[21]
Wang Q N, M’Ikiugu M, Kinoshita I. 2014. A GIS-based approach in support of spatial planning for renewable energy: A case study of Fukushima, Japan. Sustainability, 6(4): 2087-2117.

[22]
Yu Q N, Peng Y, Liu Z, et al. 2020a. Survey of ecotourism landscape resources and shrub landscape resources in western Sichuan mountains. Journal of Landscape Research, 12(5): 26-33.

[23]
Yu Z, Xu E, Zhang H, et al. 2020b. Spatio-temporal coordination and conflict of production-living-ecology land functions in the beijing-tianjin-hebei region, china. Land. 9(5): 170. DOI: 10.3390/land9050170.

[24]
Zhang H, Sun X, Zhang Y, et al. 2016. Ascertaining the comprehensive carrying capacity of island land. Journal of Real Estate Literature, 24(1): 151-166.

Outlines

/