Resources and Environment

High Temperature Risk Assessment at the Municipal Scale in China

  • WEN Xumin , 1, 4, 5 ,
  • ZHANG Peng 2, 3 ,
  • DAI Erfu , 2, 3, *
Expand
  • 1. School of Surveying, Mapping and Geoinformation, Lanzhou Jiaotong University, Lanzhou 730070, China
  • 2. Lhasa Plateau Ecosystem Research Station, Key Laboratory of Ecosystem Network Observation and Simulation, Institute of Geographical Sciences and Resources, Chinese Academy of Sciences, Beijing 100101, China
  • 3. University of Chinese Academy of Sciences, Beijing 100049, China
  • 4. National Local Joint Engineering Research Center for Geographic State Monitoring Technology Application, Lanzhou 730070, China
  • 5. Gansu Province Geographical State Monitoring Engineering Laboratory, Lanzhou 730070, China
*DAI Erfu, E-mail:

WEN Xumin, E-mail:

Received date: 2022-04-28

  Accepted date: 2022-06-20

  Online published: 2023-02-21

Supported by

The National Key Research and Development Program of China(2020YFA0608202)

Abstract

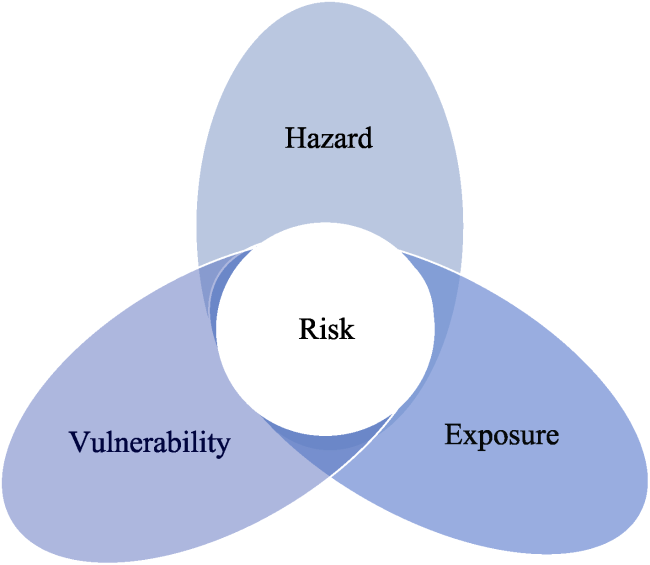
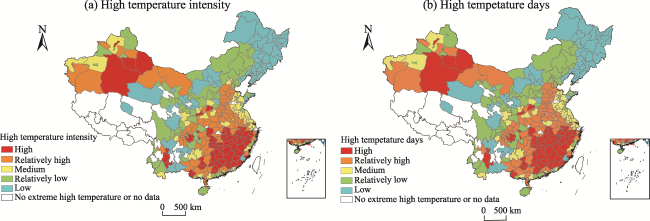
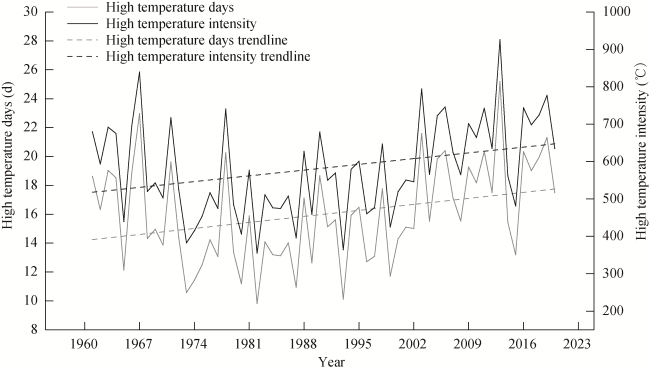
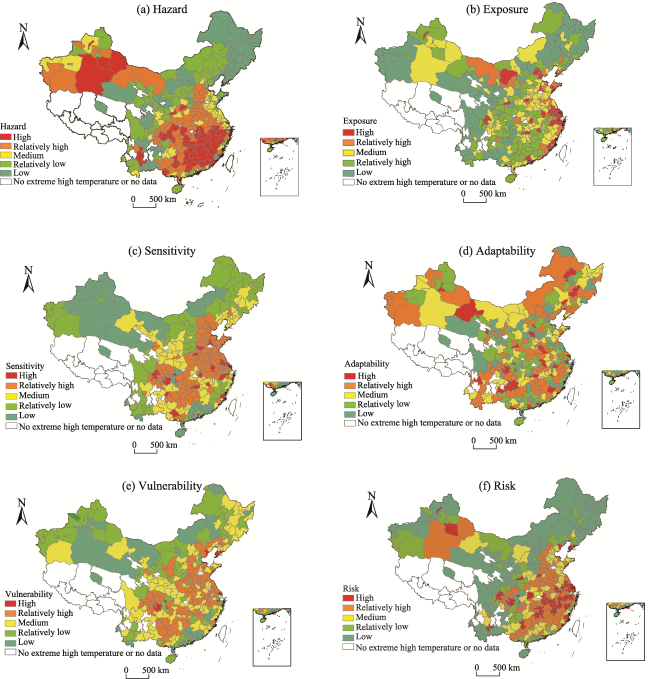
As global warming leads to increases in the frequency and intensity of high temperatures, the negative impacts of high temperatures on human society are becoming increasingly severe. In recent years, heat risk has become the focus of many studies. To effectively address high temperature risks, a high temperature risk evaluation index system was constructed based on Chinese meteorological, demographic, and economic data in three dimensions: hazard, exposure, and vulnerability. The results of this study reveal the spatial pattern of high temperature risks, and identify the main factors contributing to these risks through a contribution model. (1) During 1961-2020, the intensity of high temperatures and the number of high temperature days in China showed a fluctuating upward trend, which was most obvious in the southeast and northwest. (2) The clustering characteristics of high-temperature risk distribution in China were clear, and the high-risk areas were mainly distributed in the southeast and northwest. The urban high-temperature risk values were between 0.00 and 0.50, among which Yuxi, Turpan, Hangzhou, Nanchang, and several other cities had greater high temperature risks. (3) The hazard and vulnerability contributions were the largest among high-risk cities and low-risk cities, respectively. Among the hazard-causing cities, Turpan had the largest hazard contribution; while among the exposure-causing cities, Shenzhen had the largest exposure contribution; and among the vulnerability-causing cities, Pingliang had the largest vulnerability contribution. The findings of this study are of great significance by providing information that will enable an effective response to high-temperature risks and that can be used to strengthen regional disaster prevention as well as mitigation and sustainable economic development.

Cite this article

WEN Xumin , ZHANG Peng , DAI Erfu . High Temperature Risk Assessment at the Municipal Scale in China[J]. Journal of Resources and Ecology, 2023 , 14(2) : 399 -409 . DOI: 10.5814/j.issn.1674-764x.2023.02.018

1 Introduction

On August 9, 2021, the Working Group I (WG I) report “Climate Change 2021: The Physical Science Basis” of the Sixth Assessment Report on Climate Change (AR6) released by the United Nations Intergovernmental Panel on Climate Change (IPCC) pointed out that the past decade (2011-2020) had seen a significant global warming trend, with warming of 1.09 ℃ compared to pre-industrial times (1850-1900) (IPCC, 2021). On 28 February, 2022, the IPCC released its successive AR6 WGII reports, Climate Change 2022: Impacts, Adaptation, and Vulnerability, which made clear once again that climate change is causing loss and damage to nature and human society on a broad scale, and posing serious and irreversible risks including threats to life, disruption of food production, destruction of nature, and reduced economic growth. The impacts of extreme weather and climate events are more severe (IPCC, 2022), and high temperature is a typical feature of extreme weather and climate events.
As the global temperatures rise, the intensity and frequency of high temperature occurrences are rapidly increasing, posing great challenges to human health, safety, and socioeconomic development (Hoag, 2014; Xia et al., 2018; Kang et al., 2020; Wang et al., 2021; Wei et al., 2021), making high temperature risks worthy of in-depth study. Researchers in China and other countries have carried out a great deal of research on the spatial and temporal variations of high temperature and risk assessment. Foreign countries started earlier in high temperature risk assessment (Fischer et al., 2007; Luber et al., 2008; Daniel et al., 2009) and the risks of high temperature have been assessed from the aspects of high temperatures affecting population health (Liu et al., 2018; Khosla et al., 2021), causing heat-related diseases (Erin, 2017; Fisher et al., 2017; Chaseling et al., 2021), and harming ecology (Van et al., 2004), while domestic research on high temperature has mainly focused on analyzing the spatial and temporal characteristics of high temperature from the perspective of disaster science (Yan et al., 2012; Liu et al., 2014; Jia et al., 2017; Ma et al., 2021). Some domestic researchers have also started to focus on the risks of high temperatures (Qin, 2014; Wang et al., 2014; Zhao et al., 2016). The hazards of heat-causing factors have been studied at macroscopic scales such as the national and regional scales or for typical cities (Huang et al., 2012; Zhang et al., 2019; Qi, 2020), and regarding the exposure of carriers such as populations (Huang et al., 2016; Zhang et al., 2016), the economy (Li et al., 2020; Li et al., 2021), and roads (Zhang et al., 2020); while the heat vulnerability characteristics have been analyzed (Xie et al., 2015; Chen et al., 2019; Guo et al., 2021; Huang et al., 2021), and empirical studies of heat risk (Chen et al., 2016; Li et al., 2017; Fu et al., 2020) have been conducted in terms of hazard, exposure, and vulnerability.
Previous research results for high temperature on a large scale are a good start, but further in-depth research is required for three reasons. 1) As global spatial and temporal patterns of temperature and socioeconomic conditions continue to vary, the risks of high temperatures in the current state need to be supported by up-to-date and relevant data. 2) The impact of high temperature is spread across all aspects of society. Therefore, it is not only necessary to consider population and GDP exposure but also aspects of social life, government, and citizens' perception of and ability to cope with high temperatures, and so studies of heat risk need to consider more dimensions and more comprehensive indicators. 3) On the basis of high temperature risk assessment, it is still vitally important to explore the factors influencing high temperature risk. Therefore, this paper selected the latest high temperature observation data, population, and socioeconomic data, and constructed the extreme high temperature disaster risk assessment index system for Chinese cities from the three dimensions of disaster-causing factors: hazards, carrier exposure, and vulnerability, and 18 specific indicators. A high temperature risk assessment model was established and used to conduct a comprehensive evaluation of high temperature risk. On this basis, considering the influences of hazard, exposure, and vulnerability on the risk of high temperature, a model was developed to calculate the contribution of each index to urban heat risk by referring to the calculation principle of the IPCC vulnerability model, and to discern the degree of influence of each index on the risk. This study provides a comprehensive and up-to-date understanding of the high temperature risk characteristics of municipal units in China, with the goal of providing a reference for high temperature risk prevention and improving regional disaster prevention and resilience in China.

2 Materials and methods

2.1 Data source

(1) Meteorological observations were obtained from the National Meteorological Center of China (http://data.cma.cn). According to the China Meteorological Administration, a day with a maximum temperature higher than 35 ℃ is a high-temperature day. Hence, we chose 35 ℃ as the maximum daily temperature threshold for the purpose of this study. Considering that the occurrences of high temperature in China are concentrated in May-October, the daily maximum temperature data of May-October from 714 meteorological stations from 1961 to 2020 were selected. Since some cities in Qinghai, Tibet, and Yunnan had no high temperature events during the study period, this means there is no high temperature risk in these areas.
(2) In this paper, the assessment work for heat risk is national in scope. For the assessment of exposure and vulnerability to heat risk based on municipal scales, socioeconomic statistics were employed considering the availability of information.
Socioeconomic statistics were taken from the 2020 China Urban Statistical Yearbook and the latest relevant information released by the National Bureau of Statistics at the municipal level, These statistics included population density (person km-2), per capita gross regional product (yuan), the proportion of construction workers (%), industrial electricity consumption (million kWh), unemployment rate (%), public finance expenditure (×106 yuan), the average wage of employees (yuan), number of doctors per ten thousand people (person), number of hospital beds per ten thousand people (number of beds), cell phone ownership (number of owners), water supply per capita (t), green space per capita, and air conditioner ownership rate (%), all taken from the 2020 China Urban Statistical Yearbook and the latest information released by the National Bureau of Statistics for each city. The following demographic statistics were obtained from the statistics of the seventh national census: the proportion of the population under 5 years old (%), the proportion of the population over 65 years old (%), and the proportion of the population with a junior high school education or above (%). Many of the statistics were either not available or incomplete for Qinghai Yushu Tibetan Autonomous Prefecture, Guoluo Tibetan Autonomous Prefecture, Haibei Tibetan Autonomous Prefecture, Gansu Gannan Tibetan Autonomous Prefecture, Diqing Tibetan Autonomous Prefecture, Dali Bai Autonomous Prefecture, Baoshan City, Zhaotong City, Qujing, Kunming, Anshun, Tai’an and Taiwan, Hong Kong Special Administrative Region, Macao Special Administrative Region, and Sansha City, which was established in 2012; thus, no high temperature risk analysis could be conducted for them.

2.2 Research methods

2.2.1 High temperature risk evaluation index system

According to disaster risk theory (IPCC, 2014), disaster risk is determined by the combined hazards of the causal factors, exposure of the carrier, and vulnerability (Fig. 1). In this paper, the extreme high temperature disaster risk assessment index in China was constructed from the three dimensions of high temperature hazards, social and economic exposure, and vulnerability with reference to this theory.
Fig. 1 Diagram of high temperature risk formation
The greater the variability of the causative factors, the higher the probability and frequency of occurrence of disasters and the greater the risk. The intensity of high temperature (cumulative temperature) and the number of high temperature days can reflect the magnitude of hazards to some extent (Zhan et al., 2013), so this paper used the two indicators of high temperature intensity and high temperature days to measure urban high temperature hazards.
Exposure is the intersection of the extent of impact from high temperatures and the spatial distribution of the hazard-bearing entities. The population and economy of each municipality are the two most important factors that are affected by the exposure (Chen et al., 2020; Lv et al., 2020). Therefore, in this paper, the two indicators of population density and gross regional product per capita were used as measures of high temperature exposure. The higher the population density and gross regional product per capita, the higher the high temperature exposure.
Vulnerability is influenced by several causes and can be summarized as both sensitivity and adaptability (Huang et al., 2020). Fever and even death due to heat-related illnesses are more likely to occur in children and the elderly. People working outdoors are also more susceptible to high temperature environments. Therefore, this study used the proportion of workers in the construction industry and the proportions of the population under 5 and over 65 years old as measures of urban heat sensitivity. Adaptive capacity reflects the ability of the economy, society, population, and government agencies to adapt, regulate, and cope with environmental changes in the face of climate change. An increase in industrial electricity consumption can lead to a tighter electricity supply, which reduces the ability to cope with high temperatures. The public finance expenditure and the average wage of employees reflect the economic ability of the government and citizens to cope with the risk of heat and other emergencies. Here, the public finance was measured by noting industrial electricity consumption, the average wage of employees, the proportion of the population with a junior high school education or above, the numbers of doctors and hospital beds per ten thousand people, cell phone ownership, water supply, green space per capita, and the air conditioner ownership rate.
Finally, China’s extreme high temperature disaster risk assessment index system was built (Table 1).
Table 1 China’s extreme high temperature disaster risk assessment index system
Target layer Dimensional layer Indicator layer Explanation of indicators Indicator nature
Risk Hazard High temperature strength (℃) The cumulative temperature of daily maximum temperature >35 ℃ +
High temperature days (d) Number of days with daily maximum temperature >35 ℃ +
Exposure Population density (person km-2) Reflects the population in the high temperature region +
Gross regional product per capita (yuan) Reflects the economy in a hot region +
Vulnerability
(Sensitivity)
The proportion of the population under 5 years old (%) Reflects the proportion of the total population in the area that is more sensitive to heat stress +
The proportion of the population over 65 years old (%) Reflects the proportion of the total population in the region that is more sensitive to heat stress +
The proportion of workers in the construction industry (%) Reflects the proportion of the total population in the area that is more sensitive to heat stress +
Vulnerability
(Adaptability)
Industrial electricity consumption
(million kWh)
An increase in industrial electricity consumption leads to a tighter power supply, so the area is more affected by hot weather disasters +
Unemployment rate (%) Reflects the economic capacity of the population to respond to emergencies +
Public finance expenditure (yuan) Reflects the government’s ability to respond and coordinate under the threat of high temperatures
The average wage of employees (yuan) Reflects the economic capacity of the population to cope with emergencies
The proportion of the population with a junior high school education or above (%) Reflects the level of human awareness and ability to deal with high temperatures
Number of doctors per 10000 people (person) Reflects the level of regional health care and the ability to provide medical assistance in the event of surveillance hazards caused by high temperatures
Number of hospital beds per 10000 people
Number of cell phones owned (pcs) Reflects the ability of the population to seek help in the event of a heat-related disaster
Water supply per capita (t) Reflects the city’s water supply
Green space per capita Reflects the city’s ability to respond effectively to high temperatures and thus mitigate their negative effects
Air conditioner ownership rate (%) Reflects the level of city facilities available to cope with high temperatures

Note: + is a positive indicator, - is a negative indicator.

2.2.2 High temperature risk evaluation model

In this paper, a high temperature risk evaluation model is proposed based on hazard, exposure, and vulnerability, where vulnerability is calculated from the perspectives of both sensitivity and adaptive capacity.
$R=H\times E\times V$
$V=S/A$
where R is the urban heat risk normalized index; and H, E, V, S, and A are the hazard, exposure, vulnerability, sensitivity, and adaptive capacity indices, respectively.

2.2.3 High temperature risk impact factor contribution model

In previous high temperature studies, the contribution model was only used as a judgment of the embrittlement-causing factors (Huang et al., 2020). In this paper, it was applied to high temperature risk assessment, and the degrees of influence of hazard, exposure, and vulnerability on risk were calculated based on the following model, which is based on the high temperature risk assessment index system constructed in Table 1.
$\text{Cij}=\frac{Wj\times Iij}{\sum\limits_{j=1}^{3}{Wj\times Iij}}\times 100%$
where Cij is the degree of contribution of the 3-dimensional indicators of city i, Wj denotes the weights of hazard, exposure, and vulnerability, and Iij is the standardized value of the combined index of the three dimensions of the i-th city. For a given city, if the contribution of hazards to risk formation is the largest, then the city is a hazard-causing risk type; and similarly, if exposure or vulnerability has the greatest contribution, then the city is an exposure- or vulnerability-causing risk type, respectively.

3 Results and analysis

3.1 National high temperature characteristics analysis

Based on the spatial distribution of high temperature intensity in China, high temperature events occur in most cities in China, and there are obvious geographic differences. The regions with the highest heat intensity are mainly concentrated in the southern cities of China, especially in southeastern China, southwestern China, northern southern China, and some cities in southwestern China, but also include Xinjiang Uygur Autonomous Region, Yuncheng City in Shanxi Province, and Xi’an City in Shaanxi Province in the north (Fig. 2a). There are 28 cities with an annual average cumulative temperature of 1000 ℃ or more, including Turpan, which has the highest high temperature intensity of 2686 ℃. The lowest high temperature intensity occurred in the northeast.
Fig. 2 Distribution of (a) high temperature intensity and (b) high temperature days from 1961 to 2020
The distribution of cities with a high annual average number of high temperature days is consistent with the regions with a higher intensity of high temperature, as the areas with many high temperature days are located in central, east, and south China and Xinjiang Autonomous Region, and the areas with a lower number of high temperature days are in northeast China (Fig. 2b). There were 20 cities with greater than 30 days, among which Lishui, Turpan, Yuxi, and Yingtan reached more than 40 days, and Turpan was as high as 70 days.
The national average annual high temperature intensity and high temperature days from 1961 to 2020 were basically consistent over time (Fig. 3), with an overall upward trend from 1961 to 2020, with rates of increase of 44.43 ℃ decade-1 in high temperature intensity and 1.24 days decade-1 in high temperature days. The inter-annual variation was obvious, and the top three years for high temperature intensity and the maximum number of high temperature days were 1967 (839.53 ℃, 23 days), 2003 (794.53 ℃, 22 days), and 2013 (925.58 ℃, 26 days). The highest annual average high temperature intensity was 925.58 ℃ in 2013, which was 343 ℃ more than the same period of the previous year of 2012. The highest annual average high temperature days value was 26 days in 2013, which was 10 days more than the same period of the previous year.
Fig. 3 Time series of annual average high temperature intensity and high temperature days nationwide

3.2 Spatial pattern of urban heat risk in China

The high value areas of high temperature risk factors in China were mainly concentrated in southern China (Fig. 4a), with the most high-risk cities in eastern China. The northern high hazard value areas were mainly in the cities of Karamay, Turpan, Bayingoleng Mongol Autonomous Prefecture, and Hami in the Xinjiang region of China, as well as in Yuncheng, Shanxi, and Xi’an, Shaanxi. Turpan city had the highest hazard with a hazard index of 0.51, in addition to an average annual number of high temperature days of up to 70 and a high temperature intensity of 2686 ℃. Higher hazards were distributed in eastern and northern central China, southern and eastern north China, western south China, some cities in southwestern China, and eastern and western Xinjiang. The low and lower danger areas were mainly in northeast China, with the lowest danger index of 0 in Panjin City, Liaoning Province, where only one day reached 35 ℃ in the entire 60-yr period.
Fig. 4 Distribution of the urban high temperature dimensions of (a) hazard (obtained from Figs. 2a, 2b); (b) exposure; (c) sensitivity; (d) adaptive capacity; (e) vulnerability (obtained from Figs. 4c, 4d); and (f) risk (obtained from Figs. 4a, 4b, 4e) in China
The distribution of exposure lacks any prominent concentration characteristics (Fig. 4b), and cities with high exposure mainly include eastern coastal cities and some first-tier cities. Shenzhen has the highest exposure with an exposure index of 1, a population density of 2759.13 persons km-2, which is 2355.32 persons km-2 higher than the regional average, and a per capita gross regional product of 203500 yuan, which is 141700 yuan higher than the regional average. The exposure of Xinjiang Hotan region is the smallest, with an exposure index near 0. Its population density is only 10.03 persons km-2 and the per capita regional GDP is 14900 yuan.
Vulnerability was obtained from sensitivity and adaptive capacity, which have more dispersed distributions (Fig. 4e). Dalian, Qinhuangdao, and Chongqing are highly vulnerable cities with vulnerability indices of 1.87, 1.63, and 1.42, respectively, while Dalian has the smallest adaptive capacity index (0.21), followed by Qinhuangdao (0.25), and Chongqing has a larger sensitivity index of 0.71. Among the higher-vulnerability cities, 63.73% are located in east and central China. Medium-vulnerability cities account for the largest proportion of all cities. The lowest vulnerability is in Haixi Mongolian and Tibetan Autonomous Prefecture, with a vulnerability index of 0.25 and the lowest sensitivity index (0.14).
The clustering characteristics of high temperature risk distribution in China were obvious (Fig. 4f). The proportions of the numbers of cities with high, relatively high, medium, relatively low, and low extreme high temperature disaster risk were 13.02%, 27.30%, 19.68%, 12.70%, and 27.30%, respectively. The high temperature risk value was located between 0.00-0.50, with the risk located in the top ten cities, namely, Yuxi, Turpan, Hangzhou, Nanchang, Chongqing, Suzhou, Changsha, Wuhan, Dalian, and Shanghai. The high-risk areas were mainly located in the south of China, with the largest number of high-risk cities (22) in east China. The overall risk value in east China was high, with an average risk index of 0.28, and the next highest risk value for high temperature was in central China (0.27). Yuxi City had the highest risk of high temperature among all cities in China, with its risk index reaching 0.50, which is 0.29 higher than the average value of the whole region, and its danger was also great, ranking second among all cities. The higher and medium risk cities were mostly coastal cities in the southeast of China, while the low-risk cities were more concentrated in the northeast and northwest. From Fig. 4, the impact of hazards on risk generation is more obvious in the areas with many days with high temperatures. The causes and types of risks leading to these high temperatures are discussed below.

3.3 Analysis of the contributions of high temperature risk factors

The calculation of the contribution of each index to the different risks shows that the contribution of hazards was the largest in high-risk cities, with an average contribution of 34.8%, while the contribution of vulnerability was the largest in relatively high, medium, relatively low and low-risk cities. The vulnerability contribution decreased with increasing risk and was the highest in low-risk cities, while the hazard contribution was positively correlated with the high temperature risk level, and the higher the risk, the greater the hazard contribution in cities. The exposure contribution did not change significantly among the risk levels (Fig. 5).
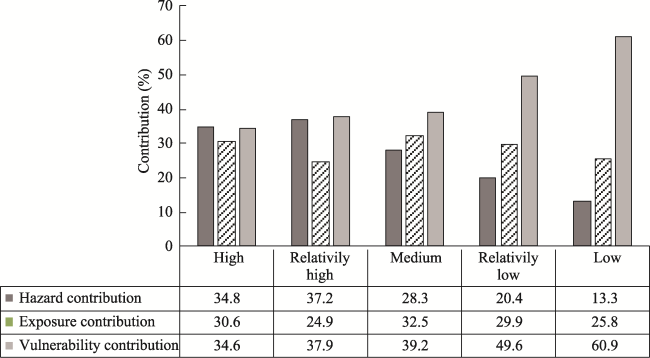
Fig. 5 Risk rating of high temperature in Chinese cities and the contribution of each index
According to their contributions, the cities were classified into hazard-causing risk, exposure-causing risk, and vulnerability-causing risk types (Figs. 6 and 7). Among the hazard-causing risk types, the contribution of hazard is higher than those of exposure and vulnerability, and the contribution of hazard is the largest among the high-risk cities. Among them, the hazard contribution of Turpan City was 81.69%, and its exposure and vulnerability contributions were 7.52% and 10.80%, respectively, while the hazard contributions of Yuxi City, Lishui City, Bayingoleng Mongol Autonomous Prefecture, and Meizhou City were also larger. Shenzhen was the city with the largest contribution of exposure (77.22%) leading to exposure-causing risk, with its hazard and vulnerability contributions of only 3.93% and 18.85%, respectively. Among the vulnerability-causing cities, the vulnerability contribution is the largest among the low-risk cities, with an average contribution of 65.06%. Among them, the vulnerability contribution of Pingliang City was 83.02%, while the contributions of hazard and exposure were only 2.17% and 14.81%, respectively. Other vulnerable-to-risk cities with large vulnerability contributions include Qinhuangdao, Yichun, Dingxi and Linxia Hui Autonomous Prefecture.
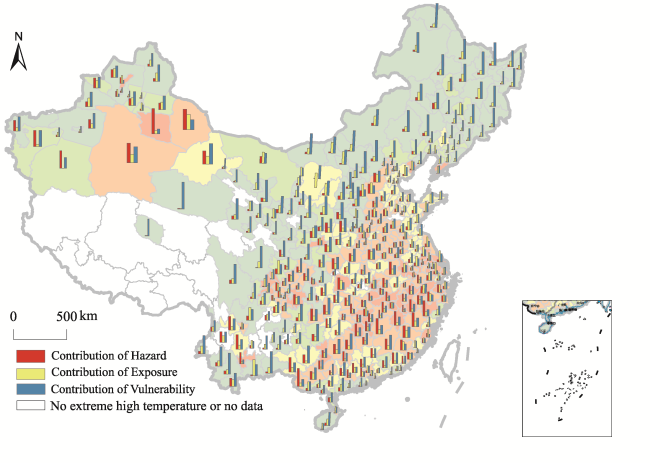
Fig. 6 Spatial distributions of the individual hazard, exposure, and vulnerability contributions at the municipal level in China
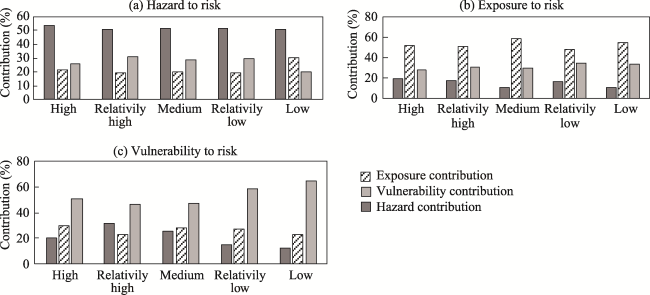
Fig. 7 Types of heat-related risks and the individual index contributions in Chinese cities
The spatial clustering characteristics of hazard-causing cities were the most significant (Fig. 8) and the most numerous in east China, while the cities with the highest hazard contribution were located in Xinjiang and there were no hazard-causing cities in northeast China. The distribution of exposed cities is relatively scattered, mostly in the eastern and southern coastal cities. Vulnerable risk cities are widely distributed, with cities in the northwest, north China, northeast China and the south connected into one contiguous area. The number of vulnerable risk cities is the largest, accounting for 61% of all the cities. Hazardous risk and exposure risk accounted for only 24% and 15%, respectively.
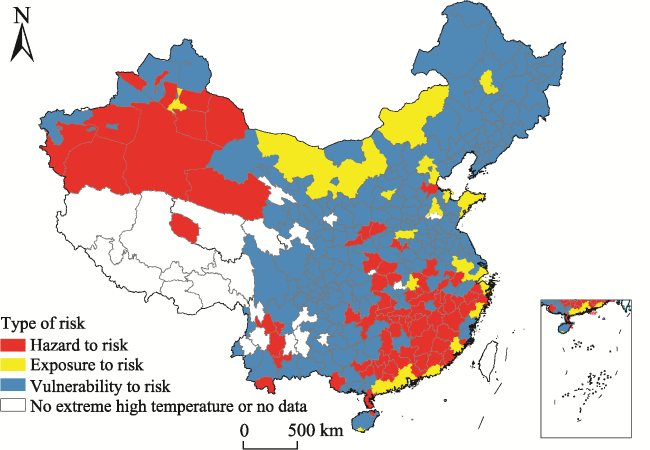
Fig. 8 Distribution of risk types due to high temperature disasters in Chinese cities

4 Discussion

In order to build upon previous research results, the temperature data of China from 1961 to 2020 were analyzed at the municipal level in this study. A high temperature risk assessment model was developed according to the IPCC risk formation principle. Comprehensive indicators were selected using the three risk elements of hazard, exposure, and vulnerability to evaluate high temperature risk. Considering the influences of these elements, a risk contribution calculation model was then established. This model can provide an effective basis for disaster prevention and mitigation, and allows us to define the characteristics of high temperature changes in China’s municipal units and the temporal and spatial patterns of high temperature risks and the internal influencing factors.
This study selected multi-source data and adopted the entropy method and maximum-minimum standardization method to construct the high temperature risk evaluation system and evaluation model for Chinese municipal units, which effectively reduces the errors caused by subjective and objective factors and greatly improves the accuracy of the evaluation results. Furthermore, most of the necessary index data are easy to obtain, and the selection of index factors is more comprehensive and operable, which provides certain reference values.
Based on this research method, the final high temperature risk status levels of China’s municipal units were obtained. The research results clearly reflect the spatial distribution characteristics of high temperature risk in China, and indicated five risk level regions: high, relatively high, medium, relatively low and low. The evaluation results were further analyzed to explore in detail the extent to which the three-dimensional indices contribute to the formation of high temperature risk. The results established that high temperature risk in China is mainly affected by geographical conditions, and its distribution pattern is formed along the north-south dividing line. Similar to the findings of previous studies, hazard was the main factor leading to increased risk, while vulnerability (including sensitivity and adaptability) was the main factor reducing risk. Most cities in northeastern, northern, and central China should focus on vulnerability risks to improve the economic capacities of their government, citizens, and social and medical resources. This would also improve the people’s ability to access information and use natural resources to offset high temperatures. The northwestern and southeastern regions should focus on high temperature risk and improving their forecasting capabilities to ensure that people can access information in a timely manner. Cities in the yellow areas (Fig. 8), such as Shenzhen, should focus on heat risk prevention in densely populated areas.
The findings of this research are significant for effectively responding to high temperature risks, improving local disaster prevention and mitigation, protecting the normal growth of humans and crops, etc., and promoting sustainable socioeconomic development, but it is still not deep enough. Subsequent work should continue to refine the evaluation indexes and further deepen the study by examining a larger amount of existing meteorological station data in China, and then the spatial pattern of high temperature risk in China can be studied in depth at the county or smaller scale, and on this basis, it can contribute to the exploration of continuous high temperature days, that is, high temperature heat waves.

5 Conclusions

(1) High temperature events in China showed a significant upward trend after 1985. Spatially, they were mainly concentrated in southern Chinese cities, with a few in the north, and the intensity of high temperatures was most prominent in Turpan, Xinjiang. The spatial distribution characteristics of high temperature hazard were more significant. Most of the cities with high exposure were more developed economically and included municipalities directly under the control of the central government and provincial capitals. The distribution of vulnerability was more dispersed, and it did not show any obvious spatial clustering characteristics.
(2) The spatial distribution of the high temperature risk index in Chinese cities had significant clustering characteristics, with high temperature high-risk cities concentrated in most of central and eastern China, and a small number of cities distributed in southwestern and northern China. The percentages of cities with the five risk levels of high, relatively high, medium, relatively low and low were 20.70%, 27.62%, 24.76%, 17.14%, and 17.78%, respectively, with the largest number of high-risk cities in east China. The overall risk value in southwest China was high.
(3) The types of heat-causing risks in Chinese cities are hazard-causing risk, exposure-causing risk, and vulnerability-causing risk, and their percentages among the cities were 16.83%, 20.00%, and 63.17%, respectively. Risk contribution and risk level were positively correlated, whereas vulnerability contribution and risk level were negatively correlated. The spatial clustering characteristics of hazard-causing risks were the most significant in terms of spatial distribution, with the largest hazard contribution being 76.0555 in Turpan City. The exposure-causing cities were mostly eastern coastal cities, with the largest exposure contribution being 85.1929 in Liaoyang City. Vulnerability-causing cities were widely distributed, with their areas in northwestern, northern, and northeastern China connected to southern cities in a patchwork, and the largest vulnerability contribution was from the Haixi Mongolian-Tibetan Autonomous Prefecture.
[1]
Chaseling G K, Iglesies-Grau J, Juneau M, et al. 2021. Extreme heat and Cardiovascular health: What a Cardiovascular health professional should know. Canadian Journal of Cardiology, 37(11): 1828-1836.

[2]
Chen J, Liu Y J, Pan T, et al. 2020. Global socioeconomic exposure of heat extremes under climate change. Journal of Cleaner Production, 277 (Dec.20 Pt.1): 123275. 1-123275.12. DOI: 10.1016/j.jclepro.2020.123275.

[3]
Chen K, Tang Y. 2019. Spatial identification of urban heat wave vulnerability and planning strategies to cope with it—A case study of Beijing central city. Urban Planning, 43(12): 37-44. (in Chinese)

[4]
Chen N, Huang Y F, Feng X. 2016. High temperature disaster: Risk assessment and zoning based on GIS in Heze. Chinese Agricultural Science Bulletin, 32(35): 184-187. (in Chinese)

[5]
Daniel J, Jeffrey W, George L. 2009. Socioeconomic indicators of heat- related health risk supplemented with remotely sensed data. International Journal of Health Geographics, 8: 57. DOI: 10.1186/1476-072X-8-57.

[6]
Erin D. 2017. Heat exposure increases risk of heart attack in firefighters. The Mursing and Scientific Journals, 31(36): 16.

[7]
Fischer E M, Seneviratne S I, Lüthi D, et al. 2007. Contribution of land- atmosphere coupling to recent European summer heat waves. Geophysical Research Letter, 34: L06707. DOI: 10.1029/2006GL029068.

[8]
Fisher J A, Jiang C S, Soneja S I, et al. 2017. Summertime extreme heat events and increased risk of acute myocardial infarction hospitalizations. Journal of Exposure Science and Environmental Epidemiology, 27(3): 276-280.

[9]
Fu H C, Deng F, Yang H, et al. 2020. Assessing heat wave risk of urban agglomeration in the middle-lower Yangtze River based on remote sening. Resources and Environment in the Yangtze Basin, 29(5): 1174-1182. (in Chinese)

[10]
Guo Y H, Huang X J, Zheng D Y, et al. 2021. Urban vulnerability patterns and influencing factors under extreme heat stress in China. Tropical Geography, 41(3): 596-608. (in Chinese)

[11]
Hoag H. 2014. Russian summer tops ‘universal’ heatwave index. Nature. DOI: 10.1038/nature.2014.16250.

[12]
Huang D P, Zhang L, Gao G. 2016. Changes in population exposure to high temperature under a future scenatio in China and its influencing factors. Acta Geographica Sinica, 71(7): 1189-1200. (in Chinese)

[13]
Huang H L, Miao Q L, Pan W Z, et al. 2012. Risk zoning of high temperature disaster-causing factors in Hangzhou. Meteorology and Disaster Mitigation Research, 35(2): 51-56. (in Chinese)

[14]
Huang X J, Qi M Y, Zhao K X, et al. 2021. Assessment of population vulnerability to heat stress and spatial differentiation in Xi’an. Geographical Research, 40(6): 1684-1700. (in Chinese)

[15]
Huang X J, Wang B, Liu M M, et al. 2020. Characteristic of urban extreme heat and assessment of social vulnerability in China. Geography Research, 39(7): 1534-1547. (in Chinese)

[16]
IPCC(Intergovernmental Panel on Climate Change). 2014. Climate Change 2014:Impact, adaptation, and vulnerability. Part A:Global and sectoral aspects. Contribution of Working Groups II to the Fifth Assessment Report of the Intergovernmental Panel on Climate Change. Geneva, Switzerland: IPCC.

[17]
IPCC(Intergovernmental Panel on Climate Change). 2021. Climate Change 2021:The physical science basis. Contribution of Working Groups I to the Sixth Assessment Report of the Intergovernmental Panel on Climate Change. Geneva, Switzerland: IPCC.

[18]
IPCC(Intergovernmental Panel on Climate Change). 2022. Climate Change 2022:Impacts, adaptation and vulnerability. Contribution of Working Groups II to the Sixth Assessment Report of the Intergovernmental Panel on Climate Change. Geneva, Switzerland: IPCC.

[19]
Jia J, Hu Z Y. 2017. Spatial and temporal features and trend of different level heat waves over China. Advances in Earth Sciences, 32(5): 546-559. (in Chinese)

[20]
Kang C, Park C, Lee W, et al. 2020. Heatwave-related mortality risk and the risk-based definition of heat wave in South Korea: A nationwide time-series study for 2011-2017. International Journal of Environmental Research and Public Health, 17: 5720. DOI: 10.3390/ijerph17165720.

[21]
Khosla R, Jani A, Perera R. 2021. Health risks of extreme heat. BMJ-British Medical Journal, 375: n2438. DOI: 10.1136/bmj.n2438.

[22]
Li N, He M, Xu Y M. 2017. Assessing heat wave risk in Beijing by remote sensing. Ecology and Environmental Sciences, 26(4): 635-642. (in Chinese)

[23]
Li R K, Han Z Y, Xu Y, et al. 2020. An ensemble projection of GDP and population exposure to high temperature events over Jing-Jin-Ji district based on high resolution combined dynamical and statistical downscaling datasets. Climate Change Research, 16(4): 491-504. (in Chinese)

[24]
Li Y, Liu C X, Song Y. 2021. Research progress of the impact of frequent high temperature heat waves on economic system. Climate Change Research, 17(1): 121-130. (in Chinese)

[25]
Liu Y, Hoppe B O, Convertino M. 2018. Threshold evaluation of emergency risk communication for health risks related to hazardous ambient temperature. Risk Analysis, 38(10): 2208-2221.

[26]
Liu Y H, Xu Y M, Ma J J, et al. 2014. Quantitative assessment and planning simulation of Beijing urban heat island. Ecology and Environmental Sciences, 23(7): 1156-1163. (in Chinese)

[27]
Luber G M A, McGeehin M. 2008. Climate change and extreme heat events. American Journal of Preventive Medicine, 35(5): 429-435.

[28]
Lv Y R, Jiang T, Tao H, et al. 2020. Spatial-temporal patterns of population exposed to the extreme maximum temperature events in the Belt and Road region. Science & Technology Review, 38(16): 68-79. (in Chinese)

[29]
Ma H, Liu C J, Qian Q F, et al. 2021. Analysis on the climatic characteristics of extreme heat-wave during July-August, 2017 and associated large-scale circulation background. Journal of Natural Disasters, 30(5): 85-99. (in Chinese)

[30]
Qi Q H. 2020. Risk characteristics of precipitation and temperature extremes over eastern China under future climatic scenario. Meteorology and Disaster Reduction Research, 43(4): 256-266. (in Chinese)

[31]
Qin D H. 2014. Climate change science and sustainable development. Progress in Geography, 33(7): 874-883. (in Chinese)

[32]
Tan J G, Zheng Y F. 2013. Temporal and spatial distribution characteristics of heat waves in main capital cities of China. Meteorological Science and Technology, 41(2): 347-351. (in Chinese)

[33]
Van Peer L, Nijs I, Reheul D, et al. 2004. Species richness and susceptibility to heat and drought extremes in synthesized grassland ecosystems: Compositional vs physiological effects. Functional Ecology, 18(6): 769-778.

[34]
Wang H C, Lu F, Wu J L, et al. 2014. Review on effects of climate change on population health in China. Science &Technology Review, 32(28/29): 109-116. (in Chinese)

[35]
Wang Z X, Cheng Y B, Li Y H, et al. 2021. A time-series study of the association between extremely high temperature and outpatient visits. Journal of Environmental Health, 11(2): 126-133. (in Chinese)

[36]
Wei D, Zeng X H, Luo N, et al. 2021. Effects of extreme high temperature on summer maize yield in Beijing-Tianjin-Hebei region. Journal of China Agricultural University, 26(1): 1-17. (in Chinese)

[37]
Xia Y, Li Y, Guan D, et al. 2018. Assessment of the economic impacts of heat waves: A case study of Nanjing, China. Journal of Cleaner Production, 171: 811-819.

[38]
Xie P, Wang Y L, Liu Y X, et al. 2015. Incorporating social vulnerability to assess population health risk due to heat stress in China. Acta Geographica Sinica, 70(7): 1041-1051. (in Chinese)

[39]
Yan X Y, Zhao C Y, Wang Y, et al. 2012. Change trend of extreme temperature in Northeast China for the past 50 years. Journal of Arid Land Resources and Environment, 26(1): 81-87. (in Chinese)

[40]
Yin Z E, Yin J, Zhang X W. 2013. Multi-scenario-based hazard analysis of high temperature extremes experienced in China during 1951-2010. Journal of Geographical Sciences, 23(3): 436-446.

[41]
Zhang L, Huang D P, Yang B Y. 2016. Future population exposure to high temperature in China under RCP4.5 scenario. Geographical Research, 35(12): 2238-2248. (in Chinese)

[42]
Zhang T, Cheng C X. 2019. Assessment of China’s high-temperature hazards: Accounting for spatial agglomeration. Journal of Geo-information Science, 21(6): 865-874. (in Chinese)

[43]
Zhang X L, Yang S N, Jia L. 2020. Analysis of road exposure on the context of the future scenario of extremely high temperature in China. Journal of Catastrophology, 35(2): 224-229. (in Chinese)

[44]
Zhao Y C, Zhao X F, Liu L L. 2016. Spatial pattern analysis on human heatwave in Xiamen City. Journal of Geo-information Science, 18(8): 1094-1102. (in Chinese)

Outlines

/