
Journal of Resources and Ecology >
Projections of the Emission Reductions of Carbon Dioxide and Conventional Pollutants in the Major Transport Sectors of the Beijing-Tianjin-Hebei Region, China
Received date: 2022-04-28
Accepted date: 2022-06-28
Online published: 2023-02-21
Supported by
The National Natural Science Foundation of China(51978011)
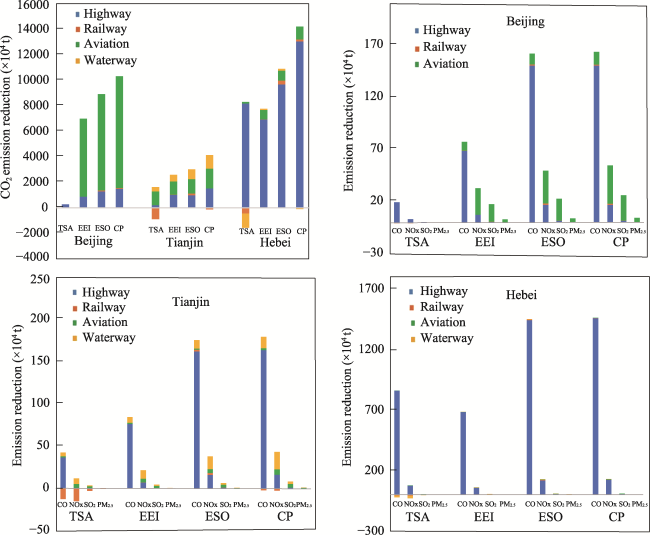
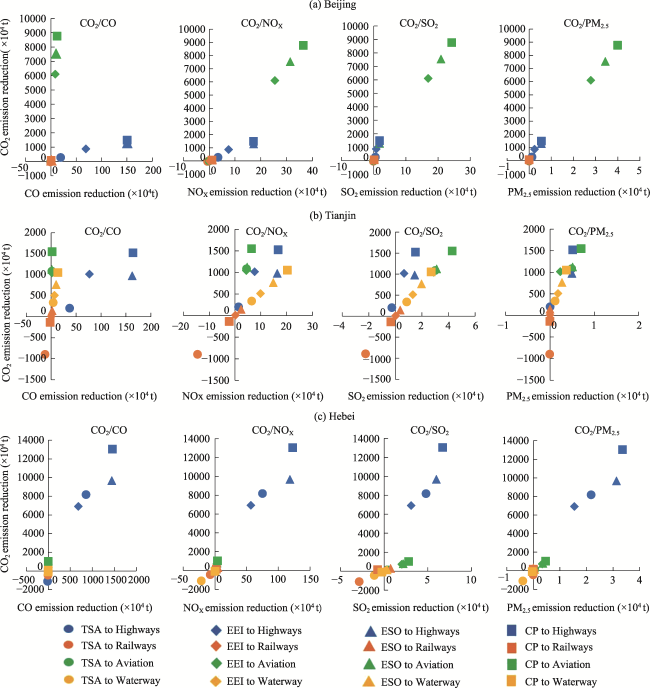
Many stakeholders recognize that the transport sector should be a major focus for reducing the emissions of carbon and air pollutants since it is the third largest sector for energy consumption in China. This study analyzed and projected the energy consumption and emissions of CO2 and conventional air pollutants (CO, NOX, SO2, and PM2.5) from four transport sectors (highway, waterway, railway and aviation) based on the LEAP model, compared the emission reduction potentials of different transport sectors under different scenarios in 2020-2060, and finally explored the co-reduction effect for CO2 and the four pollutants under different control measures. The results showed that the CO2 emissions from the transportation sectors in the Beijing-Tianjin-Hebei (BTH) region would increase greatly under the baseline scenario. Estimates indicate that the CO2 emissions of Beijing, Tianjin and Hebei Province would increase by 263.72%, 225.87% and 405.43% in 2060, respectively. Under the comprehensive policy scenario, the emission reductions would be 88.78%, 76.86% and 83.20% respectively, and the maximum emission reduction rate of pollutants is expected to reach 78.73%-99.34%. The sectors with major reduction potentials for CO2 and conventional pollutants are the aviation and road transport sectors, which contribute 38.19%-99.85% of the total, respectively. The co-reduction achieved by optimizing the energy structure in the road transport and aviation sectors would be the best. The results of this study can provide a basis for the formulation of low-carbon reduction strategies for the transport sectors in the BTH region.
GUO Xiurui , GONG Xiaoqian , LIU Yao , ZHANG Yiling . Projections of the Emission Reductions of Carbon Dioxide and Conventional Pollutants in the Major Transport Sectors of the Beijing-Tianjin-Hebei Region, China[J]. Journal of Resources and Ecology, 2023 , 14(2) : 372 -382 . DOI: 10.5814/j.issn.1674-764x.2023.02.015
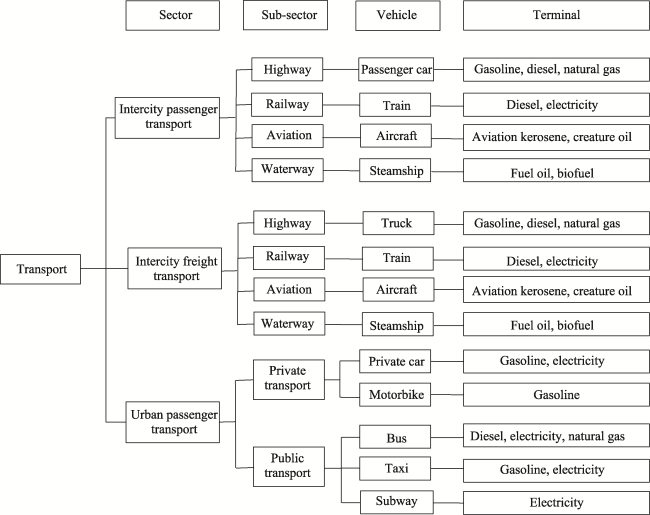
Fig. 1 The framework of the LEAP-BTH/TR model developed in this study |
Table 1 Emission factors of CO2 and air pollutants (Unit: kg tce‒1) |
| Sub-sector | Energy type | CO2 | CO | NOx | SO2 | PM2.5 |
|---|---|---|---|---|---|---|
| Highway | Gasoline | 2025.28 | 234.16 | 17.56 | 0.58 | 0.44 |
| Diesel | 2168.69 | 29.27 | 23.42 | 5.41 | 1.06 | |
| LPG | 1861.35 | 234.16 | 17.56 | 0.00 | 0.01 | |
| CNG | 1624.54 | 11.71 | 17.58 | 0.00 | 0.03 | |
| Railway | Diesel | 2168.69 | 29.27 | 35.12 | 5.41 | 0.01 |
| Aviation | Kerosene | 2106.84 | 2.93 | 8.78 | 5.83 | 0.96 |
| Waterway | Fuel oil | 2201.98 | 29.27 | 43.91 | 5.83 | 0.80 |
Table 2 Emission factors of CO2 and air pollutants from electric vehicles in the BTH region (Unit: g kWh‒1) |
| Region | CO2 | CO | NOx | SO2 | PM2.5 |
|---|---|---|---|---|---|
| Beijing | 615 | 0.00 | 0.05 | 0.03 | 0.01 |
| Tianjin | 811 | 0.00 | 0.06 | 0.02 | 0.01 |
| Hebei | 903 | 0.00 | 0.09 | 0.04 | 0.01 |
Table 3 Detailed descriptions of the three policy scenarios considered in this study |
| Scenario | Scenario definition | Specific description |
|---|---|---|
| Transportation Structure Adjustment (TSA) | The proportion of railway transport in the BTH region would be increased, vigorously develop railway freight and waterway freight transport, build a national comprehensive three-dimensional transportation network with railway as the main trunk based on the highway, and make use of the comparative advantages of water transport and civil aviation | In 2060, railway freight would account for 80% in Beijing, 60% railway and 35% waterway freight in Tianjin, and 70% railway and 25% waterway freight in Hebei Province The population of private cars in Beijing, Tianjin and Hebei would be controlled within 5, 4 and 30 million, respectively The sharing rate of passenger public transport in the city would be increased |
| Energy Efficiency Improvement (EEI) | With the continuous innovation and progress of science and technology, the energy consumption per unit activity level of the terminal equipment in various transportation sectors would decrease; the continuous optimization of fuel economy and the popularization of new technologies would be increasingly extensive in the transport sectors | Energy consumption of highway passenger turnover would decrease by 1.5%, road freight by 1%, air freight by 2%, fuel efficiency of private cars and taxis by 1.5%, and bus fuel efficiency by 1%. Energy consumption of highway passenger and freight traffic would decrease by 1% per year, air passenger and freight by 2% and 1%, fuel efficiency of private taxis by 1%, and bus fuel efficiency by 0.5% |
| Optimizing the Energy Structure (ESO) | The rate of clean energy consumption in transportation sectors would increase, and the proportion of clean energy sources such as electricity, natural gas, biofuels and hydrogen energy used for all kinds of vehicles would increase | In 2040, all buses and taxis in Beijing would be all electricity-driven; in 2050, road passenger transport and private cars would be all driven by new energies; in 2060, road freight would all be new energy driven; railway electrification would account for 80%, and aviation biofuel would account for 80%. In 2060, new energy used in the road passenger and freight in Tianjin and Hebei Province would account for more than 80%, the electrification of railway passenger and freight would account for 80%, aviation biofuel would account for 70%, clean energy such as biofuel applied in the water transportation industry would account for 60% |
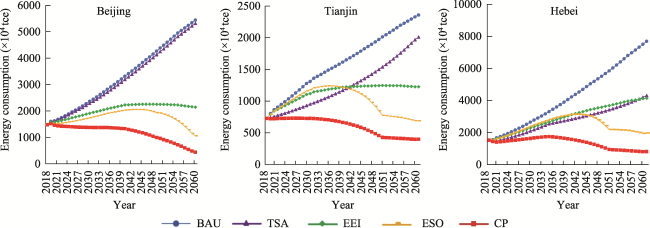
Fig. 2 Projected total energy consumption from the transport sectors under each of the different scenarios in the BTH region, ChinaNote: tce, called coal equivalent, a unit of energy measurement for summing and comparing the different types of energy source according to the calorific value of standard coal. |
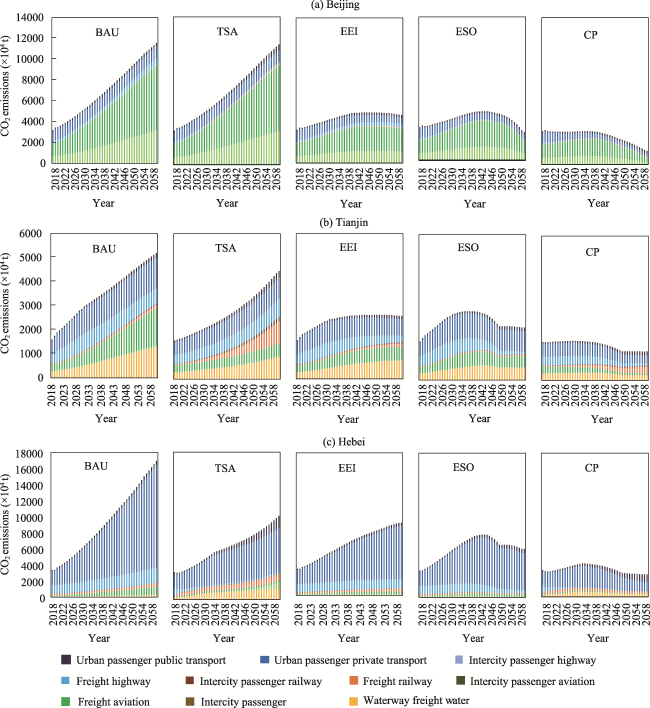
Fig. 3 Predictions of CO2 emissions from the transport sectors under the different scenarios in the BTH region, China |
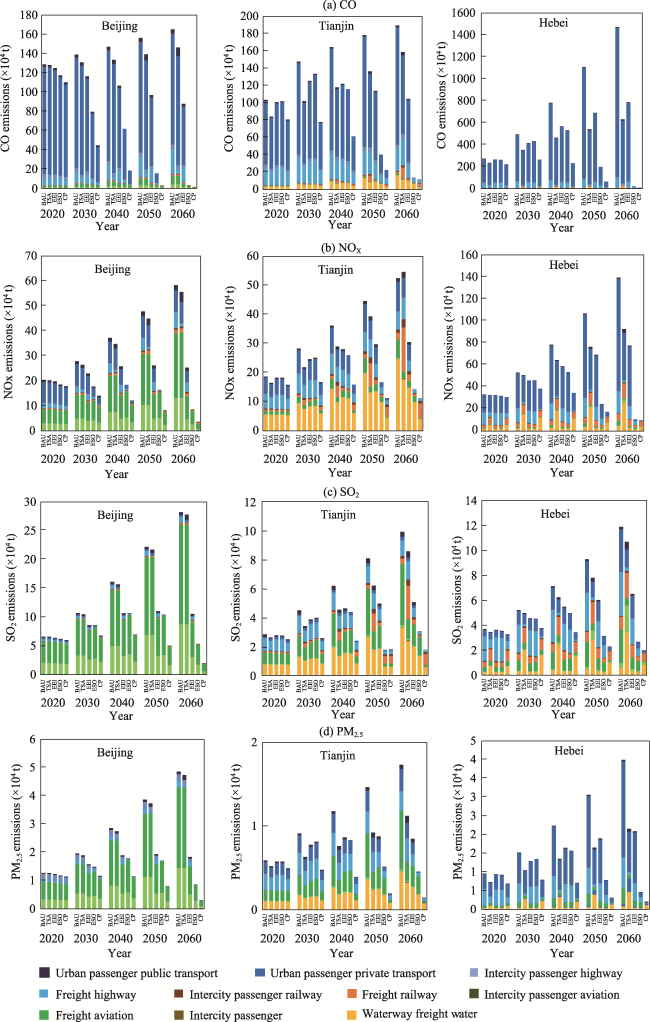
Fig. 4 Projected emissions of pollutants from the transportation sectors under different scenarios in the BTH region, China |
Fig. 5 Emission reductions of CO2 and four common pollutants from the major transport sectors under different scenarios in the BTH region in 2060 |
Fig. 6 The co-reduction effects on CO2 and pollutants from different transport sectors under different scenarios in the BTH region in 2060 |
| [1] |
|
| [2] |
|
| [3] |
|
| [4] |
|
| [5] |
|
| [6] |
|
| [7] |
|
| [8] |
|
| [9] |
|
| [10] |
|
| [11] |
|
| [12] |
|
| [13] |
|
| [14] |
|
| [15] |
|
| [16] |
|
| [17] |
|
| [18] |
|
| [19] |
|
| [20] |
|
| [21] |
|
| [22] |
|
| [23] |
|
| [24] |
|
| [25] |
|
| [26] |
|
| [27] |
|
| [28] |
|
| [29] |
|
| [30] |
|
| [31] |
|
| [32] |
|
/
| 〈 |
|
〉 |