Tourism Resources and Ecotourism

Tourists’ Willingness to Pay for the Non-use Values of Ecotourism Resources in a National Forest Park

  • SHEN Hanli , 1, 2 ,
  • ZHENG Xin , 3, 4, * ,
  • LEE Chunhung 5 ,
  • JIA Jingbo 6 ,
  • KHATTAK Romaan Hayat 6
Expand
  • 1. College of Teacher Education, Northwest Normal University, Lanzhou 730070, China
  • 2. College of Economics and Management, Northeast Forestry University, Harbin 150040, China
  • 3. Library of Northeast Forestry University, Northeast Forestry University, Harbin 150040, China
  • 4. College of Economics and Management, Tarim University, Alar, Xinjiang 843300, China
  • 5. College of Environmental Studies and Oceanography, Dong Hwa University, Hualien, Taiwan 97401, China
  • 6. College of Wildlife and Protected Area, Northeast Forestry University, Harbin 150040, China
*ZHENG Xin, E-mail:

SHEN Hanli, E-mail:

Received date: 2021-08-17

  Accepted date: 2022-01-06

  Online published: 2023-02-21

Supported by

The Taiwan Science Council Special Research Grant(98-2621-M-002-012)

Abstract

National forest parks are important ecotourism destinations for locals and out-of-town visitors worldwide. The increase in protected areas is accompanied by challenges. The major challenge is the tension between conservation and exploitation. However, over-exploitation is causing irreversible damage to tourism resources by neglecting to accelerate conservation and satisfying the needs of only tourists. Therefore, it is a prerequisite to evaluate the value of ecotourism resources, especially non-use values. Liugong Island National Forest Park is a seaside forest park in Shandong Province, China. Tourist activities have negatively impacted the amenity and values of the park and increased management and maintenance costs. This study aimed to enhance the protection awareness of ecotourism resources by evaluating non-use values with the contingent valuation method (CVM). Ecotourism attitude factors were extracted by factor analysis, and the ecotourism market was segmented by cluster analysis. Then, an empirical assessment model was designed. Furthermore, through a double-bounded dichotomous choice model of the CVM, non-use values of ecotourism resources were estimated, and differences in non-use values among the groups with different attitudes were discussed. The results indicated that (1) Tourists with conservation backgrounds tended to pay more for general non-use values, while high-income tourists were willing to pay more for the Altruistic value; (2) The willingness to pay (WTP) of tourists was highest for the Bequest value, followed by the Existence value or Altruistic value, and finally the Option value; (3) The WTP was highest for the group valuing pluralism, followed by the group concerning resources, and lowest for the group concerning the environment. This study can provide valuable information for ecotourism planning and management that corresponds to current issues and tourist needs.

Cite this article

SHEN Hanli , ZHENG Xin , LEE Chunhung , JIA Jingbo , KHATTAK Romaan Hayat . Tourists’ Willingness to Pay for the Non-use Values of Ecotourism Resources in a National Forest Park[J]. Journal of Resources and Ecology, 2023 , 14(2) : 331 -343 . DOI: 10.5814/j.issn.1674-764x.2023.02.011

1 Introduction

The modern concept of ecotourism involves traveling to engage in attractive and interesting environments, often including contact with indigenous people, without contributing to the degradation of the subjects of interest (Carrier and Macleod, 2005). The main principles of ecotourism focus on actively contributing to the conservation of natural resources, integrating the knowledge of native communities into ecotourism planning to enhance community well-being and organizing tourists into small groups (World Tourism Organization, 2002). As an important activity, ecotourism can balance biodiversity conservation and livelihood improvement (Forje et al., 2021) and can become a catalyst for positive change in tourism development (UNWTO, 2017). Ecotourism frequently occurs in national parks. National parks serve multiple functions, protecting natural areas and ecosystem dynamics while providing recreation and nature education for tourists (Sriarkarin and Lee, 2018). Many national parks attempt to draw large numbers of tourists for economic development. However, apart from illegal logging and poaching, inherent tensions between environmental preservation and economic development frequently arise due to the excessive development of tourism infrastructure and congested traffic (Gössling, 1999; Ghazvini et al., 2020). With the increasing number of unmanaged tourists, more vegetation is trampled, and tensions are becoming acute. Ecotourism should not lead to the degradation of national parks. However, unwitting damage may be caused by tourists (Buultjens et al., 2005; Herrera-Silveira et al., 2010), and non-consumptive tourists may expect more local amenities and infrastructure than consumptive tourists such as safari hunters (Deere, 2011). The management of non-consumptive tourists to protect the natural resources of parks incurs financial costs. Therefore, it is essential to balance environmental protection and economic development.
Most studies have focused on residents’ attitudes to ecotourism, and few empirical studies have examined tourists’ attitudes. For example, Ghazvini et al. (2020) found that environmental concerns can negatively affect tourists’ attitudes towards the appropriateness of activities, facilities, and accommodations in national parks, and the attitudes toward human uses of national parks vary across cultures among various groups of visitors. Flower et al. (2021) revealed tourists’ attitudes towards elephants in elephant tourism venues. Participants’ attitudes towards the treatment and welfare of elephants varied with their experiences at elephant tourism venues. It is necessary to explore tourists’ attitudes because tourists are important stakeholders and are considered a key factor in negotiating coherent and acceptable management policies for developing ecotourism, which should be considered by park managers (Reihanian et al., 2012; Zong et al., 2017). Therefore, the importance of public perceptions of sustainable development has been studied (Rajapaksa et al., 2018). Based on the individuals’ formulations of perception and attitudes towards ecotourism, tourists’ recreation behavior is indirectly affected by the quality of ecotourism resources. The public can directly affect the quality of ecotourism resources through individual behavior, depending on their attitudes and perceptions of ecotourism (Petrosillo et al., 2007). Some studies indicated that ambivalent attitudes and nature-based tourists are heterogeneous, and individual tourists’ environmental attitudes and behaviors may play out differently at different sites (Kim and Weiler, 2013; Ballantyne et al., 2009). do Valle et al. (2012) found that most tourists surveyed were unwilling to pay an accommodation tax to fund environmental protection. Moreover, Müller and Job (2009) showed that tourists generally had a neutral attitude towards the bark beetle and were slightly against controlling insects in the park.
Tourists may be willing to pay a premium to support environmental protection in national parks. Nonetheless, their attitudes vary (Kim and Weiler, 2013) according to their educational, financial, and demographic characteristics (Petrosillo et al., 2007; Nuva et al., 2009), motivations, and past experiences (Ballantyne et al., 2009; do Valle et al., 2012). Tourists with the attribute of concern for the environment have a willingness to pay (WTP) a premium for ecologically-sustainable alternatives (Hedlund, 2011), and the WTP a premium has been determined in some instances (Nuva et al., 2009). Solving the contradiction between tourism development and resource protection requires a scientific means to assess non-use values. Such assessments can reveal the hidden values of ecosystem services. According to the theory of natural resource values, the non-use values of natural resources to individuals include the Option value (accruing from the potential for individual use), Existence value (accruing from the persistence of resources), Bequest value (accruing because the resources are preserved for future descendants), and Altruistic value (accruing because the resources are available for other sectors of society) (Aabø and Strand, 2004; Lee and Mjelde, 2007; Aseres and Sira, 2020). Among them, Option value and Bequest value overlap conceptually (Jia, 2011). The non-use values of natural resources reflect the value placed on the asset by individuals or society, irrelevant to direct use values (Nuva et al., 2009). The non-use values of natural resources reflect the satisfaction of people, which can be measured by WTP to protect resources. As argued by many scholars and studies, the WTP approach is one of the few methods of resource valuation. The approach reveals the individual valuation of environmental resources, such as the WTP for forest existence values (Amirnejad et al., 2006; Bamwesigye et al., 2020), the WTP for beach scenery and its preservation (Rodella et al., 2020), the WTP for the restoration of coastal wetlands and species protection (Cerda and Losada, 2013), and the WTP for biodiversity conservation (Bhat and Sofi, 2021). Economists have developed many non-market valuation approaches, but the most commonly used one is the contingent valuation method (CVM).
The contingent valuation method (CVM) is a survey-based technique, where a hypothetical market situation is created to elicit people’s preference by using different payment vehicles (Zambrano-Monserrate, 2020). In the CVM survey, dichotomous choice closed questions, open-ended questions, bidding games, or the payment card method were used. As a superior elicitation method, the dichotomous choice approach was used in this study. Respondents were asked only to accept or reject a suggested price in a hypothetical market situation. In other words, they only needed to answer “yes” or “no”, and each respondent was confronted with different prices (Lockwood and Tracy, 1995; Lee and Han, 2002). The closed CVM includes a single-bounded dichotomous choice model and a double-bounded dichotomous choice model. This study adopted the double-bounded dichotomous choice model since it is statistically more valid (Hanemann et al., 1991). Many researchers agreed that CVM is a proper and effective tool to evaluate the values of environmental goods and services (Bhat and Sofi, 2021). Now CVM has been widely used to value endangered species (Kotchen and Reiling, 2000; Bandara and Tisdell, 2003; Cardoso de Mendonca et al., 2003; Baral et al., 2007), waste management (Afroz and Masud, 2011; Gaglias et al., 2016), urban green spaces (Chen and Jim, 2008; Lo and Jim, 2010; Chen and Qi, 2018), air quality (Wang and Zhang, 2009), ecosystem services (Farber et al., 2002) including water ecosystem (Jala and Nandagiri, 2015), wetland ecosystem (Thapa et al., 2020) and deep-sea ecosystem restoration (O’Connor et al., 2020 ), health and welfare (Yip et al., 2007), and tourism resources (Wang and Jia, 2012; Halkos et al., 2020). The method has been used to inform environmental and economic policy in many countries (Shrestha et al., 2007; Wilson et al., 2010). For ecotourism, from the perspective of sustainable development, it is important not only to protect natural resources, preserve the traditional culture, and promote the sustainable development of local communities but also to allow stakeholders to participate in planning and management. In particular, tourists’ attitudes to ecotourism are often considered an important basis for planning and managing national parks. This study focuses on tourists’ attitudes to assess the welfare effects of ecotourism resources, which is a critical aspect of the overall management of national forest parks. Such an assessment can improve the budget allocation mechanism system of forest parks. To enhance the understanding of the connotations of ecotourism and the non-use values of ecotourism resources, this study incorporated tourists’ attitudes factors into the non-use values assessment to estimate the Option value, Existence value, Bequest value and Altruistic value of the ecotourism resources in Liugong Island National Forest Park (LINFP), as revealed by the interval value of WTP (Alberini, 1995a). The non-use values of natural resources reflect the value placed on the asset by an individual or society and are independent of the direct use value.

2 Research area and methods

2.1 Research area

Liugong Island National Forest Park (LINFP) [The longitude and latitude are 122.190763°E, 37.508097°N respectively], which is an offshore island, is located in the east of Weihai City, Shandong Province, China, 3.15 km from Weihai (Fig. 1). In 1992, it was declared a national forest park to protect its unique landscapes, natural ecology, wildlife, and cultural heritage and to provide opportunities for recreation and scientific research. The park covers an area of 227.55 ha, with an east-west length of 4.08 km and a north-south width of 1.5 km. The highest point is Qidingshan, 153.5 m above sea level (Tian and Peng, 2019). The list of species for LINFP includes 80 woody plants, over 50 herbaceous plants, and more than 50 birds and mammals. Woody plants involve Pinus thunbergii, Sabina chinensis, Celtis sinensis, Ginkgo biloba, etc. Herbaceous plants include Dendranthema indicum, Dianthus chinensis, Mimosa pudica, etc. Birds comprise Mongolian Lark, Cuculus canorus, LINFP is the ancient battlefield of the Sino-Japanese War of 1894-1895 and the site of the Sino-Japanese War Museum (Liugong Island Administrative Office, 2021). Since its establishment, the forest park has attracted substantial domestic and international visitors, with the number increasing each year.
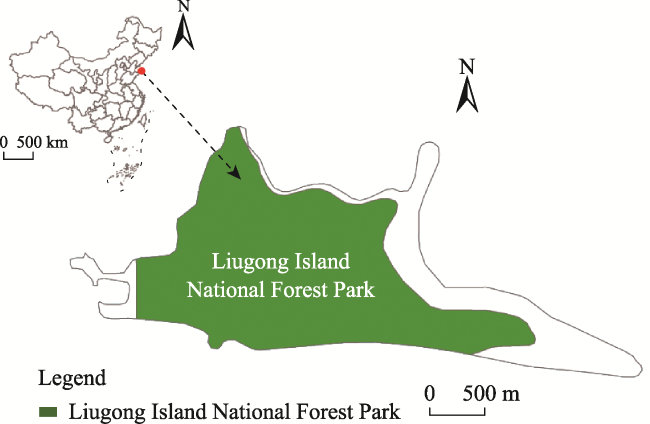
Fig. 1 Map of the location of Liugong Island National Forest Park

2.2 Study methods

2.2.1 Double-bounded dichotomous choice model

Assuming that the first threshold price is answered, every respondent answers the second WTP (Cameron and Quiggin, 1994; Cameron et al., 1996). Therefore, the amount of the second WTP will be decided by that of the first WTP to be accepted or not. Assuming that the respondent answers “yes” to the first threshold price (Bi), the amount of the second WTP ($B_{i}^{u}$) must be higher than the first threshold price (${{B}_{i}}<B_{i}^{u}$). Conversely, if the respondent answers “no” to the first threshold price (${{B}_{i}}$), the amount of the second WTP ($B_{i}^{d}$) must be lower than the first threshold price ($B_{i}^{d}<{{B}_{i}}$).
Therefore, four combinations are obtained: (1) YY = answer both “yes” in the double quotes; (2) NN = answer both “no” in the double quotes; (3) YN = answer “yes” in the first quote and “no” in the second quote; (4) NY = answer “no” in the first quote and “yes” in the second quote. The probability of four combinations can be expressed as ${{\pi }^{\text{YY}}}$, ${{\pi }^{\text{NN}}},$${{\pi }^{\text{YN}}}$, and ${{\pi }^{\text{NY}}}.$ Assuming that the respondent pursues the utility maximization, the likelihood of the above results can be described as follows.
For the first combination, if $B_{i}^{u}>{{B}_{i}}$ and $\Pr {{B}_{i}}\le \text{Max}$ $\left. WTP \right|B_{i}^{u}\le \text{Max }\ WTP\equiv 1$, the probability can be presented as:
$\begin{align} & {{\pi }^{\text{YY}}}({{B}_{i}},B_{i}^{u}) \\ & =\Pr \{{{B}_{i}}\le \text{Max }WTP\text{ and }B_{i}^{u}\le \text{Max }WTP\}\text{ } \\ & =\Pr \{{{B}_{i}}\le \text{Max }\left. WTP \right|B_{i}^{u}\le \text{Max }WTP\} \\ & \ \ \ \ \ \ \ \ \ \ \ \ \ \ \ \times \Pr \{B_{i}^{u}\le \text{Max }WTP\} \\ & =\Pr \{B_{i}^{u}\le \text{Max }WTP\} \\ \end{align}$
For the second combination, if $B_{i}^{d}<{{B}_{i}}$and $\Pr \{B_{i}^{d}\le $ $\text{Max}\ \left. WTP \right|{{B}_{i}}\le \text{Max}\ \ WTP\}\equiv 1$, the probability can be expressed as:
$\begin{align} & {{\pi }^{\text{NN}}}({{B}_{i}},B_{i}^{d})= \\ & \Pr \{{{B}_{i}}>\text{Max }WTP\text{ and }B_{i}^{d}>\text{Max }WTP\} \\ \end{align}$
For the third combination, the probability can be presented as:
${{\pi }^{\text{YN}}}({{B}_{i}},B_{i}^{u})=\Pr \{{{B}_{i}}\le \text{Max }WTP\le B_{i}^{u}\}$
For the fourth combination, the probability can be denoted as:
${{\pi }^{\text{NY}}}({{B}_{i}},B_{i}^{d})=\Pr \{{{B}_{i}}\ge \text{Max }WTP\ge B_{i}^{d}\}$
where Max WTP is the highest WTP of the i-th respondent. In formulas (3) and (4), the second quote is the highest WTP of the respondent and the upper bound and lower bound of WTP, respectively. In formulas (1) and (2), the second quote is the lower bound and upper bound of WTP, respectively. Therefore, if there are N respondents, the log-likelihood function of the i-th respondent can be expressed as follows:
$\begin{align} & \ln {{L}^{D}}(\theta )= \\ & \sum\limits_{i=1}^{N}{\left\{ \begin{align} & d_{i}^{\text{YY}}\times \ln {{\pi }^{\text{YY}}}({{B}_{i}},B_{i}^{u})+d_{i}^{\text{NN}}\times \ln {{\pi }^{\text{NN}}}({{B}_{i}},B_{i}^{d})+ \\ & d_{i}^{\text{YN}}\times \ln {{\pi }^{\text{YN}}}({{B}_{i}},B_{i}^{u})+{{d}^{\text{NY}}}\times \ln {{\pi }^{\text{NY}}}({{B}_{i}},B_{i}^{d}) \\ \end{align} \right\}} \\ \end{align}$
where$d_{i}^{YY}$, $d_{i}^{NN}$, $d_{i}^{YN}$ and $d_{i}^{NY}$ are the probability of respondents’ WTP, corresponding to Formulas (1)–(4). Therefore, the maximum likelihood estimation value (${{\hat{\theta }}^{D}}$) of the double-bounded dichotomous choice model is the equilibrium solution of the log-likelihood function ($\ln {{L}^{D}}$ $({{\hat{\theta }}^{D}})$) calculated by the first-order condition through the estimator ($\theta $), i.e.,$\partial \ln {{L}^{D}}({{\hat{\theta }}^{D}})/\partial \theta =0$. The estimated value ($\theta $) is statistically consistent and asymptotically efficient. The asymptotic variance-covariance matrix of (${{\hat{\theta }}^{D}}$) can be expressed as:
${{V}^{D}}({{\hat{\theta }}^{D}})=-E\frac{{{\partial }^{2}}\ln {{L}^{D}}({{{\hat{\theta }}}^{D}})}{\partial \theta \partial {\theta }'}\equiv {{I}^{D}}{{({{\hat{\theta }}^{D}})}^{-1}}$
where ${{I}^{D}}{{({{\hat{\theta }}^{D}})}^{-1}}$ is the information matrix (Cameron and Quiggin 1994; Cameron et al., 1996).

2.2.2 Model design

The double-bounded dichotomous choice model is used in this empirical study. The evaluation function of the non-use values of ecotourism resources is presented as (Cameron and Quiggin, 1994):
$\left\{ \begin{matrix} WT{{P}_{i1}}={{x}_{i}}\times {{\beta }_{1}}+{{\varepsilon }_{i1}} \\ WT{{P}_{i2}}={{x}_{i}}\times {{\beta }_{2}}+{{\varepsilon }_{i2}} \\ \end{matrix} \right.$
where WTPi1 and WTPi2 are the amounts of WTP of tourists facing two successive quotes; xi is the characteristic variable of the i-th tourist, including socio-economic background, attitude toward ecotourism, environmental awareness, and fund cognition; β is the parameter vector; εi1 and εi2 are residual terms that obey the bivariate normal (BVN) distribution. The mean is 0, variances are $\sigma _{1}^{2}$ and$\sigma _{2}^{2}$, and the correlation coefficient is ρ. The BVN distribution is $BVN({{{x}'}_{1}}{{\beta }_{1}},$ ${{{x}'}_{2}}{{\beta }_{2}},\sigma _{1}^{2},\sigma _{2}^{2},\rho )$ (Alberini, 1995a; Cameron et al., 1996).
The correlation coefficient of WTPi1 and WTPi2 is ρ. In general, ρ is 1, which indicates that εi1 and εi2 are completely relevant (Lawless, 2003), and tourists’ second quote is fully in accordance with the first quote. Therefore, WTPi1 and WTPi2 are completely related. Under this assumption, tourists’ WTP is the interval value, so it is important to use the location-scale model of survival analysis and assume the distribution of the residual term. Therefore, Formula (7) can be further expressed as follows (Lawless, 2003; Alberini, 1995b):
${{T}_{i}}={{{x}'}_{i}}\times \beta +\sigma {{\varepsilon }_{i}}$
where Ti=lg(WTPi), β is the parameter vector; σ denotes the scale parameter and σ > 0; εi is the residual term and independent of ${{{x}'}_{i}}$. The distribution of the residual terms of the location-scale model includes the exponential distribution, the Weibull distribution, the log-normal distribution, the Gamma distribution, etc. Because the data of the double-bounded dichotomous assessment model is the interval value, we assume that the residual term of WTPi obeys the log-normal distribution. Therefore, the probability of WTPi can be obtained:
$\Pr \{\lg (WTP_{i}^{d})\le \lg (WT{{P}_{i}})\le \lg (WTP_{i}^{u})\}$
Furthermore, by multiplying and adding the probability density functions, the WTP function under the assumption of the log-normal distribution can be obtained:
$\text{lg }L=\sum\limits_{i=1}^{n}{\text{lg}\left\{ \varphi \left( \frac{T_{i}^{u}-{{{{x}'}}_{i}}\times \beta }{\sigma } \right)-\varphi \left( \frac{T_{i}^{d}-{{{{x}'}}_{i}}\times \beta }{\sigma } \right) \right\}}$
where $T_{i}^{u}$ is the upper limit of log(WTPi); $T_{i}^{d}$ is the lower limit of lg(WTPi); ϕ(•) denotes the cumulative distribution function under the standard normal distribution. According to Formula (10), the evaluation function can be obtained when ρ=1. Thus, tourists’ WTP of the non-use values of ecotourism resources can also be obtained.

2.2.3 Scenario design

In the actual evaluation process, a CVM hypothetical market was designed, and questionnaires with four scenarios were filled in by tourists. A pre-survey with 49 valid questionnaires was used to establish a reasonable range of quotes according to the amount of tourists’ WTP. Firstly, WTP responses were ranked from low to high; then, the 24th, 42nd, 60th and 78th percentiles were selected as the quotes for the main survey (Alberini, 1995b). The outcomes (yuan) were: for Option value: 50, 130, 300, and 500; for Existence value: 100, 150, 450, and 800; for Bequest value: 100, 250, 600, and 1300; for Altruism value: 50, 130, 300, and 500. The market design shows that the number of visitors to LINFP has been increasing in recent years, which inevitably influences local natural and human resources. It is assumed that a conservation trust can congregate social forces to manage the resources and environment of LINFP by self-funding, i.e., to maintain Option values, Existence values, Bequest values, and Altruistic values and promote the development of the ecotourism industry. Assuming that the conservation trust fund can achieve the above objectives, tourists’ WTP for non-use values can be presented sequentially according to the following four scenarios: would you like to donate (X) yuan yr-1 to maintain the (Y) value? (X = O, E, B, or A and Y = Option value, Existence value, Bequest value, or Altruism value, respectively). If the answer is “yes”, the amount will double to (2X) yuan yr-1; if “no”, the amount will be halved to (X/2) yuan yr-1.”

2.2.4 Statistical analysis

Tourists’ attitude items were taken from the literature review (Smith and Krannich, 1998; Cohen, 2002; Hearne and Santos, 2005; Spiteri and Nepal, 2006; Müller and Job, 2009; Choi et al., 2010). These items were in line with the findings of related studies (León et al., 2015; Tran, 2015; Sriarkarin and Lee, 2018; Lee et al., 2019). The answers to the questionnaire about tourists’ attitudes were based on a five-point Likert scale (1 = strongly disagree; 5 = strongly agree). These items were then analyzed by factor analysis to delineate the underlying dimensions of attitudes and obtain their factor scores. In this study, according to the Kaiser-Meyer-Olkin (KMO) test, the inspection value was 0.827. According to the Bartlett test, the x2 value was 2843.822, and the P-value was less than 0.001. The KMO inspection value was nearly 1, and the P-value was less than 0.1, indicating that this study was suitable for factor analysis. After factor analysis, cluster analysis was performed using the factor scores to segment the market of national forest parks based on delineated factors. Cluster analysis was conducted to identify the market segmentation and then introduce the segmented clusters into the valuation model of the non-use values of ecotourism resources, thus obtaining WTP among clusters.

2.3 Sampling methods and demographic statistics

In this study, face-to-face and random sampling interviews were conducted in LINFP based on the recommendations of the National Oceanic and Atmospheric Administration (NOAA) for the CVM. An open-ended approach was used for the pre-survey by asking the WTP for a certain amount, while a close-ended approach was used for the main survey, in which WTP was based on the 24th, 42nd, 60th and 78th percentiles of the WTP, which were selected from low to high in the pre-survey.
Respondents with a willingness to participate in the research were randomly selected. Only tourists who traveled independently were considered for interviews. To avoid the risk of quasi doubling a specific answer, in terms of family, only one person from each family completed the questionnaire; in terms of groups, we selected one or two group members who could represent the group and were willing to answer questionnaires. A questionnaire survey team of six interviewers conducted the questionnaire survey in different places in the area. Respondents were tourists with various tourism purposes and were not subdivided. The pre-survey was conducted on August 14, 2012, and the main survey was conducted from August 16 to August 19, 2012. Interviews were held from 10:00 am to 5:00 pm. Respondents were over 20 old. In the pre-survey, 45 valid questionnaires (all questions were answered according to requirements) were collected, and 5 invalid questionnaires (some questions were left unanswered) were discarded (90% response rate). In the main survey, a total of 590 valid questionnaires (all questions were answered according to requirements) were obtained after 630 questionnaires were distributed (93.6% response rate).
Regarding the socio-economic background of the interviewed tourists, there were 306 female respondents (51.9% of the total sample). Married interviewees (345 respondents, 58.5%) outnumbered unmarried ones (245 respondents, 41.5%). The twenties were the largest group (273 respondents, 46.3%), and the thirties were the second largest group (218 tourists, 36.9%). In terms of educational background, 274 interviewees had university degrees (46.5%), while 179 interviewees had schooling at the senior high school level (30.3%). Regarding occupation, 123 interviewees were students, representing the largest group (20.8%), while 117 interviewees were soldiers, civil servants and teachers, comprising the second group (19.8%), and 112 interviewees were freelancers, comprising the third group (19.0%). In terms of average personal income, 229 respondents reported earning 2000 to 4000 yuan per month (38.8%), comprising the largest group, and 220 respondents reported earning less than 20000 yuan per month (37.3%), comprising the second group. There were 202 respondents (34.2%) who previously participated in environmental groups, while 189 respondents (32.0%) came from Shandong Province, China.

3 Results

3.1 Factor analysis of tourists’ attitudes

According to the literature review, 15 original variables were set to the questionnaire to understand tourists’ attitudes (Table 1). In this study, factor analysis was used to extract the common factor of tourists’ attitudes, eigenvalues greater than 1 were retained, and then Varimax was used to make the variant structure of tourists’ attitudes obtain significant factor loadings (Hair et al., 2010). Cronbach’s α at least is greater than 0.5 and preferably greater than 0.7 (Nunnally, 1978). In this study, Cronbach’s α of tourists’ attitude factor compositions were all greater than 0.6, which was of the medium credibility, and the cumulative explained variance arrived at 59.244%.
Table 1 Factor analysis of dimension research of WTP for non-use values
Variables Factor loading Eigenvalue Cumulative explained variance (%) Cronbach’s α
Factor 1: Maintaining natural and cultural resources 2.787 18.577 0.759
1 Strengthen the concept of natural heritage preservation 0.772
2 Combine with the protection of historical and cultural sites 0.757
3 Protect flora and fauna resources 0.656
4 Learn cultural heritage knowledge 0.581
5 Contribute to the protection of natural ecosystems 0.572
6 Provide education and training programs for local communities 0.490
Factor 2: Promoting sustainable community development 2.168 14.454 0.727
7 Promote the communication of relevant stakeholders 0.773
8 Increase employment opportunities 0.748
9 Seek support from local residents 0.715
Factor 3: Reducing recreation impacts 2.087 13.911 0.732
10 Reduce waste 0.870
11 Reduce the mess from tourists 0.862
12 Reduce the crowding from visitors 0.514
Factor 4: Strengthening recreational control (Lee et al., 2019) 1.848 12.323 0.607
13 Limit recreational activities 0.780
14 Set recreational carrying capacity 0.704
15 Decrease the investment in mass tourism moderately 0.554
Total cumulative variance explained (%) 59.244

Note: The mean is derived from the agreement degree of visitors’ answers, using Likert measurement from “strongly agree = 5” to “strongly disagree = 1”.

According to the results of factor analysis, four tourists’ attitude factors were maintaining natural and cultural resources, promoting sustainable community development, reducing recreation impacts and strengthening recreational control (Table 1). The eigenvalue of Factor 1 was 2.787, followed by Factor 2. The result indicated that visitors to LINFP considered the development of ecotourism as a way to protect the natural and cultural resources and then as a way for communities to achieve sustainable development. Additionally, for ecotourism development, the impact of recreation, the waste in the park, and the mess and the crowding from tourists should be reduced. Finally, recreational carrying capacity should be set. Taking Liugong Island National Forest Park as an example, tourists believe that recreational activities and investment should be restricted in Liugong Island National Forest Park, which is related to the fact that the authorities only focus on increasing the investment in the development of mass tourism (for instance, the construction of cable cars and unnecessary tourist facilities such as LED screens). Therefore, for Liugong Island National Forest Park, the development and investment speeds of mass tourism should be slowed down, and recreational activities and the number of tourists should be restricted in the future.

3.2 Cluster analysis of tourists’ attitudes

Based on four tourists’ attitude factors extracted by factor analysis, non-hierarchical K-means cluster analysis was used to differentiate tourists. The results (Table 2) showed that these tourists with different attitudes could be significantly divided into three different groups: the first group of 71 people, accounting for 12.03% of the total, is called “the group concerning the environment”; the second group of 450 people, occupying 76.27%, is called “the group valuing pluralism”; the third group of 69 people, taking up 11.7%, is named “the group concerning resources”.
Table 2 Cluster analysis of tourists’ attitudes
Factors The group concerning the environment
(I) (n = 71)
The group valuing pluralism
(II) (n = 450)
The group concerning resources
(III) (n = 69)
F-value Scheffe tests
I-II I-III II-III
Maintaining the natural and cultural resources 3.74 4.82 4.48 461.4*** *** *** ***
Sustainable community development 3.60 4.51 3.64 85.6*** *** n/a ***
Reducing recreation impacts 4.17 4.82 3.24 445.3*** *** *** ***
Setting recreational carrying capacity 3.71 3.87 3.44 6.87*** n/a n/a ***

Note: *** means significance at the 1% level; n/a means not statistically significant.

Statistically significant differences were found between three clusters and four factors (F-value) (Table 2). Furthermore, Scheffe tests also showed a statistically significant difference among three clusters, except for group I and group II in the fourth factor and group I and group III in the second and fourth factors. The result means that visitors to LINFP can form an effective market segmentation according to their attitudes. Major populations in this study are the group valuing pluralism, which suggests that the majority of visitors have various tourists’ attitudes and pay close attention to the impact of tourism development on natural and cultural resources. The authorities should meet the different needs of tourists with different attitudes towards ecotourism and advocate correct ideas on ecotourism education, thereby developing sustainable ecotourism.

3.3 Frequency analysis of tourists’ WTP for non-use values in ecotourism resources

Double quotes were used to research tourists’ WTP for LINFP. The results (Table 3) showed that 590 visitors have a common recognition of four types of non-use values. Whether the quote is low or high, the number of tourists shows no significant difference for four value types in every group. However, tourists are highly concerned about the high price for any non-use value type. The number of tourists answering both “yes” (YY) decreases as the price increases except for the Bequest value. The number of tourists who answer “yes” in the first choice and “no” in the second choice (YN) has little difference with the increasing price. The number of tourists who answer “no” in the first choice and “yes” in the second choice (NY) also has little difference with the increasing price. The number of tourists answering both “no” (NN) increases with the increase in price. The result shows that people are generally concerned about the “high amount”. When the psychological pressure of tourists is released, they want to attach a higher value to ecotourism resources.
Table 3 Frequency distribution of tourists’ WTP for non-use values in ecotourism resources
Value type WTP (yuan yr-1) Number YY2 YN3 NY4 NN5
First quote Second quote
Option value 50 25/1001 173 66(38.2)6 26(15.0) 11(6.4) 70(40.5)
130 65/260 124 33(26.6) 20(16.1) 16(12.9) 55(44.4)
300 150/600 144 21(14.6) 23(15.9) 20(13.9) 80(55.6)
500 250/1000 149 13(8.7) 27(18.1) 14(9.4) 95(63.8)
Existence value 100 50/200 143 34(23.8) 25(17.5) 10(6.9) 74(51.8)
150 75/300 173 41(23.7) 28(16.2) 17(9.8) 87(50.3)
450 225/900 142 16(11.3) 22(15.5) 17(11.9) 87(61.3)
800 400/1600 132 12(9.1) 10(7.6) 23(17.4) 87(65.9)
Bequest value 100 50/200 142 40(28.2) 15(10.6) 7(4.9) 80(56.3)
250 125/500 153 31(20.3) 25(16.3) 12(7.8) 85(55.6)
600 300/1200 145 14(9.7) 28(19.3) 19(13.1) 84(57.9)
1300 650/2600 150 20(13.3) 16(10.7) 12(8.0) 102(68.0)
Altruistic value 50 25/100 155 43(27.7) 16(10.3) 13(8.4) 83(53.6)
130 65/260 155 41(26.5) 24(15.5) 10(6.5) 80(51.6)
300 150/600 145 26(17.9) 17(11.7) 24(16.6) 78(53.8)
500 250/1000 135 15(11.1) 10(7.4) 21(15.6) 89(65.9)

Note: 1. The second quote: if the tourist rejects the first quote, then the second quote will decrease (before the slash); conversely, the second quote will increase (after the slash). Unit: yuan. 2. YY = answer both “yes” in double quotes. 3. YN = answer “yes” in the first quote and “no” in the second quote. 4. NY = answer “no” in the first quote and “yes” in the second quote. 5. NN = answer both “no” in double quotes. 6. The number in the brackets represents the percentage of the number of this group in the total (frequency).

3.4 The significance of the factors affecting WTP

According to the principles and assumptions of the studies above, the empirical assessment model was designed as follows:
lnWTP1 = f (Age, Lnincome, M1, Clus1, OP, Group, f1)
lnWTP2 = f (Age, Lnincome, M1, Clus1, OP, Group, f2)
lnWTP3 = f (Age, Lnincome, M1, Clus1, OP, Group, f3)
lnWTP4 = f (Age, Lnincome, M1, Clus1, OP, Group, f4)
where lnWTP1, lnWTP2, lnWTP3 and lnWTP4 represent the WTP for Option value and Existence value, Bequest value and Altruistic value, respectively; Age is variable 1; Lnincome represents the attribute level of monthly income and is taken the logarithm; M1 denotes factor 1 (maintaining the natural and cultural resources); Clus1 represents the attribute level of groups with different attitudes, with 1 for “the group concerning the environment” and 0 otherwise; Op represents tourists who have visited other forest parks within a year, with “yes” being 1 and “no” being 0; Group represents tourists who have participated in environmental groups or have related activities, with “yes” being 1 and “no” being 0; f1, f2, f3 and f4 mean that tourists agree to establish Option Value Trust, Existence Value Trust, Bequest Value Trust and Altruistic Value Trust, respectively, with “yes” being 1 and “no” being 0.
For the seven variables, Age and Lnincome belong to socio-economic variables; M1, Clus1 and OP are tourists’ attitude variables; Group belongs to the environmental cognition variable; f1, f2, f3, and f4 are foundation recognition variables.
According to the Gamma probabilistic distribution model (Table 4), tourists who have participated in environmental groups or have related activities have higher WTP (P < 0.01), regardless of the form of non-use values. High-income tourists (variable Lnincome) have higher WTP for the Altruistic value (P < 0.05). Tourists who believe that the natural and cultural resources should be maintained for ecotourism development have higher WTP for the Option value or Existence value. Tourists who have visited other forest parks within a year have higher WTP for the Option value or Altruistic value (P < 0.01). Tourists with foundation recognition have higher WTP for the Existence value or Bequest value (P < 0.01).
Table 4 Significance of the factors affecting WTP
Variable category Variables Valuation coefficient
Option value Existence value Bequest value Altruistic value
Socio-economic variables Age 4.25E-04(0.01) 1.16E-01(1.57) 9.34E-02(0.88) 5.38E-02(0.55)
Lnincome 1.91E-01(1.55) 2.58E-01(1.80) 1.63E-02(0.09) 2.99E-01(1.96)**
Tourists’ attitude variables M1 4.51E-01(1.85)* 5.64E-01(2.51)*** 4.08E-01(1.41) 1.76E-01(0.61)
Clus1 1.41E-01(0.42) 4.14E-01(1.26) 3.65E-01(0.90) 2.65E-01(0.70)
OP 4.83E-01(3.49)*** 8.38E-02(0.66) 1.14E-01(0.66) 5.52E-01(3.54)***
Environmental cognition variable Group 4.99E-01(3.57)*** 5.66E-01(4.51)*** 4.16E-01(2.45)*** 5.59E-01(3.67)***
Foundation recognition variables f1/f2/f3/f4 1.12E-01(0.74) 3.27E-01(2.47)*** 4.09E-01(2.19)*** 1.80E-01(1.08)
Constant term 4.78(3.12) 4.36(2.79) 4.07(2.05) 6.68(3.66)
Scale 9.65E-01(11.83) 8.90E-01(14.2) 1.33(14.35) 1.05(15.06)
Log-likelihood -347.08 -311.92 -307.54 -314.79
Log-likelihood ratio 34.43*** 36.77*** 12.03* 28.52***

Note: 1. Data outside the brackets are probability distribution coefficients and data inside the brackets are t-test values. 2. ***, **, and * mean significance at 1%, 5%, and 10% levels. 3. Log-likelihood ratio = (-2) × (Restricted log-likelihood-log-likelihood). 4. x2(7,0.1) = 12.02; x2(7,0.05) = 14.07; x2 (7,0.01) = 18.48.

The Age variable is not significant statistically. The Group concerning the environment (variable Clus1) has no propensity. Thus, the Group fails to express a particular preference for any non-use values (not significant statistically).

3.5 The amount of WTP

According to the double-bounded dichotomous choice model, the upper and lower limits of WTP were first estimated at a 95% confidence interval, then the median was calculated (Cooper et al., 2002), and per capita Option value, Existence value, Bequest value, and Altruistic value were estimated for overall tourists and different groups.
As shown in Table 5, tourists’ WTP is highest for Bequest value, followed by Existence value or Altruistic value, and finally Option value. The result indicates that tourists attach more importance to the protection of ecotourism resources for their descendants but have less awareness about what to do with them in the future. Regarding different groups, the group valuing pluralism pays the highest for any non-use values, followed by the group concerning resources, and the lowest for the group concerning the environment. The finding indicates that the group valuing pluralism has the highest recognition of the non-use values of ecotourism resources.
Table 5 WTP of different groups for different non-use values
Non-use values Total (n = 590) The group concerning the environment (n = 71) The group valuing pluralism (n = 450) The group concerning resources (n = 69) F-value
Total mean 2113(2044-2181) 1929(1742-2118) 2161(2083-2242) 1978(1795-2160) 4.05**
Option value mean 371(358-383) 335(305-367) 379(365-394) 351(317-385) 3.13**
Existence value mean 466(451-481) 436(391-482) 475(458-493) 437(397-476) 2.25
Bequest value mean 894(866-922) 801(722-879) 918(886-950) 831(758-904) 4.93***
Altruistic value mean 382(369-395) 357(324-390) 389(374-405) 359(323-395) 2.01

Note: 1. Data inside the brackets represent capita WTP annually and a 95% confidence interval. The unit is yuan. 2. *** and ** mean significance at 1% and 5% levels, respectively.

4 Discussion

The four values evaluated in this study are only classical forms of non-use values. Although the values cannot represent the whole, they still can reveal the non-use values of ecotourism resources to a certain extent. Taking the sum of these values as the minimum measure, our presented evidence suggests that the non-use values of LINFP are 30 billion (about US$5 billion) per annum from the perspective of tourists’ attitudes, according to the total number of tourists in 2012 (1.42 million). Our estimate of the value of the park is inevitably influenced by four factors: firstly, respondents may be less willing to pay in real rather than hypothetical situations, a discount that was assessed at 15% in a survey of Korean tourists (Lee and Mjelde, 2007); secondly, attitudes are culturally dependent (Jia and Bao, 2008), but we did not record the cultural background of our respondents; thirdly, possibly due to cultural dependence, urban residents in Shandong Province show a positive bias towards WTP for an environmental issue because they need to seek social approval (Börger, 2013). Although such considerations diminish the accuracy of our estimate, the value of the park is substantial.
Tourist satisfaction is influenced by cognitive appraisals and affective experiences of different aspects of a tourist destination. In the case of Korean and Japanese tourists, the perceived quality of the scenery has been shown to significantly influence satisfaction (Jia and Bao, 2008). In turn, satisfaction drives WTP (Kafyri et al., 2012), and hence tourists are willing to bear the charges for access to the park resources. Unless the values that attract tourists to a park are protected, future tourism revenues may substantially diminish (Buultjens et al., 2005). Hence, park managers need to consider the factors that influence satisfaction (measured by WTP). However, since tourists are socioeconomically and culturally diverse (Ghazvini et al., 2020), managers should understand the different factors that influence tourists before rational allocation of funding priorities.
In terms of the non-use values of ecotourism resources, tourists’ WTP for Taiwan Taroko National Park is NT$ 4736 (about US$ 154.2) per person per year (Shen et al., 2013). According to the total number of tourists in 2012 (3.63 million), the minimum non-use value was NT$172 billion (about US$ 5.6 billion) for one year. The total area of LINFP is 3.15 km2, and that of Taroko National Park is 715782.18 ha. Although Taiwan Taroko National Park and LINFP differ greatly in area, the final estimate of non-use values is almost the same, possibly relevant to different forms of tourism resources. Tourism resources in Taiwan Taroko National Park were relatively single, mainly natural ecosystems, with few prehistoric sites. In addition to the natural ecosystem, Liugong Island National Forestry Park has historical relics of the Sino-Japanese naval battle. The tourism resources of Liugong Island National Forestry Park are highly unique, especially the history imprint in the minds of modern Chinese. Therefore, tourists’ WTP is higher.
The largest cluster of attitude-based tourists values pluralism. This attitude is expressed in factor analysis as valuing the participation of local communities, including the indigenous population, as full stakeholders in the tourist economy. For the indigenous, employment can lead to obvious financial benefits. Still, engagement with the tourist industry can yield cultural benefits to the indigenous community because employment as cultural interpreters can create an imperative to maintain and transmit cultural knowledge to younger generations and create opportunities to influence the management of culturally-significant sites within the park (Strickland-Munro and Moore, 2013). The cluster analysis has shown that the second most prevalent attitude concerns the environment, such as Hangzhou (Jia and Bao, 2008) and the Greek Islands (Kafyri et al., 2012). Tourists at LINFP value a hygienic environment and are willing to accept limitations on tourist numbers and/or activities, an attitude that may be motivated by a desire to protect the environment. A small proportion of the tourists concerning resources may benefit from on-site environmental education programs, but various modalities may need to be offered to engage such individuals (Kafyri et al., 2012).
In this study, the Bequest value is the dominant concern of tourists and reflects the desire to preserve the natural and cultural heritage of the park so that future generations can still witness the beauty of the park, rare flora and fauna resources, and historical sites. The high WTP for Altruistic values indicates that there is also a WTP to maintain the park for future generations. In other studies, high-income populations expressed significantly higher WTP to protect or restore environmental values (Wang and Jia, 2012; Börger, 2013). Our findings are consistent with those of the studies above. The Option value is significant. Tourists’ higher WTP is to ensure that the resources of the park are available for certain, but unspecified, future personal benefits.
Tourists’ WTP is not only influenced by their personal background but also by their value orientation. Jin et al. (2008) and Lee and Mjelde (2007) have found that respondents who are members of any environmental organization and who have a strong environmental affection (the environmental cognition group) show higher WTP, which is consistent with our findings on WTP. The environmental cognition group is most aware of the potential for tourism to adversely affect the environment and is most likely to support the establishment of a conservation trust fund to maintain the values of the park. This finding is consistent with other findings in different case studies globally (Lal, 2017; Sadikin et al., 2017; Ji et al., 2018; Aseres and Sira, 2020). Hence, on-site education to improve environmental cognition can reasonably be expected to increase WTP and support the establishment of a conservation trust fund.

5 Recommendations and limitations

To the best of our knowledge, no other study has examined the non-use values of ecotourism resources from the perspective of tourists’ attitudes. As for policy implications, the authorities can reconsider ecotourism development in the short term. 1) According to the results of this study, natural and cultural resources in the forest park should be maintained for developing ecotourism. Liugong Island is a small island with abundant natural resources such as rich flora and fauna resources and unique natural ecosystems. The island is the historical relics of the Sino-Japanese naval battle. Therefore, the authorities should decrease the investment in mass tourism, slow down its development speed and set up a carrying capacity control mechanism including restricting recreational activities and the number of tourists (Sriarkarin and Lee, 2018; Lee et al., 2019). In addition, the authorities should deepen the excavation of the cultural tourism resources of the Sino-Japanese naval war. 2) The authorities can address the preferences of different groups for market segmentation (Lin et al., 2020) in their future planning. For example, for the group concerning the environment, the authorities should keep the environment tidy and reduce waste. They can also schedule special tours with environmental education (Lee et al., 2019) for tourists to attain environmental knowledge. 3) Tourists with conservation backgrounds tend to pay more for the general non-use values. Therefore, the authorities can develop management strategies, such as establishing a conservation trust (Aseres and Sira, 2020), to improve environmental quality and integrate ecotourism development with natural and cultural resource conservation. 4) Tourists’ WTP is highest for Bequest value. Therefore, the authorities should attach great importance to the Bequest value of ecotourism resources and establish the concept of natural and cultural heritage preservation to ensure the sustainable development of ecotourism. 5) This analysis is relevant to national park managers and calls for all stakeholders to work together to protect the ecotourism resources of national forest parks and seek a balance between conservation and exploitation. The non-use values of ecotourism resources in LINFP are tremendous. This study reveals opportunities for policy-makers to mitigate negative impacts on ecotourism resources and bolster positive impacts.
The CVM is an effective tool based on hypothetical market situations to evaluate the values of environmental goods and services, but respondents’ real WTP still faces challenges. Moreover, CVM suffers from information biases, order biases, strategy biases, etc. (Wang, 2021). Hence, future research should focus on the validity and reliability of CVM. The choice experiment (CE) method is a superior evaluation method for establishing a multi-attribute utility function for natural resources and the environment and estimating the economic value of environmental resources and goods and services (Lee and Wang, 2017). This approach is increasingly used in environmental valuation, tourism, and recreation studies (Cong, 2019). It can solve the problem of profit and loss comparison between the multiple ecological attributes of the environment and resources (Wang, 2021). Deliberative monetary valuation (DMV) can reduce respondents’ protest responses and enable them to obtain more valuable information to form more rational preferences, thus improving the effectiveness of the evaluation results (Wang and Zhong, 2018). Therefore, future research also should consider CE and DMV.

6 Conclusions

Through the double-bounded dichotomous choice model of the CVM, this study confirms that the non-use values of ecotourism resources in LINFP are tremendous. Combined with the knowledge about the factors with positive influences on the WTP for the non-use values of ecotourism resources, this paper provides empirical support for enhancing protection awareness for ecotourism resources.
According to the results obtained by factor analysis, 15 original factors designed for the questionnaire could convert into four different independent factors, with the natural and cultural resource maintenance as the most important factor for tourists. Subsequently, ecotourism market segmentation was obtained by cluster analysis. Three groups with different ecotourism attitudes had obvious market segmentation, and they were the group concerning the environment, the group valuing pluralism and the group concerning resources. The major population was the group valuing pluralism. Tourists with conservation backgrounds tended to pay more for the general non-use values, while high-income tourists were willing to pay more for the Altruistic value. Tourists’ WTP was highest for the Bequest value, followed by the Existence value or Altruistic value, and the last was the Option value. The WTP of the group valuing pluralism was highest, followed by the group concerning resources, and that of the group concerning the environment was lowest.
It is worth assessing the non-use values of ecotourism resources, which play a crucial role in human well-being. The study results are paramount for making sensitive decisions and policies regarding ecotourism development.
Thanks to reviewers for their substantial and insightful comments, which improved the quality of the manuscript. Thanks to all participants who made this study possible.
[1]
Aabø S, Strand J. 2004. Public library valuation, nonuse values, and altruistic motivations. Library & Information Science Research, 26(3): 351-372.

[2]
Afroz R, Masud M M. 2011. Using a contingent valuation approach for improved solid waste management facility: Evidence from Kuala Lumpur, Malaysia. Waste Management, 31(4): 800-808.

[3]
Alberini A. 1995a. Optimal designs for discrete choice contingent valuation surveys: Single-bound, double-bound, and bivariate models. Journal of Environmental Economics and Management, 28(3): 287-306.

[4]
Alberini A. 1995b. Testing willingness-to-pay models of discrete choice contingent valuation survey data. Land Economics, 71(1): 83-95.

[5]
Amirnejad H, Khalilian S, Assareh M H, et al. 2006. Estimating the existence value of north forests of Iran by using a contingent valuation method. Ecological Economics, 58(4): 665-675.

[6]
Aseres S A, Sira R K. 2020. Estimating visitors’ willingness to pay for a conservation fund: Sustainable financing approach in protected areas in Ethiopia. Heliyon, 6(8): e04500. DOI: 10.1016/j.heliyon.2020.e04500.

[7]
Ballantyne R, Packer J, Hughes K. 2009. Tourists’ support for conservation messages and sustainable management practices in wildlife tourism experiences. Tourism Management, 30(5): 658-664.

[8]
Bamwesigye D, Hlavackova P, Sujova A, et al. 2020. Willingness to pay for forest existence value and sustainability. Sustainability, 12(3): 891. DOI: 10.3390/su12030891.

[9]
Bandara R, Tisdell C. 2003. Comparison of rural and urban attitudes to the conservation of Asian elephants in Sri Lanka: Empirical evidence. Biological Conservation, 110(3): 327-342.

[10]
Baral N, Gautam R, Timilsina N, et al. 2007. Conservation implications of contingent valuation of critically endangered white-rumped vulture Gyps bengalensis in South Asia. International Journal of Biodiversity Science & Management, 3(3): 145-156.

[11]
Bhat M Y, Sofi A A. 2021. Willingness to pay for biodiversity conservation in Dachigam National Park, India. Journal for Nature Conservation, 62: 126022. DOI: 10.1016/j.jnc.2021.126022.

[12]
Börger T. 2013. Keeping up appearances: Motivations for socially desirable responding in contingent valuation interviews. Ecological Economics, 87: 155-165.

[13]
Buultjens J, Ratnayake I, Gnanapala A, et al. 2005. Tourism and its implications for management in ruhuna National Park (yala), Sri Lanka. Tourism Management, 26(5): 733-742.

[14]
Cameron T A, Quiggin J. 1994. Estimation using contingent valuation data from a “dichotomous choice with follow-up” questionnaire. Journal of Environmental Economics and Management, 27(3): 218-234.

[15]
Cameron T A, Shaw W D, Ragland S E, et al. 1996. Using actual and contingent behavior data with differing levels of time aggregation to model recreation demand. Journal of Agricultural and Resource Economics, 21(1): 130-149.

[16]
Cardoso de Mendonça M J, Sachsida A, Loureiro P R A. 2003. A study on the valuing of biodiversity: The case of three endangered species in Brazil. Ecological Economics, 46(1): 9-18.

[17]
Carrier J G, MacLeod D V L. 2005. Bursting the bubble: The socio-cultural context of ecotourism. Journal of the Royal Anthropological Institute, 11(2): 315-334.

[18]
Cerda C, Losada T. 2013. Assessing the value of species: A case study on the willingness to pay for species protection in Chile. Environmental Monitoring and Assessment, 185(12): 10479-10493.

[19]
Chen W Y, Jim C Y. 2008. Cost-benefit analysis of the leisure value of urban greening in the new Chinese City of Zhuhai. Cities, 25(5): 298-309.

[20]
Chen B X, Qi X H. 2018. Protest response and contingent valuation of an urban forest park in Fuzhou City, China. Urban Forestry & Urban Greening, 29: 68-76.

[21]
Choi A S, Ritchie B W, Papandrea F, et al. 2010. Economic valuation of cultural heritage sites: A choice modeling approach. Tourism Management, 31(2): 213-220.

[22]
Cohen E. 2002. Authenticity, equity and sustainability in tourism. Journal of Sustainable Tourism, 10(4): 267-276.

[23]
Cong L, Zhang Y, Su C H, Chen M H, et al. 2019. Understanding tourists' willingness-to-pay for rural landscape improvement and preference heterogeneity. Sustainability, 11(24): 7001. DOI: 10.3390/su11247001.

[24]
Cooper J C, Hanemann M, Signorello G. 2002. One-and-one-half-bound dichotomous choice contingent valuation. Review of Economics and Statistics, 84(4): 742-750.

[25]
Deere N J. 2011. Exploitation or conservation? Can the hunting tourism industry in Africa be sustainable? Environment Science and Policy for Sustainable Development, 53(4): 20-32.

[26]
do Valle P O, Pintassilgo P, Matias A, et al. 2012. Tourist attitudes towards an accommodation tax earmarked for environmental protection: A survey in the Algarve. Tourism Management, 33(6): 1408-1416.

[27]
Farber S C, Costanza R, Wilson M A. 2002. Economic and ecological concepts for valuing ecosystem services. Ecological Economics, 41(3): 375-392.

[28]
Flower E K, Burns G L, Jones D N, et al. 2021. Does the experience make a difference? Comparing tourist attitudes pre- and post-visit towards the elephant tourism industry. Annals of Tourism Research Empirical Insights, 2(2): 100025. DOI: 10.1016/j.annale.2021.100025.

[29]
Forje G W, Tchamba M N, Eno-Nku M. 2021. Determinants of ecotourism development in and around protected areas: The case of Campo Ma’an National Park in Cameroon. Scientific African, 11: e00663. DOI: 10. 1016/j.sciaf.2020.e00663.

[30]
Gaglias A, Mirasgedis S, Tourkolias C, et al. 2016. Implementing the Contingent Valuation Method for supporting decision making in the waste management sector. Waste Management, 53: 237-244.

[31]
Ghazvini S A M, Timothy D J, Sarmento J. 2020. Environmental concerns and attitudes of tourists towards National Park uses and services. Journal of Outdoor Recreation and Tourism, 31: 100296. DOI: 10.1016/ j.jort.2020.100296.

[32]
Gössling S. 1999. Ecotourism: A means to safeguard biodiversity and ecosystem functions? Ecological Economics, 29(2): 303-320.

[33]
Hanemann M, Loomis J, Kanninen B. 1991. Statistical efficiency of double-bounded dichotomous choice contingent valuation. American Journal of Agricultural Economics, 73(4): 1255-1263.

[34]
Hair Jr J F, Black W C, Babin B J, et al. 2010. Multivariate data analysis:A global perspective(7th Edition). New York, USA: Pearson Education.

[35]
Halkos G, Leonti A, Sardianou E. 2020. Assessing the preservation of Parks and natural protected areas: A review of contingent valuation studies. Sustainability, 12(11): 4784. DOI: 10.3390/su12114784.

[36]
Hearne R R, Santos C A. 2005. Tourists’ and locals’ preferences toward ecotourism development in the Maya Biosphere Reserve, Guatemala. Environment, Development and Sustainability, 7(3): 303-318.

[37]
Hedlund T. 2011. The impact of values, environmental concern, and willingness to accept economic sacrifices to protect the environment on tourists’ intentions to buy ecologically sustainable tourism alternatives. Tourism and Hospitality Research, 11(4): 278-288.

[38]
Herrera-Silveira J A, Cebrian J, Hauxwell J, et al. 2010. Evidence of negative impacts of ecological tourism on turtlegrass (Thalassia testudinum) beds in a marine protected area of the Mexican Caribbean. Aquatic Ecology, 44(1): 23-31.

[39]
Jala, Nandagiri L. 2015. Evaluation of economic value of Pilikula Lake using travel cost and contingent valuation methods. Aquatic Procedia, 4: 1315-1321.

[40]
Ji S Y, Choi Y, Lee C K, et al. 2018. Comparing willingness-to-pay between residents and non-residents using a contingent valuation method: Case of the Grand Canal in China. Asia Pacific Journal of Tourism Research, 23(1): 79-91.

[41]
Jia J B. 2011. Conservation biology. Beijing, China: Higher Education Press. (in Chinese)

[42]
Jia Y Q, Bao G M. 2008. The effect of nationality on the multidimensionality of tourist destination image: A case of Hangzhou. 2008 International Workshop on Education Technology and Training & 2008 International Workshop on Geoscience and Remote Sensing. Shanghai, China: IEEE.

[43]
Jin J J, Wang Z S, Liu X M. 2008. Valuing black-faced spoonbill conservation in Macao: A policy and contingent valuation study. Ecological Economics, 68(1-2): 328-335.

[44]
Kafyri A, Hovardas T, Poirazidis K. 2012. Determinants of visitor pro-environmental intentions on two small Greek Islands: Is ecotourism possible at coastal protected areas? Environmental Management, 50(1): 64-76.

[45]
Kim A K, Weiler B. 2013. Visitors’ attitudes towards responsible fossil collecting behaviour: An environmental attitude-based segmentation approach. Tourism Management, 36: 602-612.

[46]
Kotchen M J, Reiling S D. 2000. Environmental attitudes, motivations, and contingent valuation of nonuse values: A case study involving endangered species. Ecological Economics, 32(1): 93-107.

[47]
Lal P, Wolde B, Masozera M, et al. 2017. Valuing visitor services and access to protected areas: The case of Nyungwe National Park in Rwanda. Tourism Management, 61: 141-151.

[48]
Lawless J F. 2003. Statistical Models and Methods for Lifetime Data. Hoboken, USA: John Wiley & Sons Inc..

[49]
Lee C H, Chen Y J, Huang Y S, et al. 2019. Incorporating integrative perspectives into impact reduction management in a reef recreation area. Water, 12(1): 111. DOI: 10.3390/w12010111.

[50]
Lee C H, Wang C H. 2017. Estimating residents’ preferences of land use program surrounding forest park, Taiwan. Sustainability, 9(4): 598. DOI: 10.3390/su9040598.

[51]
Lee C K, Han S Y. 2002. Estimating the use and preservation values of national parks’ tourism resources using a contingent valuation method. Tourism Management, 23(5): 531-540.

[52]
Lee C K, W Mjelde J. 2007. Valuation of ecotourism resources using a contingent valuation method: The case of the Korean DMZ. Ecological Economics, 63(2-3): 511-520.

[53]
León C J, Araña J E, et al. 2015. Tourists’ preferences for congestion, residents’ welfare and the ecosystems in a national park. Ecological Economics, 118: 21-29.

[54]
Lin Y H, Hong C F, Lee C H, et al. 2020. Integrating multiple perspectives into an ecotourism marketing strategy in a marine national park. Asia Pacific Journal of Tourism Research, 25(9): 948-966.

[55]
Liugong Island Administrative Office, 2021. www.Liugong Island. com.cn. Viewed on 27 January 2021.

[56]
Lo A Y, Jim C Y. 2010. Willingness of residents to pay and motives for conservation of urban green spaces in the compact city of Hong Kong. Urban Forestry & Urban Greening, 9(2): 113-120.

[57]
Lockwood M, Tracy K. 1995. Nonmarket economic valuation of an urban recreation park. Journal of Leisure Research, 27(2): 155-167.

[58]
Müller M, Job H. 2009. Managing natural disturbance in protected areas: Tourists’ attitude towards the bark beetle in a German National Park. Biological Conservation, 142(2): 375-383.

[59]
Nunnally J C. 1978. Psychometric theory (2nd edition). New York, USA: McGraw-Hill.

[60]
Nuva R, Shamsudin M N, Radam A, et al. 2009. Willingness to pay towards the conservation of ecotourism resources at Gunung Gede Pangrango National Park, west Java, Indonesia. Journal of Sustainable Development, 2(2): 173-186.

[61]
O’Connor E, Hynes S, Chen W T. 2020. Estimating the non-market benefit value of deep-sea ecosystem restoration: Evidence from a contingent valuation study of the Dohrn Canyon in the Bay of Naples. Journal of Environmental Management, 275: 111180. DOI: 10.1016/j.jenvman.2020.111180.

[62]
Petrosillo I, Zurlini G, Corlianò M E, et al. 2007. Tourist perception of recreational environment and management in a marine protected area. Landscape and Urban Planning, 79(1): 29-37.

[63]
Rajapaksa D, Islam M, Managi S. 2018. Pro-environmental behavior: The role of public perception in infrastructure and the social factors for sustainable development. Sustainability, 10(4): 937. DOI: 10.3390/su10040937.

[64]
Reihanian A, Mahmood N Z B, Kahrom E, et al. 2012. Sustainable tourism development strategy by SWOT analysis: Boujagh National Park, Iran. Tourism Management Perspectives, 4: 223-228.

[65]
Rodella I, Madau F A, Carboni D. 2020. The willingness to pay for beach scenery and its preservation in Italy. Sustainability, 12(4): 1604. DOI: 10.3390/su12041604.

[66]
Sadikin P N, Mulatsih S, Pramudya B, et al. 2017. Analysis of willingness to pay on ecotourism in Mount Rinjani National Park. Journal of Analisis Kebijakan Kehutanan, 14(1): 31-46.

[67]
Shen H L, Lee C H, Zhang B, et al. 2013. Study on non-use values of ecotourism resources of Taiwan Taroko National Park. Journal of Anhui Agriculture Science, 41(5): 2104-2109. (in Chinese)

[68]
Shrestha R K, Stein T V, Clark J. 2007. Valuing nature-based recreation in public natural areas of the Apalachicola River region, Florida. Journal of Environmental Management, 85(4): 977-985.

[69]
Smith M D, Krannich R S. 1998. Tourism dependence and resident attitudes. Annals of Tourism Research, 25(4): 783-802.

[70]
Spiteri A, Nepal S. 2006. Incentive-based conservation programs in developing countries: A review of some key issues and suggestions for improvements. Environmental Management, 37(1): 1-14.

[71]
Sriarkarin S, Lee C H. 2018. Integrating multiple attributes for sustainable development in a national park. Tourism Management Perspectives, 28: 113-125.

[72]
Strickland-Munro J, Moore S. 2013. Indigenous involvement and benefits from tourism in protected areas: A study of Purnululu National Park and Warmun Community, Australia. Journal of Sustainable Tourism, 21(1): 26-41.

[73]
Thapa S, Wang L H, Koirala A, et al. 2020. Valuation of ecosystem services from an important wetland of Nepal: A study from begnas watershed system. Wetlands, 40(5): 1071-1083.

[74]
Tian S G, Peng C. 2019. The problems and measures of forest fire prevention in Liugong Island National Forest Park. Agricultural Catastrophology, 9(6): 101-102. (in Chinese)

[75]
Tran D T T, Nomura H, Yabe M. 2015. Tourists’ preferences toward ecotourism development and sustainable biodiversity conservation in protected areas of Vietnam—The case of Phu My Protected Area. Journal of Agricultural Science, 7(8): 81-89.

[76]
Wang P W. 2021. Study on the value of ecotourism resources in nature reserve. Shanghai, China: Shanghai Jiao Tong University Press. (in Chinese)

[77]
Wang P W, Jia J B. 2012. Tourists’ willingness to pay for biodiversity conservation and environment protection, Dalai Lake protected area: Implications for entrance fee and sustainable management. Ocean & Coastal Management, 62: 24-33.

[78]
Wang P W, Zhong L S. 2018. Application of deliberative monetary valuation in ecosystem value evaluation and inspirations. Acta Ecologica Sinica, 38(15): 5279-5286. (in Chinese)

[79]
Wang Y, Zhang Y S. 2009. Air quality assessment by contingent valuation in Ji’nan, China. Journal of Environmental Management, 90(2): 1022-1029.

[80]
Wilson J J, Lantz V A, MacLean D A. 2010. A benefit-cost analysis of establishing protected natural areas in New Brunswick, Canada. Forest Policy and Economics, 12(2): 94-103.

[81]
World Tourism Organization. 2002. World ecotourism summit final report. Madrid, Spain:World Tourism Organization and the United Nations Environment Program. https://www.goodreads.com/book/show/9468500.

[82]
UNWTO(World Tourism Organization). 2017. UNWTO tourism highlights. Madrid, Spain: UNWTO. DOI: 10.18111/9789284419029.

[83]
Yip W, Subramanian S V, Mitchell A D, et al. 2007. Does social capital enhance health and well-being? Evidence from rural China. Social Science & Medicine, 64(1): 35-49.

[84]
Zambrano-Monserrate M A. 2020. The economic value of the Andean Condor: The national symbol of South America. Journal for Nature Conservation, 54(6389): 125796. DOI: 10.1016/j.jnc.2020.125796.

[85]
Zong C, Cheng K, Lee C H, et al. 2017. Capturing tourists’ preferences for the management of community-based ecotourism in a forest park. Sustainability, 9(9): 1673. DOI: 10.3390/su9091673.

Outlines

/