Tourism Resources and Ecotourism

The Associations of Green Spaces with Older Adults’ Mental Health in Perspective of Spatiality, Sociality and Historicality

  • YUE Yafei , 1, 2 ,
  • YANG Dongfeng , 1, * ,
  • XU Dan 3
Expand
  • 1. Department of Urban Planning, School of Architecture and Fine Art, Dalian University of Technology, Dalian, Liaoning 116024, China
  • 2. Department of Movement and Sports Sciences, Faculty of Medicine and Health Sciences, Ghent University, Ghent 9000, Belgium
  • 3. Design Institute of Civil Engineering and Architecture of Dalian University of Technology Co., LTD., Dalian, Liaoning 116024, China
*YANG Dongfeng, E-mail:

YUE Yafei, E-mail:

Received date: 2022-03-14

  Accepted date: 2022-06-25

  Online published: 2023-02-21

Supported by

The National Natural Science Foundation of China(52078095)

The National Natural Science Foundation of China(51638003)

The China Scholarship Council(202006060186)

Abstract

The theory of health fairness requires that improving the benefits of green spaces on health should take into account the characteristics of vulnerable groups such as older adults. Until now, the comprehensive associations of green spaces metrics with older adults’ mental health are unclear in China. This study aimed to systematically assess their associations from the perspective of spatiality, sociality and historicality. Data of 879 respondents aged 60 or older in Dalian, China were used, and multilevel linear models were conducted in HLM6.08. Results indicated that in the spatial dimension, green spaces metrics derived from overhead view had a stronger association with older adults’ mental health than from street view. The park with gentle slopes and irregular boundaries was more positively related to older adults’ mental health. In the social dimension, green spaces could adjust and buffer the negative effects of socio-demographic characteristics such as having no homeownership. In the historical dimension, green spaces had a lasting effect on older adults’ mental health, especially for the group of middle income. Our findings confirm the necessity of multidimensional assessments for green spaces to examine associations with older adults’ mental health in Chinese settings. The results can provide empirical evidence for realizing fairer allocation of urban green spaces resources taking into account individual differences.

Cite this article

YUE Yafei , YANG Dongfeng , XU Dan . The Associations of Green Spaces with Older Adults’ Mental Health in Perspective of Spatiality, Sociality and Historicality[J]. Journal of Resources and Ecology, 2023 , 14(2) : 299 -308 . DOI: 10.5814/j.issn.1674-764x.2023.02.008

1 Introduction

In the assessment by the World Health Organization (WHO) of China’s aging and health, it was expected that China’s aging population would reach around 30% by 2050. The primary psychological health problems that caused the burden of disease for older adults in China were depression, suicide and Alzheimer which was up to 5.3 million disability-adjusted life years (WHO, 2016). Previous studies have shown that green spaces can relieve stress, restore concentration, improve cognitive ability, regulate negative psychological states such as anger, anxiety and depression, and reduce mental disorders (Markevych et al., 2017; Sarkar et al., 2018; Liu et al., 2019; Zhang et al., 2020b). So, in the context of increasing urban aging and the escalation of mental health problems in older adults, trying to realize the full health benefits of urban green spaces is an active exploration of the construction of an age-friendly City.
Urban green spaces include urban parks, natural reserves, waterfront green covers, walking greenways, etc. Most studies explored the associations of space characteristics (e.g., area and shape), accessibility (e.g., spatial distance and network distance), and activities in green space (e.g., type and frequency) with residents’ psychological status by experimental design and self-reporting methods based on the theory of stress relief proposed by Roger Ulrich and the theory of attention recovery proposed by Stephen Kaplan (Annerstedt et al., 2012; Gascon et al., 2015; Fong et al., 2018; Sarkar et al., 2018). The current studies that explored the associations of green spaces with older adults’ mental health mainly focused on the identification of key characteristics and positive or negative correlations, while there are still limitations in the selection of indicators and research dimensions.
At the level of indicators, green spaces metrics were mostly measured by objective quantification from overhead view (e.g., vegetation cover rate) or subjective perception from the questionnaires, which lacks characteristics description from streetscape view. The subjective uncertainty will cause assessment bias and affect the accuracy of the results to some extent (Yang and Yang, 2020). At present, the Normalized Difference Vegetation Index (NDVI) and vegetation cover rate are usually selected as green spaces indicators to be applied to related researches, which can be extracted from remote sensing images. However, the remote sensing data only describe the characteristics of green spaces from the overhead view. The characteristics from the streetscape view, which are more closely related to older adults’ psychological perception, have rarely been used in relevant studies (Larkin and Hystad, 2019; Helbich et al., 2019).
At the level of research dimensions, previous studies mainly focused on green spaces’ scopes and scales, ignoring the inherent roles of older adults’ socio-demographics and the verification of the green spaces’ effects on health in multitemporal dimensions. In addition, most studies were concentrated in Western countries. While, the associations of urban environments with health were significantly heterogeneous among different countries and regions (Yang et al., 2019). Under the dual influence of the urban spatial structure dominated by motorized traffic systems and the humanistic background with significant collectivism, the specific relationships of urban green spaces with older adults’ mental health in China are still unclear.
Promoting social justice is the core value of urban planning. Justice theory and the theory of health fairness also require the urban environment, especially green spaces, to create equal health opportunities for different population groups, taking into account individual needs, choices, and values (Burton et al., 2011), to minimize geographic health inequalities. The trend towards justice requires the identification of the excluded and disadvantaged older adults and their inclusion in planning and decision-making processes (Steptoe et al., 2015). Through the establishment of a green spaces metrics system and the exploration of associations with older adults’ mental health, we hope planning and construction of the urban green spaces to be closer to justice.
In light of limitations in the selection of indicators and research dimensions, a space-society-history multidimensional research framework on the health benefits of urban green spaces was constructed based on the dialectical methodology of justice theory (Fig. 1). The interaction of space, history and society also corresponded to the traditional “pattern-process-mechanism” methodology of geography. In a case study in Dalian, we selected an objective quantitative indicators system containing street view green spaces rate, and compared associations with older adults’ mental health among different green spaces measures, taking into account the socio-demographics and the dynamic characteristics of green spaces in historical periods. In three dimensions, we used typical characteristics to analyze the associations of urban green spaces with older adults’ mental health, and tested the peak and valley of the mental health under the effects of different element combinations, to provide empirical evidence for achieving health equity in urban green spaces.
Fig. 1 Mental health benefits of green spaces metrics on older adults in perspective of spatiality, sociality, historicality

2 Materials and methods

2.1 Study area

This is an observational study, conducted in residential areas in Dalian, China, from May to October 2019. The recruitment procedure of respondents was based on a two-stage stratified sampling design. In the first stage, 7-12 residential areas were randomly selected from each category of commercial housing communities, historic districts, Danwei communities, welfare housing communities, urban villages, and suburban areas, with a total of 61 residential areas (neighborhoods) selected finally. Then, in each residential area, 12-18 older adults over 60 were randomly selected as respondents. In total, 900 older adults participated in the study. Each respondent met the requirement for living at the current address for more than 1 year. Residential areas range from 0.03 to 1.12 km2 (0.28 km2; SD±0.24). After data cleaning (e.g., deleting incomplete surveys), 879 respondents with valid data were included in further data analyses (Fig. 2).
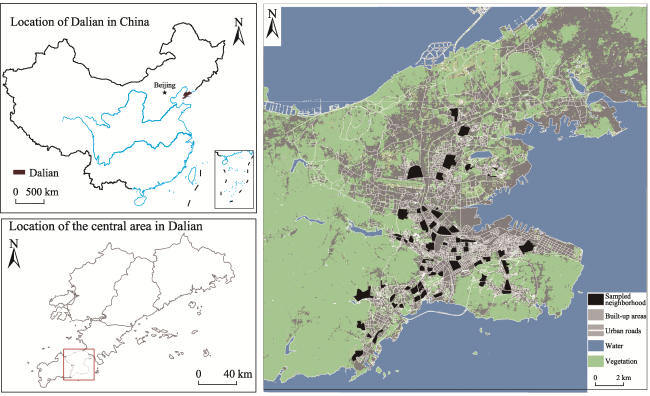
Fig. 2 Location of the study area and interviewed residential areas
Through detailed individual interviews, respondents’ mental health and socio-demographics were investigated. The mental health assessment in this study adopted WHO psychological health five items (Chinese version), including happiness, comfort, tranquility, relaxation, and subjective well-being (Burton et al., 2011; Topp et al., 2015), which were respectively scored by Richter six-point scale. The sum ranged from 0 to 25, indicating the individual mental health level was from low to high. Socio-demographic characteristics can affect residents’ mental health (Gascon et al., 2015), so multiple covariates data on an individual level were obtained through the questionnaire. We controlled for the factors suggested by previous studies, including age, gender, educational level, pre-retirement occupation, monthly income level, number of co-occupants, homeownership, and number of years living at the current address (Steptoe et al., 2015).

2.2 Green spaces metrics

Combined with previous studies, we selected exposure metrics, attractiveness and spatial distribution as the characteristics of green spaces (Dong et al., 2020; Gan et al., 2020; Wang and Yang, 2020). Spatial exposure metrics reflected equity of process and result, involving availability (NDVI and vegetation cover rate), visibility (streetscape green spaces rate), and accessibility. Park’s characteristics (type, area, slope, and plant diversity) reflect the attraction for using the park in older adults. The spatial distribution characteristics of parks were calculated quantitatively by Landscape Pattern Index (LPI).
Multiple green spaces characteristics were derived for each neighborhood. They were calculated for each neighborhood separately by averaging the scores for all sampling points within a 300 m circular buffer around the centroid of each study residential area. The buffer size was set based on the literature studying environmental influences on older adults’ well-being and related behaviors (Burton et al., 2011; Annerstedt et al., 2012; Helbich et al., 2019). Each of these measures is described in more detail below.
Table 1 describes the calculation methods and data sources of green spaces characteristics. The Landsat-8 remote sensing image we used was taken on December 27, 2019, and its cloud and humidity met the requirements. The vegetation cover rate was extracted from the Global 30-m land-cover classification with a fine classification system in 2020 (GLC_FCS30-2020) which was divided into 30 categories in detail (Zhang et al., 2021). The calculation method of NDVI was described detailed in Tucker’s (1979) study. Information on the location and shape of various parks in Dalian was provided by the department of urban planning. We calculated the LPI of the park in different dimensions: area (average patch size), density (patch density), shape (shape index, perimeter to area ratio), diversity (landscape abundance), aggregation and dispersion (degree of aggregation and segmentation), proximity (degree of proximity), etc. by Fragstats. According to the geographic location of Dalian, all kinds of data were corrected to the unified projected coordinate system (WGS_1984_UTM_Zone_51N) in ArcGIS.
Table 1 Design and calculation methods of green spaces metrics
Characteristics Calculation method Data name
Availability NDVI Extracted from remote sensing images by software ENVI Landsat-8 images
Vegetation cover rate Extracted from globe land cover data by software ArcGIS GLC_FCS30-2020
Visuality Streetscape green spaces rate Extracted from Tencent Street View data by a fully convolutional neural network Tencent Street View data
Accessibility Distance to park Calculating the spatial networks distance to the latest park by software ArcGIS Park distribution data in Dalian
Park attraction Total number Calculating the total number of parks in the residential buffer zone by software ArcGIS Park distribution data in Dalian
Number of types Calculating the type number of parks in the residential buffer zone by software ArcGIS Park distribution data in Dalian
Area Calculating the area of parks in the residential buffer zone by software ArcGIS Park distribution data in Dalian
Slope Calculating the average slope of parks in the residential buffer zone by software ArcGIS Digital Elevation Model data
Plant diversity Calculating the average number of plant species in the park in the residential buffer zone by software ArcGIS GLC_FCS30-2020 and Park distribution data in Dalian
Special distribution of parks Landscape Pattern Indexes Calculating 10 typical LPI in area, density, shape, diversity, aggregation, proximity, etc. dimensions by software Fragstats Park distribution data in Dalian
In the historical dimension, we used the characteristics of green spaces in consecutive years to explore the associations with older adults’ mental health, to make up for the shortcomings of the cross-sectional data. We selected remote sensing images from 2010 to 2019, and NDVI was used as the proxy for green spaces characteristics. NDVI in different years was regressed with the mental health in 2019 respectively, and the effectiveness of the independent variables was judged according to the significance in the regression model. If the non-2019 NDVI was still significant in the regression model, it indicated that green spaces in that year still had an association with mental health in 2019 which showed continuity (Zhang et al., 2020a).

2.3 Streetscape green spaces rate

A machine learning approach was implemented to extract streetscape green spaces from the downloaded images. We applied a semantic segmentation technique to circumvent the limitations of pixel-wise classifications using an image’s additive colors (e.g., natural and manmade green objects are not discriminable) (Long et al., 2015; Larkin and Hystad, 2019). As deep learning performed well for pattern recognition tasks (Rawat and Wang, 2017), we used a fully convolutional neural network for semantic segmentation (i.e., the FCN-8s) (Long et al., 2015) to segment the street view images into common ground objects (e.g., river, tree). Figure 3 illustrates FCN-8s network structure. For a technical detailed description, see Long et al. (2015), Rawat and Wang (2017).
The workflow of street view image segmentation by a fully convolutional neural network is summarized. To train the network, we used a collection of annotated images from the ADE20K scene parsing and segmentation database (Zhou et al., 2017). ADE20K consists of a large number of annotated object categories (e.g., tree, car). After obtaining the image segmentation by feeding the street view images into the trained network, the proportion of green spaces (e.g., trees, grass, plants, palm trees) was determined.
Sampling points were extracted with an interval of 50 m on roads covering the street view image in the main urban area of Dalian. Streetscape green spaces rate per sampling point represents the rate of the sum of green space pixels on images in the four cardinal directions (90°, 180°, 270°, 360°) to the sum of all pixels on images in the four cardinal directions (Dong et al., 2018). Finally, the averages per 300 m circular buffers around the centroid of each study residential area were determined (Li and Ghosh, 2018) and attached to the survey data.
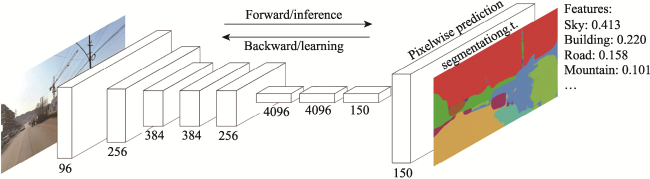
Fig. 3 Architecture of the fully convolutional network (adopted from Long et al., 2015)

Note: The attached numbers refer to a layer’s convolution kernel size.

2.4 Statistical analyses

We estimated the associations of green spaces metrics with mental health using multilevel linear models. Since ordinary single-level regressions treat the health outcomes of respondents as independent observations and ignore the bias of hierarchical structure in models, it will overestimate the statistical significance (Goldstein, 2011). We constructed multilevel linear models and set the null model, the random coefficient model (the independent variables only contained socio-demographic characteristics), the intercept model (the independent variables only contained the green spaces metrics), and the full model which contained the interaction respectively in software HLM6.08Trial. The full model was specified as follows:
$M{{H}_{ih}}={{\gamma }_{00}}+{{\gamma }_{0h}}\times V+{{\gamma }_{i0}}\times P+{{\gamma }_{ih}}\times V\times P+{{\mu }_{h}}+r$
where MHih is the older adults’ mental health; i represents the individual level; h represents the neighborhood level; γ00 is the overall intercept; V represents the green spaces metrics in the neighborhood; γ0h represents the regression coefficient between the dependent variable and the explanatory variables at the neighborhood level; P represents individual socio-demographic characteristics; γi0 represents the regression coefficient between the dependent variable and the explanatory variables at the individual level; $V\times P~$ represents the interaction between the green spaces metrics and the individual socio-demographic characteristics; γih represents the regression coefficient of the interaction. r and μh represent random error terms at the individual level and neighborhood level respectively.

3 Results

3.1 Description of socio-demographic characteristics

Table 2 shows the individual socio-demographic characteristics. Slightly more females than males participated in the study and the average age was 73.2 years. 34.7% of the respondents had a high school education or higher. 27.5% of the participants had a monthly income of 2000-3000 yuan. In total, 61.8% of the respondents had been living at their current address for more than 10 years. The average mental health score of the 879 respondents was 15.64 and the standard deviation was 4.02. Cronbach’s Alpha value was 0.862 (≥0.700), which means that these five items have good reliability.
Table 2 Description of socio-demographic characteristics
Variable Levels N Percentage (%) Variable Levels N Percentage (%)
Age 60-70 394 44.8 Number of co-occupants 1 116 13.2
71-80 293 33.3 2 388 44.1
> 81 192 21.8 3 and more 375 42.7
Gender Male 406 46.2 Monthly income level (yuan) 0-1000 116 13.2
Female 473 53.8 1001-2000 63 7.2
Pre-retirement
occupation
Intellectual work 314 35.7 2001-3000 242 27.5
Manual work 505 57.5 3001-4000 242 27.5
Other 60 6.8 >4000 216 24.6
Education level Homeownership Own 571 65.0
Primary school or lower 300 34.1 Kinsfolks 261 29.7
Middle school 274 31.2 Others 47 5.3
High school 192 21.8 Number of years living at the current address 0-4 169 19.2
College/university 113 12.9 5-10 167 19.0
> 10 543 61.8

3.2 Description of green spaces metrics

Table 3 shows the characteristics of green spaces in neighbor hood buffers. The standard deviation of vegetation cover rate was 0.119, a large difference in greenness level between neighborhoods. The average NDVI score was 0.073 (SD± 0.015), while the streetscape green spaces rate was 0.183 (SD±0.073). The average number of parks in the buffers was 2.02, showing that respondents had good access to parks in their daily life. Figure 4 shows the various metrics of green spaces.
Table 3 Description of green spaces metrics
Characteristics Min Max Mean Standard deviation
Availability NDVI 0.043 0.110 0.073 0.015
Vegetation cover rate 0.002 0.614 0.116 0.119
Visuality Streetscape green spaces rate 0.059 0.457 0.183 0.073
Accessibility Distance to park (m) 0.000 1189.782 295.049 244.775
Park attraction Total number (number) 0.000 8.000 2.020 2.061
Number of types (number) 0.000 3.000 1.130 0.763
Area (m2) 0.000 98633.000 14039.260 17834.518
Slope (degree) 0.000 20.000 6.550 4.927
Plant diversity (number) 0.000 5.000 1.030 1.268
Special distribution of parks Average patch size (ha) 0.000 11.340 0.816 2.289
Average perimeter-area ratio 0.000 1333.333 226.188 403.214
Average proximity index 0.000 23.200 0.533 2.988
Degree of aggregation (%) 0.000 100.000 19.980 35.222
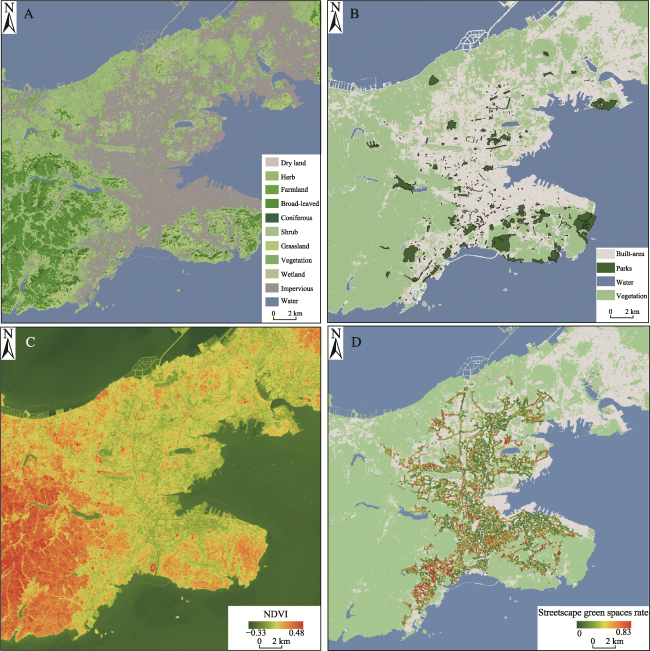
Fig. 4 Green spaces metrics in Dalian: (A) GLC_FCS30-2020 (B) Parks distribution in Dalian (C) NDVI (D) Streetscape green spaces rate

3.3 Multilevel linear models

The Variance Inflation Factor (VIF) of the model was 1.52 (less than 3) implying that the multicollinearity between explanatory variables was acceptable. The Intra-class Correlation Coefficient (ICC) was 0.169 in the null model showing that the clustering of individuals in the residential area accounted for 16.9% of the total variance of mental health scores. This confirmed the necessity of using multi level models rather than single-level models (Liu et al., 2019). The neighborhood environmental variables were standardized in models due to the different magnitudes in their scores. Table 4 shows the coefficients and standard errors. The full model including individual socio-demographics (individuals), residential green spaces metrics (neighborhoods) and their interaction terms had the lowest Akaike Information Criterion (AIC) score which showed the highest model fit.
Table 4 The results of multilevel linear models
Variable Null model Random-coefficient models Intercept Model Full Model
Coef. (S.E.) Coef. (S.E.) Coef. (S.E.) Coef. (S.E.)
Fixed effects
Socio-demographic characteristics (individual level)
Age 0.126***(0.041) 0.117***(0.039)
Number of years living at the current address -0.096*(0.043) -0.106**(0.043)
Homeownership (ref: not own) 0.135**(0.074) 0.161**(0.075)
Number of co-occupants (ref: single)
Living with another person 0.091(0.032) 0.087(0.032)
Living with two or more other people 0.293***(0.095) 0.266***(0.093)
Green spaces metrics (neighborhood level)
NDVI 0.304***(0.093) 0.307***(0.094)
Vegetation cover rate 0.181**(0.074) 0.173**(0.073)
Streetscape green spaces rate 0.095*(0.060) 0.094*(0.060)
Distance to park 0.057(0.060) 0.052(0.060)
Total number 0.089(0.074) 0.078(0.072)
Slope -0.205***(0.066) -0.128**(0.054)
Plant diversity 0.089(0.070) 0.073(0.070)
Perimeter to area ratio 0.192***(0.051) 0.195***(0.048)
Degree of aggregation -0.111**(0.053) -0.112**(0.053)
Interaction term
Age×NDVI -0.131**(0.053)
Homeownership×NDVI -0.090*(0.059)
Constant -0.139***(0.065) -0.303***(0.101) -0.154***(0.054) -0.323***(0.100)
Random effects
ICC 16.87% 16.78% 10.41% 9.98%
Var (Neighborhood-level constant) 0.172 0.168 0.099 0.092
Var (Individual level) 0.848 0.833 0.852 0.829
AIC 2146.033 2137.124 2145.544 2132.525

Note: *, ** and *** indicate the significance at 0.1, 0.05 and 0.01 levels respectively.

3.3.1 Spatial dimension

In the spatial dimension, with the analysis of special measures such as exposure metrics, attractiveness, and spatial distribution, the prominent green spatial characteristics were identified that were related to older adults’ mental health. And the strength of associations was compared horizontally.
At the level of exposure, NDVI (β=0.307), vegetation cover rate (β=0.173) and streetscape green spaces rate (β=0.094) were positively related to older adults’ mental health. And multilevel regressions showed that green spaces measures derived from overhead view had stronger associations with mental health than from street view. The accessibility to the park (β=0.052) had no correlation with mental health. Conclusions on associations of accessibility with mental health were not consistent (Lachowycz and Jones, 2014). The conclusion difference may be caused by the method of measuring accessibility distance. Both spatial straight-line distance and perceived distance were used to measure accessibility in other studies, differing significantly from spatial network distance. Furthermore, spatial heterogeneity, such as the difference in geographical and cultural background, may also cause bias in results. In our study, the service radius of the park basically covered the daily suitable travel range of older adults in the main urban area of Dalian. So, we speculate that the distance to parks hardly affected the mentality and emotions of older adults.
At the level of attractiveness, the park slope (β=-0.128) was negatively related to psychological health and the gentle slope was positively associated with older adults’ well-being. Considering the older adults’ physical condition was hugely different from the general group, a larger slope would increase their walking difficulty. The inclusion of water (e.g., fountains, lakes) in parks was positively associated with older adults’ perception of pleasure compared to parks that do not contain water. The plants’ diversity, type, number and area of the park in neighborhoods had no correlations with the older adults’ mental health.
At the level of spatial distribution: the aggregation of the park (β=-0.112) was negatively related to the older adults’ mental state. The decentralized and evenly distributed parks, improving the spatial justice and welfare in residential areas, were conducive to enhancing the self-esteem and self-confidence of older adults. The ratio of park perimeter to area (β=0.195) was positively correlated with older adults’ psychological health, indicating that a park with fewer artificial and more regular boundaries was positively associated with mental health (Gascon et al., 2015).

3.3.2 Social dimension

The associations of socio-demographic characteristics with older adults’ mental health involved two aspects: direct effects and interaction effects with green spaces metrics.
(1) Direct effects: Older age (β=0.117) was positively correlated with older adults’ psychological health. Steptoe also found that in some districts, age had a positive relationship with life satisfaction, while conclusions were different between regions under specific cultural backgrounds (Steptoe et al., 2015). Older adults who had housing property (β=0.161) had better psychological status than those who rented or had no homeownership. In addition, living together with two or more people (β=0.266) was positively associated with the psychological health of older adults compared to living alone. It showed that with the collectivism in China, multigeneration living together still had a positive impact on older adults (Liu et al., 2016).
(2) Interaction effects: NDVI moderated reversely the associations of age (Age interacted NDVI: β=-0.131) and homeownership (Homeownership interacted NDVI: β= -0.090) with mental health. That meant NDVI had a corresponding buffer against socio-demographics’ negative effects on older adults’ mental health. This conclusion was consistent with Liu’s (2016). In the process of interaction with the individual socio-demographics, the green spaces had a protective and resilient impact on the mental health of older adults.

3.3.3 Historical dimension

We tested the continuity and stability of green spaces metrics’ associations with older adults’ mental health over a ten-year period, which supported and supplemented the results of the cross-sectional data. Multilevel linear models were constructed with NDVI from 2010 to 2019 and the elderly groups with different incomes. Table 5 shows the regression coefficient, standard deviation and significance level. NDVI from 2013 to 2019 had continuous positive associations with the mental health of the overall elderly. It showed the green spaces’ healthy benefits derived from not only the short-term interaction with older adults but also the long-term intervention effects of the urban environment (such as air quality) (Janhall, 2015). In addition, the impact on the urban environment from government investment varying with time accumulation may be also a reason for long-term associations.
Table 5 Long-term associations of green spaces metrics with mental health in different elderly groups
Year Sequential Model 1
(Whole respondents)
Sequential Model 2
(Low-income groups)
Sequential Model 3
(Groups with middle-low income)
Sequential Model 4
(Groups with middle-high income)
Sequential Model 5
(High-income groups)
Coef. (S.E.) Coef. (S.E.) Coef. (S.E.) Coef. (S.E.) Coef. (S.E.)
2019 0.389***(0.117) 0.029(0.127) 0.212***(0.074) 0.209***(0.061) 0.131***(0.080)
2018 0.350***(0.082) 0.083(0.109) 0.226***(0.053) 0.251***(0.076) 0.142***(0.091)
2017 0.341***(0.107) 0.022(0.133) 0.218***(0.059) 0.219***(0.065) 0.104**(0.084)
2016 0.228***(0.069) 0.044(0.133) 0.273***(0.073) 0.294***(0.081) 0.095(0.096)
2015 0.224***(0.070) 0.019(0.134) 0.273***(0.071) 0.267***(0.081) 0.087(0.098)
2014 0.217***(0.068) 0.016(0.143) 0.248***(0.063) 0.240***(0.082) 0.081(0.094)
2013 0.168**(0.075) 0.041(0.102) 0.245***(0.082) 0.229***(0.075) 0.085(0.101)
2012 0.098(0.075) 0.045(0.101) 0.209**(0.084) 0.159**(0.086) 0.062(0.104)
2011 0.089(0.078) -0.047(0.137) 0.157**(0.075) 0.094(0.104) 0.029(0.081)
2010 0.109(0.081) -0.070(0.155) 0.178**(0.069) 0.092(0.095) 0.093(0.109)

Note: The bold numbers indicate at significant level; *, ** and *** indicate the significance at 0.1, 0.05 and 0.01 levels respectively.

Duration of the associations of NDVI with older adults’ mental health varied with income level. Notably, this kind of duration presented a threshold demand effect. When the living standard was at a low level, the material content dominated older adults’ mental condition, so the external green spaces had little intervention on their psychological health. It suggested that continuity of associations could only exist based on certain material guarantees (Zhang et al., 2020a), especially for the middle-income group, where these associations lasted for consecutive years.

4 Conclusions and discussion

The construction of an age-friendly and fair city requires a full argument about the effective benefits of the distribution and layout of green spaces resources on older adults’ mental health. This study selected objective quantitative data in a cross-method perspective, taking into account specific socio-demographic characteristics and multitemporal dynamic investigations, and built a multilevel linear model that included levels of individuals and neighborhoods to test the associations of green spaces metrics with older adults’ mental health. We drew some preliminary conclusions. In the spatial dimension, NDVI and streetscape green spaces rate were positively associated with older adults’ mental health, and the green spaces measured by the overhead view had stronger associations with mental health than by the street view. The gentle slope in parks and even distribution were positively related to older adults’ mental health. In the social dimension, homeownership and multigeneration living could increase the belonging sense of the elderly group, and the resilient spaces created by green spaces could buffer against the negative effects of socio-demographic characteristics. In the historical dimension, green spaces had long-term cumulative positive associations with the psychological health of older adults, especially for the middle-income group. These conclusions can provide a theoretical and empirical basis for the promotion of health equity.
Although the associations of urban green spaces with mental health have been explored to some extent, little previous study has focused on street view green spaces and older adults in second-tier Chinese cities. We attempted to systematically investigate the correlations of objective green spaces metrics with older adults’ mental health in spatial, social and historical dimensions. The first strength of our study was that green spaces were also measured from street view images (streetscape green spaces rate) and land use classification (park attraction) besides remote sensing images (NDVI and vegetation cover rate). Diverse measures are an advancement compared to previous studies, which were often restricted to earth observation data that was frequently of limited resolution (Gascon et al., 2015). Instead of labor-intensive and time-consuming neighborhood audits, a large volume of street view images combined with an efficient segmentation algorithm allowed us to identify green spaces more efficiently and accurately (Helbich et al., 2019). Second, instead of focusing on Western countries and Chinese metropolises (Liu et al., 2019), a critical aspect is the first selection of a Chinese second-tier and highly aging city for the relevant study. However, transferring and generalizing our conclusions to other areas needs further verification. Third, our random sampling strategy provided a representative sample of older adults in Dalian, improving generalizability and reducing selection bias.
However, our study still had several limitations. 1) The streetscape green spaces rate was only derived from the images in the street, not the whole neighborhood, so it cannot fully represent the visibility of outdoors greenness. It is expected that images of whole neighborhood spaces will be considered for further analysis under enhanced data acquisition technology. 2) Due to the lack of longitudinal data on the elderly group, it is unable to exclude the residential self-selection, that is, the healthier group may choose better environments. Meanwhile, the causal mechanism between the environment and health outcomes cannot be accurately determined. 3) The results of associations in the historical dimension may be biased because of the lack of older adults’ mental health data corresponding to the respective years of NDVI, although the method has been used in previous studies (Zhang et al., 2020a). So, long-term follow-up surveys need to be conducted to obtain longitudinal data of the older adults in subsequent studies to explore the dynamic changes and causal relationship between green spaces and health.
This article was proofread and polished by Professor Delfien Van Dyck to minimize typographical, grammatical, and bibliographical errors.
[1]
Annerstedt M, Ostergren P O, Björk J, et al. 2012. Green qualities in the neighbourhood and mental health-results from a longitudinal cohort study in Southern Sweden. BMC Public Health, 12(1): 337-349.

[2]
Burton E J, Mitchell L, Stride C B. 2011. Good places for ageing in place: development of objective built environment measures for investigating links with older people’s wellbeing. BMC Public Health, 11(1): 839-850.

[3]
Dong R C, Zhang Y L, Zhao J Z. 2018. How green are the streets within the sixth ring road of Beijing? An analysis based on Tencent Street View pictures and the green view index. International Journal of Environmental Research and Public Health, 15(7): 1367-1389.

[4]
Dong Y P, Liu H L, Qi J. 2020. Progress of studies on the relationship between urban green space and public health. Urban Planning International, 35(5): 70-79. (in Chinese)

[5]
Gan J, Yang W G, Wang L. 2020. Spatial characteristics of urban green space under different health impact pathways. Landscape Architecture, 27(4): 95-100. (in Chinese)

[6]
Gascon M, Triguero-Mas M, Martinez D, et al. 2015. Mental health benefits of long-term exposure to residential green and blue spaces: A systematic review. International Journal of Environmental Research and Public Health, 12(4): 4354-4379.

[7]
Goldstein H. 2011. Multilevel statistical models. Hoboken, John Wiley & Sons.

[8]
Helbich M, Yao Y, Liu Y, et al. 2019. Using deep learning to examine street view green and blue spaces and their associations with geriatric depression in Beijing, China. Environment International, 126: 107-117.

[9]
Janhall S. 2015. Review on urban vegetation and particle air pollution- deposition and dispersion. Atmospheric Environment, 105: 130-137.

[10]
Lachowycz K, Jones A P. 2014. Does walking explain associations between access to greenspace and lower mortality? Social Science & Medicine, 107: 9-17.

[11]
Larkin A, Hystad P. 2019. Evaluating street view exposure measures of visible green space for health research. Journal of Exposure Science & Environmental Epidemiology, 29(4): 447-456.

[12]
Li X, Ghosh D. 2018. Associations between body mass index and urban “green” streetscape in Cleveland, Ohio, USA. International Journal of Environmental Research and Public Health, 15: 2186-2198.

[13]
Li X J, Zhang C R, Li W D, et al. 2015. Assessing street-level urban greenery using Google Street View and a modified green view index. Urban Forestry & Urban Greening, 14(3): 675-685.

[14]
Liu Y, Wang R Y, Xiao Y, et al. 2019. Exploring the linkage between greenness exposure and depression among Chinese people: Mediating roles of physical activity, stress and social cohesion and moderating role of urbanicity. Health & Place, 58: 102-110.

[15]
Liu Y F, Dijst M, Geertman S. 2016. The subjective well-being of older adults in Shanghai: The role of residential environment and individual resources. Urban Studies, 54(7): 1692-1714.

[16]
Long J, Shelhamer E, Darrell T. 2015. Fully convolutional networks for semantic segmentation. In:Proceedings of the IEEE Conference on Computer Vision and Pattern Recognition. Boston, America: Computer Vision Foundation: 8: 3431-3440.

[17]
Markevych I, Schoierer J, Hartig T, et al. 2017. Exploring pathways linking greenspace to health: Theoretical and methodological guidance. Environmental Research, 158: 301-317.

[18]
Rawat W, Wang Z. 2017. Deep convolutional neural networks for image classification: A comprehensive review. Neural Computation, 29(9): 2352-2449.

[19]
Sarkar C, Webster C, Gallacher J. 2018. Residential greenness and prevalence of major depressive disorders: A cross-sectional, observational, associational study of 94879 adult UK Biobank participants. The Lancet Planetary Health, 2(4): 162-173.

[20]
Steptoe A, Deaton A, Stone A A. 2015. Subjective wellbeing, health, and ageing. The Lancet, 385(9968): 640-648.

[21]
Topp C W, Ostergaard S D, Sondergaard S, et al. 2015. The WHO-5 well-being index: A systematic review of the literature. Psychotherapy and Psychosomatics, 84(3): 167-176.

[22]
Tucker C J. 1979. Red and photographic infrared linear combinations for monitoring vegetation. Remote Sensing of Environment, 8(2): 127-150.

[23]
Wang X Y, Yang D F. 2020. How the built environment affect the frequency of green space used by the elderly-based on the dual perspective of accessibility and attractiveness. Chinese Landscape Architecture, 36(11): 62-66. (in Chinese)

[24]
WHO. 2016. Assessment of aging and health in China. Geneva, Switzerland: WHO.

[25]
Yang J, Tao Y H, Chai Y W. 2019. Neighborhood built environment, community cohesion and public health: The moderating effect of transport-related physical activity. Urban Development Studies, 26(9): 17-25. (in Chinese)

[26]
Yang L J, Yang P F. 2020. Urban parks from the perspective of spatial justice: Reflection, revision and research framework. Urban Development Studies, 27(2): 38-45. (in Chinese)

[27]
Zhang D T, Chen C X, Hong B, et al. 2020a. Impact of urban green space on residents’ health and its sustainability. Journal of Northwest University (Natural Science Edition), 50(6): 934-942. (in Chinese)

[28]
Zhang K X, Wang X L, Shi J Y, et al. 2020b. Residents’ perception of the recreational value of forest parks: A case study in Shanghai, China. Journal of Resources and Ecology, 11(4): 425-434.

[29]
Zhang X, Liu L Y, Chen X D, et al. 2021. GLC_FCS30: Global land-cover product with fine classification system at 30-m using time-series Landsat imagery. Earth System Science Data, 13(6): 2753-2776.

[30]
Zhou B L, Zhao H, Puig X, et al. 2017. Scene parsing through ade20k dataset. In:Proceedings of the IEEE Conference on Computer Vision and Pattern Recognition. Hawaii, America: Computer Vision Foundation: 633-641.

Outlines

/