Tourism Resources and Ecotourism

Changes in Ecotourism Flow in Hunan Province of China in the Context of COVID-19

  • ZHU Anni , 1 ,
  • ZHONG Yongde , 2, * ,
  • WEI Juan 1
Expand
  • 1. College of Forestry, Central South University of Forestry and Technology, Changsha 410004, China
  • 2. College of Tourism, Central South University of Forestry and Technology, Changsha 410004, China
*ZHONG Yongde, E-mail:

ZHU Anni, E-mail:

Received date: 2021-12-21

  Accepted date: 2022-04-30

  Online published: 2023-02-21

Supported by

The Hunan Zhangjiajie Ecotourism National Long-term Scientific Research Base of the State Forestry and Grassland Administration(JD2020KF01)

Abstract

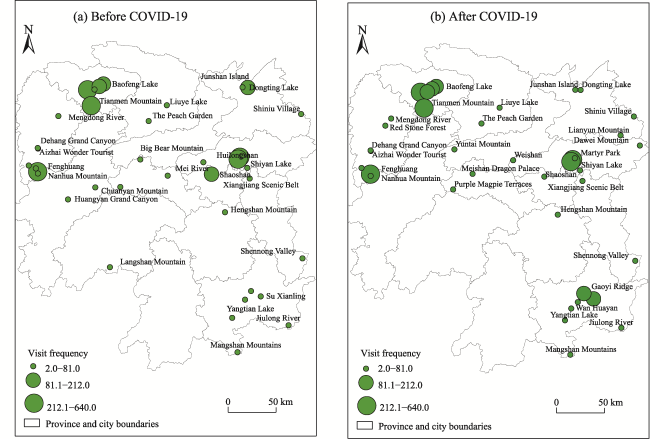
This study analyzed the changes in ecotourism flow in Hunan Province before and after the COVID-19 epidemic by obtaining the ecotourism route data for 2019 and 2020 from online tourism platforms such as wasp nest, poor travel, Ctrip, tuniu and qunar, and determining geographical distribution characteristics, node characteristics and network characteristics with the help of software such as UCINET, Netdraw and ArcGIS. The results revealed major changes in spatial distribution, the roles of nodes, and the structure and composition of the flow network. (1) COVID-19 has changed the spatial distribution pattern of ecotourism flows in Hunan Province. Under the influence of the epidemic, the spatial geographical concentration trend in Hunan Province decreased from 30.42 in 2019 to 28.94 in 2020, the flow in the North weakened, and the hot spots shifted to the south. In order to promote the development of global tourism in Hunan Province, we should focus on how to correctly handle the differences in tourism resources and the imbalance in tourism development between the Xiangxi region and other tourism regions. (2) The COVID-19 epidemic triggered changes of the roles of some nodes in the ecotourism flow network in Hunan Province. The comprehensive efficiency value of the node decreased from 266 to 222, indicating that crisis events such as the epidemic have caused damage to the ecotourism flow in Hunan Province, and the surrounding low-density ecotourism sites with good natural scenery have become more favored by tourists after the COVID-19 epidemic. (3) The COVID-19 situation has affected the structure and composition of the ecotourism flow network in Hunan Province. The overall network density of ecotourism flow in Hunan Province increased from 0.18 to 0.14, the degree of separation between ecotourism destinations increased, and tourists’ demand for health and safety has driven the development of ecotourism flow in Hunan Province towards multinode and multiregional characteristics.

Cite this article

ZHU Anni , ZHONG Yongde , WEI Juan . Changes in Ecotourism Flow in Hunan Province of China in the Context of COVID-19[J]. Journal of Resources and Ecology, 2023 , 14(2) : 276 -288 . DOI: 10.5814/j.issn.1674-764x.2023.02.006

1 Introduction

The definition of ecotourism is not unified. In 1983, the International Union for Conservation of Nature (IUCN) first proposed that ecotourism is a tourism activity that takes the natural ecological environment as a tourism object and does not cause damage to the natural environment (Ceballos, 1987). On this basis, The International Ecotourism Society (TIES) stressed that ecotourism has the dual responsibility of protecting the natural environment and maintaining the lives of local people (TIES, 2015). Due to the differences in the level of conceptual expression, the starting point and the goal of the scope, there are now more than 200 related concepts, such as the protection center theory (Lu and Wang, 2001), the residents’ interest theory (Kutay, 1989), the return to nature theory (Wu and Wen, 2003), the responsible theory (Elizabeth, 1990), the original wilderness theory and many others (Lu, 1996), so the boundary of ecotourism is vague. However, in general, ecotourism includes three core connotations: nature, education and sustainability. Since the latter two are difficult to measure from the network text, ecotourism flow actually emphasizes that the tourism nodes involved in the tourism flow must have natural attributes, such as the suggestion by Sirakaya et al. (1999) that the natural landscape of ecotourism destinations must be beautiful. Liu and Wang (2001) and Zhu et al. (2007) proposed that an ecotourism destination is a macro landscape area with natural landscape elements as the main body, including nature reserves, scenic spots, forest parks, national parks and other natural landscapes. Therefore, the ecotourism flow examined in this paper actually emphasizes that the tourism nodes involved in the tourism flow must have natural attributes, that is, they must support tourism activities based on natural scenery in natural areas.
The profound impact of the COVID-19 epidemic on tourism has been unprecedented (Marianna, 2020). Relevant research has attracted the attention of academic circles, which generally focuses on the theme tourism types such as sports tourism, rural tourism, cultural tourism and others (Shen, 2020; Zeng and Shen, 2020; Zhang and Yang, 2020). The spatial scale of such research covers scenic spots, cities, provinces, the country and even the whole world (Li et al., 2020; Sun et al., 2020; Wang, 2020; Zhao, 2020; Zheng, 2020). The research methods are mainly qualitative research, although quantitative methods such as time series regression models and background trend lines are also involved (Liu et al., 2020; You et al., 2020). Such research often focuses on the loss estimation of the tourism economy under the impact of COVID-19, changes in tourist market demand and development countermeasures (Liu et al., 2020; Yang and Liu, 2020; Zhao, 2020). However, COVID-19 has actually opened a “window of opportunity” for ecotourism (Marianna, 2020). Due to the COVID-19 situation, “short and medium distance + low density” has become the first choice for many tourists after the COVID-19 outbreak (Zeng, 2020), “Pro nature + health” has become the mainstream tourism experience (Chen, 2020), and the demand for eco-tourism is rising (Shen et al., 2020). However, there are no quantitative empirical studies on the impact of COVID-19 on ecotourism.
Tourism flow is the basic premise of tourism development, and reflects the most obvious basic characteristics of tourism activities (Xie, 2011). The obvious influences of COVID-19 on tourists’ perception, tourism motivation and tourism destination image will directly affect the changes in tourism flow (Liu et al., 2020). Existing tourism flow research mainly focuses on the spatial and temporal changes of tourism flow, network structure, influencing factors and driving mechanisms (Huang et al., 2008; Kim et al., 2016; Wu et al., 2020). The flow quality, flow potential, flow direction, flow effect, flow force, and flow quantity are the main areas of focus in tourism flow research (Wu et al., 2021). However, these studies rarely analyze the spatial changes of regional tourism flow under the impact of crisis events, especially the differences in impacts and changes in relationships of different scenic spots within a region before and after the outbreak of COVID-19. Therefore, the existing tourism flow studies have ignored the impact of COVID-19 on tourism flow, and have not described the impact of COVID-19 on tourism. However, it is of great practical significance to explore the impact of the CODIV-19 outbreak on regional tourism flow by studying the flow before and after the outbreak.
In view of this shortcoming, based on the digital footprint of tourists derived from online travel notes, this paper describes the impact of COVID-19 on the ecotourism flow in Hunan Province from the perspectives of geographical distribution, node characteristics and network characteristics, and explores the changing rules of regional ecotourism flow under the influence of COVID-19. The results will provide reference for scientifically guiding and optimizing the development space of post-COVID-19 ecotourism, and for actively and effectively responding to the impact of COVID-19 on ecotourism.

2 Data and methods

2.1 The study area

This study selected Hunan Province as a case study of ecotourism. Hunan Province is located in the middle and lower reaches of the Yangtze River in China, and forms the connection from east to west and from north to south. It has 14 prefecture-level cities and autonomous prefectures, with a total area of 21.18×10⁴ km2. As a major province of tourism and forestry in China, Hunan Province has more than 1000 natural protected areas that are based on natural scenery, including national parks, nature reserves, wetland parks, forest parks, geological parks, rocky desert parks, world heritage sites, tourist attractions, tourist resorts and scenic spots. Its ecotourism resources are widely distributed, reasonable in structure, complete in elements and rich in types. Hunan Province is one of the typical representatives of ecotourism development. As mentioned above, the concept of ecotourism examined in this paper emphasizes its natural attributes, so the research scope of destinations in this study include 10 types of natural protected sites based on nature, including national parks, nature reserves, wetland parks, forest parks, geological parks, rocky desert parks, world heritage sites, tourist attractions, tourist resorts and scenic spots, which are distributed in all 14 prefectures and cities in Hunan Province.

2.2 Data sources

This study used time sampling, source sampling and topic sampling to collect and process the data. 1) The selected time periods were January to August 2019 and January to August 2020. 2) Five typical tourist websites (Horse Honeycomb, Wandering, Ctrip, Bull and Where to Go) were selected as the source platforms for travel notes and travel records. 3) Travel notes and travel records on the five major tourism websites were searched using the theme keywords of the names of various prefecture-level cities in Hunan Province. Online travel notes represent the spontaneous records of tourists’ travel trajectories according to their own experiences and feelings. However, due to the different cultural levels and personal preferences of tourists, their quality is often uneven. Therefore, the first data clean-up step involved eliminating the travel note data about local customs, such as advertising introductions and tourist arrival tips, which yielded 1217 travel records and 1794 travel notes.
After screening and judging the core tourism image and main functions of tourism destinations individually, non-ecotourism destinations such as memorials, museums, cultural sites and theme parks were excluded. Similarly, the travel notes involving comprehensive tourist destinations such as Shaoshan and Fenghuang were identified. If the travel notes clearly mentioned the natural landscapes such as Dishui Cave and Tuojiang, they were retained. Because the geographical location, popularity, resource types and other characteristics of ecotourism destinations are different, the data were merged for the ecotourism destinations which are similar in meaning, small in scale, difficult to distinguish or subordinate to a higher level. For example, the small Dongjiang River and Dongjiang Lake, Gao Chailing Mountain and Feitian Mountain were merged, and the small scenic spots such as Huangshizhai, Yangjiajie, Yuanjiajie and Wulingyuan were combined into the category of Zhangjiajie National Forest Park. Using the above data processing rules, 1378 tourism routes were obtained.

2.3 Research methods

2.3.1 Geographical distribution characteristics

With the help of Xie and Wu’s (2008) research formula and the data collected as described above, the geographical spatial distribution of ecotourism flow in Hunan Province was analyzed through Excel calculations and ArcGIS mapping of the geographical concentration index and hot spot index. The geographical concentration index measures the concentration degree of ecotourism flow. Its calculation formula is:
$G=100\times \sqrt{\sum\limits_{i=1}^{n}{{{\left( \frac{{{X}_{i}}}{T} \right)}^{2}}}}$
where G represents the geographical concentration index of ecotourism flow, Xi is the i tourism flow of the ecotourism destination, T is the total flow of ecotourism flow, and n is the total number of ecotourism destinations. The more concentrated the ecotourism flow, the greater the G value.
The goal of hot spot analysis (Getis-Ord Gi*) is to identify and calculate significant high/low value spatial clustering from a statistical point of view, including the distributions of hot spots and cold spots (Xu, 2014). The calculation formula is:
${{G}_{i}}^{*}(d)=\frac{\sum\limits_{j=1}^{n}{{{w}_{ij}}(d){{X}_{j}}}}{\sum\limits_{j=1}^{n}{{{X}_{j}}}}$
where, wij(d) is the spatial weight function, The adjacent value of i and j is 1, and the non-adjacent value is 0, Xj is the attribute value of space j.

2.3.2 Node characteristics

This study selected the two indicators of centrality and structural hole to measure the functions of tourism nodes. At the same time, with reference to Yuan et al. (2016) and combined with this study, a comprehensive evaluation model was constructed. The centrality index can effectively measure the function of each node and the concentration and dispersion of tourism flow. It is composed of three evaluation indexes: Degree Centrality, Betweenness Centrality and Closeness Centrality. Degree Centrality focuses on the positions of nodes in the tourism flow network structure; Betweenness Centrality can effectively reflect the tightness of the relationships between each node; and Closeness Centrality measures whether the node has the role of “Betweeness introducer” in the network structure, focusing on the control role of the node. This study also analyzed the structural hole index and pointed out the non-uniformity of node distribution in the network. The index includes effectiveness, efficiency and limitation status regarding the three centrality measures, respectively. For example, a higher level of a structural hole shows that it has high effectiveness, low efficiency and low limitation. The higher the level of a structural hole, the stronger its independence and the more competitive it is. The formula of the comprehensive evaluation model is:
${{M}_{i}}=\alpha {{I}_{{{C}_{D}}}}+\beta {{I}_{{{C}_{C}}}}+\chi {{I}_{{{C}_{B}}}}-\delta {{I}_{{{C}_{T}}}}$
where Mi represents the comprehensive evaluation value of the ecotourism destination; ${{I}_{{{C}_{D}}}}$, ${{I}_{{{C}_{C}}}}$, ${{I}_{{{C}_{B}}}}$, and${{I}_{{{C}_{T}}}}$ represent Degree Centrality, Closeness Centrality, Betweeness Centrality and Limitation, respectively; and $\alpha $, $\beta $, $\chi $ and $\delta $ represent weights, and the sum of them is 1. The four indicators measure and evaluate the nodes from different aspects, which have the same importance, so their assignments are 0.25.

2.3.3 Network characteristics

In order to gain a deeper understanding of ecotourism flow, this study selected network density and network centrality indicators to analyze the overall network structure characteristics. Network density refers to the tightness between nodes in the overall network structure, and the density value is positively correlated with the tightness. The network central potential is divided into Degree Centralization, Closeness Centralization and Betweeness Centralization. The calculations of these three indicators are carried out by degree centralization. The larger the value, the stronger the radiation and agglomeration function.

3 Results

3.1 Geographical distribution characteristics

3.1.1 Reduction of the spatial agglomeration trend

One of the spatial characteristics of tourism flow is the concentration of tourism flow (Liu et al., 2020). Using the geographical concentration index to calculate the spatial distribution of tourism flow, the spatial distribution of ecotourism flow in Hunan Province is shown to be uneven, with a strong agglomeration trend. Tourism flow is mainly concentrated in areas with good ecotourism resources such as Zhangjiajie and Western Hunan. Compared with a study of tourism flow in Hunan Province in 1999 and 2011 by Yang and Wang (2014), the agglomeration and diffusion effect in Western Hunan has been significantly expanded. This change shows that tourism in Western Hunan has developed rapidly in the past few years. After the COVID-19 outbreak, the geographical concentration index of tourism flow decreased from 30.42 to 28.94, indicating that the ecotourism flow in Hunan Province became more dispersed under the influence of the COVID-19 (Fig. 1). Tourists not only began to focus on popular scenic spots such as Zhangjiajie National Forest Park, Tianmen Mountain, Fenghuang and Yuelu Mountain, but also paid attention to ecotourism destinations with a good ecological environment and low traffic, such as Dongjianghu, Gaoyi Ridge and Yangtian Lake.
Fig. 1 Spatial distribution of tourism flow in Hunan Province before and after COVID-19

3.1.2 Increasing tourism heat in southern Hunan

The spatial pattern of ecotourism flow in Hunan is generally uneven. COVID-19 has changed the cold/hot spot pattern and shifted the cold spot area (Fig. 2). The spatial distribution of ecotourism flow in Hunan Province was analyzed using ArcGIS software, and the Z value was divided into four categories by Jenks natural breaks classification. The higher the value, the higher the heat. Before the COVID-19 outbreak, the ecotourism flow in Hunan was mainly concentrated in the northern part of Hunan Province. Six ecotourism sites such as Zhangjiajie National Forest Park, Tianmenshan Mountain and Baofeng Lake were the hot spots of tourist flow, while the southern Hunan area was the cold spot of tourist flow. After COVID-19, the cold spot area shifted obviously, and the tourism heat in southern Hunan increased sharply.
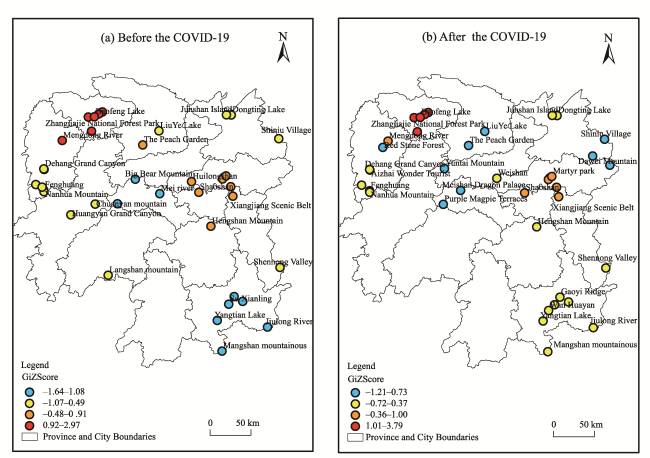
Fig. 2 Hot spots of tourism flow distribution in Hunan Province before and after COVID-19

3.1.3 The flow in Northwest Hunan was significantly weakened

The frequent flow direction reflects the linkage between ecotourism destinations (Mou, 2020). Using ArcGIS software, the connection intensity of tourism flow between ecotourism destinations was divided into seven levels, and the spatial flow pattern of tourism flow in Hunan Province was drawn. As shown in Fig. 3, the ecotourism flow in Hunan Province shows a flow pattern of “strong in the northwest and weak in the southeast”, and the connection intensity of tourism flow is significantly different. Under the influence of the COVID-19 epidemic, the spatial connection of tourism flow in Hunan Province has weakened, and the average connection strength was reduced from 7.07 to 6.28. This also confirms that the crisis had a negative impact on the connection degree of tourism (Liu et al., 2020). Before COVID-19, Hunan Province formed the “Golden Triangle” pattern of Zhangjiajie, Western Hunan and Changsha. After COVID-19, the overall tourism flow in Hunan Province decreased significantly, and the “polygon” structure of Zhangjiajie, Western Hunan, Changsha, Chenzhou and Yueyang became highlighted.
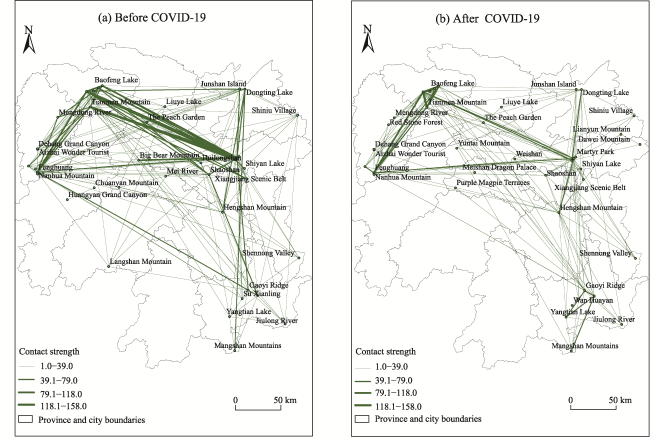
Fig. 3 Spatial flow pattern of tourism flow in Hunan Province before and after COVID-19

3.2 Node characteristics

3.2.1 The surrounding niche ecotourism destinations have become more popular

The Degree Centrality of the tourism flow network was calculated through the network module of UCINET software. The results show that the Degree Centrality levels of Zhangjiajie National Forest Park, Fenghuang, Yuelu Mountain and Juzizhou have always been within the top five (Table 1). This is the core scenic spot of Hunan Province and it has a strong distribution capacity and tourism attraction, which coincides with a large number of tourism flow studies in Hunan Province in the past (Zhou and Xu, 2016; Zhang, 2020). Considering the average values, the average values of the centrality of tourism nodes in Hunan Province before and after the COVID-19 outbreak decreased from 9.42 to 8.00, and the connection degree between the nodes decreased. Considering the standard deviation, the standard deviations before and after COVID-19 were 6.11 and 5.68, respectively, showing a downward trend and indicating that the uneven distribution of ecotourism flow also decreased after COVID-19. Considering the centrality of each node, the centrality of traditional ecotourism places such as Fenghuang, Tianmen Mountain and Zhangjiajie National Forest Park decreased after COVID-19, while the centrality increased for tourism nodes such as Shiyan lake and Dawei Mountain, which were not of concern or close to the city in the past, indicating that the surrounding small ecotourism places are more likely to be favored by tourists after COVID-19 (see Table 2).
Table 1 Network structure node centers before COVID-19
Tourism node Degree Centrality Closeness Centrality Betweenness Centrality
Out In Out In
Zhangjiajie National Forest Park 44.74 57.90 68.42 75.88 217.80
Fenghuang 57.90 52.63 75.00 72.37 181.42
Tianmen Mountain 52.63 44.74 71.93 68.86 161.40
Orange-islet 50.00 44.74 70.61 69.30 157.90
Shaoshan 36.84 42.11 64.04 68.42 98.24
Yuelu Mountain 44.74 36.84 67.54 64.47 68.21
Dongting Lake 28.95 34.21 60.09 63.16 49.49
Hengshan Mountain 26.32 28.95 58.33 59.21 30.27
Zhangjiajie Grand Canyon 28.95 28.95 58.33 60.53 22.53
Dongjiang Lake 21.05 13.16 51.75 50.22 45.78
Gaoyi Ridge 15.79 13.16 50.44 51.32 35.59
Junshan Island 21.05 21.05 55.70 54.39 6.30
Shiniu Village 10.53 18.42 45.18 55.70 28.28
Yangtian Lake 13.16 13.16 48.25 44.52 36.07
Huanglong Cave 21.05 18.42 53.95 55.26 5.78
Mei River 10.53 7.90 46.93 42.11 45.95
Xiangjiang Scenic Belt 21.05 13.16 55.70 50.44 12.52
Miaoren Valley 18.42 18.42 52.63 55.26 5.23
The Peach Garden 15.79 13.16 52.19 50.22 8.32
Liuye Lake 18.42 10.53 53.51 48.03 6.06
Nanhua Mountain 7.90 15.79 47.81 53.95 9.53
Aizhai Wonder Tourist Area 18.42 10.53 52.63 48.03 4.66
Su Xianling 13.16 15.79 48.68 51.10 4.59
Deben Grand Canyon 13.16 13.16 49.12 50.44 3.73
Huilongshan 5.26 13.16 37.50 51.75 21.88
Baofeng Lake 13.16 13.16 49.56 50.00 0.82
Jiulong River 7.90 10.53 46.49 43.20 14.40
Langshan Mountain 7.90 7.90 45.61 46.93 13.97
Martyr Park 7.90 13.16 43.64 51.75 4.05
Mengdong River 7.90 13.16 46.05 48.25 0.00
Shennong Valley 7.90 10.53 46.93 47.15 1.21
Purple Magpie Terraces 5.26 13.16 34.87 46.71 10.46
Big Bear Mountain 5.26 5.26 43.42 43.20 13.10
Qiliang Cave 5.26 10.53 44.30 49.56 0.00
Shiyan Lake 5.26 7.90 42.11 45.18 2.76
Mangshan Mountains 5.26 7.90 35.97 43.64 2.69
Chuanyan Mountain 2.63 0.00 2.63 0.00 0.00
Huangyan Grand Canyon 0.00 2.63 0.00 2.63 0.00
Table 2 Network structure node centers after COVID-19
Tourism node Degree Centrality Closeness Centrality Betweenness
Centrality
Out In Out In
Yuelu Mountain 39.47 44.74 68.42 67.98 311.57
Orange-islet 42.11 42.11 69.30 66.67 188.67
Fenghuang 42.11 39.47 67.11 64.91 181.22
Hengshan Mountain 36.84 34.21 65.79 62.28 175.73
Zhangjiajie National Forest Park 31.58 44.74 60.53 67.98 122.96
Dongting Lake 34.21 21.05 64.04 53.51 121.10
Tianmen Mountain 39.47 26.32 67.11 57.46 100.40
Gaoyi Ridge 18.42 28.95 52.19 60.09 97.66
Dongjiang Lake 18.42 23.68 53.29 54.83 88.69
The Peach Garden 15.79 15.79 53.07 50.44 78.91
Shaoshan 21.05 18.42 55.70 53.51 42.57
Zhangjiajie Grand Canyon 18.42 23.68 53.07 55.04 12.60
Shiyan Lake 10.53 7.90 47.37 43.20 44.30
Baofeng Lake 18.42 15.79 51.54 48.47 16.28
Xiangjiang Scenic Belt 13.16 7.90 50.88 44.30 23.56
Nanhua Mountain 21.05 7.90 55.26 44.08 7.79
Aizhai Wonder Tourist Area 13.16 10.53 50.00 43.64 17.39
Yangtian Lake 13.16 10.53 48.25 44.52 12.20
Huanglong Cave 13.16 13.16 47.15 45.40 0.25
Martyr park 10.53 10.53 47.37 48.25 1.99
Dawei Mountain 2.63 5.26 40.79 33.55 36.00
Miaoren Valley 5.26 15.79 41.45 49.34 0.50
Su Xianling 7.90 7.90 44.08 43.64 8.06
Junshan Island 5.26 10.53 44.08 46.49 1.02
Jiulong River 7.90 7.90 44.08 41.45 2.15
Shennong Valley 7.90 5.26 44.30 39.91 4.99
Mangshan Mountains 7.90 10.53 40.13 39.69 3.99
Shiniu Village 7.90 5.26 45.83 36.18 2.95
Red Stone Forest 7.90 5.26 44.52 37.28 0.25
Mengdong River 7.90 5.26 43.20 37.94 0.00
Liuye Lake 2.63 10.53 34.65 42.33 2.57
Lianyun Mountain 2.63 5.26 30.04 41.45 12.32
Yuntai Mountain 5.26 2.63 42.98 34.43 1.44
Weishan 7.90 2.63 44.08 29.91 2.12
Purple Magpie Terraces 2.63 2.63 35.18 33.55 0.83
Deben Grand Canyon 0.00 5.26 0.00 43.64 0.00
Meishan Dragon Palace 0.00 5.26 0.00 42.33 0.00
Wan Huayan 0.00 2.63 0.00 37.94 0.00
Before the COVID-19 outbreak, there were large differences in the overall Closeness indicators, but there were only small differences in the inward and outward Closeness indicators of individual tourism nodes, indicating that the power distribution of nodes before COVID-19 was uneven (Table 1). The internal and external centrality and outward centrality of key nodes are high, and the input and output functions are significant. The tourism flow network cycle is controlled by a few key nodes, and most of the nodes are too “dependent” on those key nodes. After COVID-19, the differences of internal and external indicators of individual nodes became larger (Table 2). For one type of node, the inward value is slightly larger and the outward value is small, such as Wanhuayan, Meishan Dragon Palace, Dehang Grand Canyon, etc. This type of node does not have the possibility of becoming the core and is unlikely to become the preferred destination for tourists. For another type of node, the inward value is small and the outward value is large, such as Nanhua mountain, Shiniu Village, Yishan mountain, etc. These nodes have a strong outward diffusion ability, but weak ability to attract tourists.
From the perspective of Betweeness Centrality, most ecotourism destinations in Hunan Province need to rely on the core node as a Betweeness to realize the connection. The highest Betweeness Centrality is 311.57 (Yuelu Mountain) and the lowest is 0 (Deben Grand Canyon, Meishan Dragon Palace, and Wan Huayan), indicating that there are isolated nodes in the tourism flow network structure. Before COVID-19, Zhangjiajie National Forest Park and Fenghuang were the key transit points in the ecotourism flow network of Hunan Province, with strong hub functions. In particular, Zhangjiajie National Forest Park occupied an absolutely dominant position among all scenic spots. After COVID-19, Yuelu Mountain has become the most attractive ecotourism destination. In addition, before COVID-19, the Betweeness Centrality values of Shiyan Lake and Dawei Mountain were 0, so they played almost no role as Betweeness hubs, and their sense of existence in the tourism flow network structure was very low (Table 1). After COVID-19, the Betweeness Centrality of these two increased sharply, which also confirms the conclusion that tourists prefer short-distance tourism and suburban ecotourism in the existing COVID-19 related research (Zheng, 2020).

3.2.2 Decline in the control effect of core nodes

UCINET software was used to calculate and analyze the numerical results of each index of the structural hole. The total efficiency values of tourism nodes before and after COVID-19 were 265.58 and 221.9, respectively, indicating that COVID-19 has caused damage to the flow of ecotourism (Table 3). Generally speaking, tourism nodes with higher levels of structural holes can generate tourism attraction by virtue of their own conditions, while tourism nodes with lower levels of structural holes cannot, so it is easy for them to cause the tourism flow to pile up (Zhu, 2020). Before COVID-19, there was a cluster of ecotourism flows in Hunan Province, but after COVID-19, the situation was alleviated, the guidance and control of the core node to the surrounding tourism flows were obvious, and the popular scenic spots with crowds were significantly reduced.
Table 3 Structural hole index values of tourism nodes
Before COVID-19 After COVID-19
Tourism node Effectiveness Efficiency Limitation Tourism node Effectiveness Efficiency Limitation
Zhangjiajie National Forest Park 19.55 0.82 0.39 Hengshan Mountain 16.24 0.81 0.39
Fenghuang 19.52 0.78 0.43 Yuelu Mountain 15.83 0.75 0.52
Tianmen Mountain 17.38 0.72 0.52 Orange-islet 15.14 0.80 0.37
Orange-islet 17.12 0.78 0.44 Fenghuang 14.47 0.76 0.45
Shaoshan 13.62 0.76 0.45 Zhangjiajie National Forest Park 13.72 0.76 0.39
Yuelu Mountain 12.17 0.68 0.54 Dongting Lake 11.86 0.79 0.53
Dongting Lake 10.82 0.77 0.54 Gaoyi Ridge 11.54 0.82 0.62
Hengshan Mountain 10.07 0.78 0.55 Tianmen Mountain 10.80 0.68 0.55
Zhangjiajie Grand Canyon 8.36 0.60 0.65 Dongjiang Lake 9.20 0.84 0.57
Junshan Island 7.83 0.71 0.60 Shaoshan 8.54 0.71 0.62
Shiniu Village 7.82 0.87 0.36 Zhangjiajie Grand Canyon 7.18 0.65 0.72
Dongjiang Lake 7.78 0.87 0.53 The Peach Garden 6.49 0.81 0.49
The Peach Garden 7.40 0.82 0.42 Nanhua Mountain 6.20 0.77 0.66
Miaoren Valley 6.96 0.70 0.79 Aizhai Wonder Tourist Area 6.11 0.76 0.59
Su Xianling 6.41 0.80 0.59 Shiyan Lake 4.84 0.81 0.56
Generally speaking, there is a strong correlation between the three types of central indicators and structural hole indicators (Hassan, 2000). According to the comprehensive evaluation model established above, the ecotourism destinations before and after COVID-19 were comprehensively evaluated, and the results were imported into ArcGIS. Through Jenks best natural fracture method, the 38 nodes of ecotourism destinations in Hunan Province were divided into four levels: core node, important node, general node and edge node (Fig. 4).
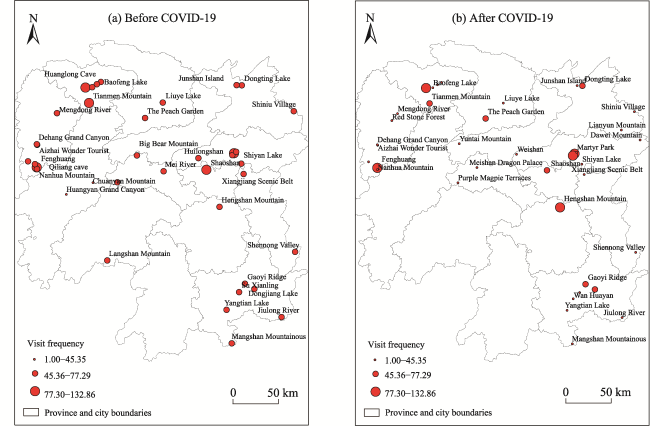
Fig. 4 Tourism node levels before and after COVID-19
A core node is in the core position of the network and has the strongest competitiveness in the region. Under the influence of COVID-19, the Hunan ecotourism network has increased by three core nodes of Mount Yuelu, Heng Mountain, and Dongting Lake. Meanwhile, the levels of Shaoshan tourist nodes as traditional scenic spots have declined. Important nodes have the possibility of becoming core nodes and great development potential. After COVID-19, the status in the tourism flow network structure has been improved for some ecotourism destinations which have high ecotourism resource endowments, such as Gaoyi Ridge and Taohuayuan. Generally, nodes do not have a core attraction, so they are less likely to become the tourists’ departure points or main destinations. After COVID-19, the number of general nodes decreased and the number of core nodes increased, indicating that tourists have a broader perspective on their choice of ecotourism destinations under the influence of the COVID-19 outbreak. The inner and outer centrality and structural hole level of edge nodes are relatively low, so such nodes lack agglomeration ability, and are located at the outer edge of the network structure. After COVID-19, Wanhuayan, Meishan Dragon Palace and Dehang Grand Canyon have attracted the attention of tourists, but their Betweeness Centrality values are 0, and the inward centrality is much greater than the outward centrality. Such features indicate that these nodes do not play a Betweeness role and completely depend on the drainage of nodes, so their quality improvement and transformations must be strengthened. However, the tourism nodes with rising comprehensive evaluation values have certain similar characteristics. One is being located in the urban center or suburban areas, such as Yuelu Mountain, Shiyan lake, and Dawei Mountain, which can meet the leisure needs of tourists in a short distance. Another characteristic is being located near a core scenic spot, such as Baofeng Lake, which can reasonably avoid the dense crowds at the core nodes.

3.3 Network characteristics

3.3.1 Reduced network density and radiation function

The 38 tourism flow network nodes selected in this study theoretically generate 1406 connection points, and UCINET calculations indicated that the actual numbers of connection points before and after COVID-19 are both less than 300. Before and after the COVID-19 outbreak, the network density values were lower than 0.2, and the standard deviations were lower than 0.4, which indicates that the frequency of connections between tourist nodes in the ecotourism flow network structure of Hunan Province is not high, and the number of tourist nodes involved in the tourist route is small (Table 4). After the COVID-19 outbreak, the number of actual connection points, standard deviation, and network density have all decreased, indicating that the connection between tourism flows has been weakened after COVID-19. Tourists affected by the COVID-19 outbreak are less likely to choose long-distance tourist routes due to safety concerns and convenience (Zheng, 2020).
Table 4 Tourism flow network density, standard deviation and connection point index
Variable Before COVID-19 After COVID-19
Network density value 0.1835 0.1444
Standard deviation 0.3871 0.3515
Actual number of connection points 274 214
The central potential of the network better reflects the strength of the radiation function of the core nodes in the overall network, and can be presented through the three sub-indicators of Degree Centralization, Closeness Centralizationand Betweeness Centralization. Before and after COVID-19, the closeness to the center and the degree of the central power of the ecotourism flow in Hunan Province were both high, indicating that the radiation and agglomeration of the core node tourism flow would have a great impact on the composition of the overall tourism flow network structure. However, the intermediate central power index was low, which indicates that the Betweeness adjustment effect of other tourism nodes in Hunan Province is relatively low, and so the core tourism nodes are highly dependent (Table 5). However, after COVID-19, the Betweeness center's momentum has risen, and the degree of center’s momentum has declined, indicating that the radial driving role of the core nodes in Hunan Province has been weakened, and the dependence of other tourism nodes on the core nodes has declined.
Table 5 Central potential index of the tourism flow network
Before COVID-19 After COVID-19
Central position Sub-indicator type Numerical value Central position Sub-indicator type Numerical value
Degree Centralization out 40.582% Degree Centralization out 28.393%
in 40.582% in 31.094%
Closeness Centralization out 54.91% Closeness Centralization out 48.81%
in 54.73% in 46.07%
Betweeness Centralization Betweeness 13.41% Betweeness Centralization Betweeness 19.51%

3.3.2 Fuzzy small-world features

Before COVID-19, the average path length of the ecotourism flow network in Hunan Province was 2.03, indicating high accessibility and low separation. However, the average path length rose to 2.283 after COVID-19, indicating that the degree of separation between ecotourism sites increased afterCOVID-19. The clustering coefficient rose from 0.477 before COVID-19 to 0.486 after COVID-19, showing stronger agglomeration. Compared with random networks of the same scale, the ecotourism flow network in Hunan Province before COVID-19 had a larger clustering coefficient and a smaller average path length, and the characteristics of the small world were significant. After COVID-19, the clustering coefficient increased and the average path length decreased, indicating that the small world characteristics of the ecotourism flow network in Hunan Province have begun to blur. Although the average path length between the various ecotourism destinations has increased and the connection has become weaker, the increase in the clustering coefficient also means that the connection between the short-distance ecotourism destinations in Hunan Province after COVID-19 has become stronger. The main reason for this change is that the safety and psychological needs of tourists have increased, and long-distance tourism routes need to bear certain health risks (Kang and Zhu, 2020). Therefore, after long-term isolation, tourists are more willing to choose nearby ecotourism scenic spots as their travel destinations.

4 Discussion

4.1 Impact on the quantity of tourism flow

The COVID-19 crisis has caused certain damage to the ecotourism flow in Hunan Province, which is consistent with the research results of Liu and (2020). But the difference is that this kind of damage comes from the multifaceted compression of flow. On the one hand, in order to prevent the spread of COVID-19 and infection risk caused by the dense flow of people, various tourist destinations have enacted flow restriction operations (Tang et al., 2020). On the other hand, people will consciously avoid exposure to the crisis environment and choose less crowded destinations to widen their social distances (Seraphin, 2020). Tourists’ travel intention and motivation are also greatly reduced.

4.2 Impact on the spatial distribution of tourism flow

The high concentration of tourism flow is a restrictive factor for the development of ecotourism in Hunan Province. Under the influence of COVID-19, people have a strong sense of travel risk, which has changed the travel preferences and travel distances of tourists. Different ecotourism destinations receive different amounts of attention (Tang et al., 2022), and as the research here shows, tourists prefer to choose nearby and small eco-tourism destinations after COVID-19. However, China has made remarkable achievements in COVID-19 prevention and control and tourism recovery, and has entered a stage of the normalization of COVID-19 prevention and control. It is unclear whether tourists' willingness to avoid crowded areas will change with the improvements in COVID-19 control (Chen and Li, 2022). Therefore, correctly dealing with the differences in tourism resources and the imbalance of tourism development between the Western Hunan plate and other tourism plates is an urgent topic and future direction for the optimization of the spatial layout of tourism flow in Hunan Province.

4.3 Impact on the network of tourism flow

The hierarchical structure of the ecotourism flow network in Hunan Province is obvious. COVID-19 has changed the roles of Zhangjiajie National Forest Park, Yuelu Mountain, Juzizhou and other ecotourism destinations in the ecotourism flow network. Before the outbreak, Zhangjiajie National Forest Park occupied an absolutely dominant position in the tourism flow network. As one of the first batch of world natural heritages in China, it has high popularity and attractiveness. It is often used as a core node in the process of tourism route design and marketing, which drives the development of other nodes such as Tianmen Mountain and Fenghuang (Zhu, 2020). After the outbreak, the ecotourism flow network in Hunan Province has formed a hierarchical structure centered on Zhangjiajie National Forest Park, Tianmen Mountain, Juzizhou and Fenghuang, with the obvious development of multipolarization. The main reason is that the Zhangjiajie eco-tourism destination is highly dependent on public transportation and inbound tourism, both of which are more difficult after COVID-19. Ecotourism destinations in the urban centers, such as Juzizhou and Yuelu Mountain, are more likely to become the first choice for tourists (Wang, 2009; Qu, 2018). Therefore, under the influence of COVID-19, the ecotourism flow network in Hunan Province has developed from a single pole to multiple poles.
Although this study has conducted a detailed analysis of the ecotourism flow under the impact of COVID-19, there are also deficiencies. The strategy of mining tourist flow data through the online travel notes can achieve the effect of a field questionnaire survey, and has strong representativeness and accuracy (Yan and Jin, 2019). However, the online travel note strategy cannot fully identify the attribute characteristics of the tourists, such as gender, age, occupation, income and travel mode, nor can it reveal the impact of COVID-19 on different types of tourism flows, such as individual tourists versus group tourists. In addition, it is worth noting that this research framework mainly focuses on the static analysis of tourist flow. In future studies, it will be necessary to bring the potential impact of tourism flow in time into the research framework, and explore the process of dynamic impacts from the perspective of changes in the spatial and temporal characteristics of tourism flow under COVID-19.

5 Suggestions

In view of the impact of COVID-19 on the ecotourism flow in Hunan Province, the results of this study suggest that the development of ecotourism in Hunan Province will present the following scenario: after the epidemic, the four traditional tourism sectors are uneven, and the traditional “tourism pole effect” advantage of Hunan Province no longer exists; however, safe and healthy surrounding natural scenic spots are more favored by tourists; so the development of ecotourism has formed a multi-center network pattern. On this basis, several suggestions are put forward. First, optimize the development space and deepen regional brand cooperation. At present, the ecotourism flow pattern in Hunan Province is uneven. The surrounding leisure tourism with Yuelu Mountain and Juzizhou as the radiation core, and the natural sightseeing tourism with Zhangjiajie as the core, occupy a strong market. Second, strengthen the node function to drain the high-density scenic spots. Scenic spots with large flows have relatively large ecological environmental pressure and present epidemic prevention and control risks. Therefore, we must focus on strengthening the links between nodes, and provide other tourism information through the information platforms to disperse the tourism flow, in order to realize the multi-directional interaction of tourism flow. We should also focus on the balanced collocation of core and edge nodes, strengthen the coordinated development of hot spots and cold spots, and promote the continuous strengthening of the links between tourism nodes. Third, improve the construction of the transportation network and innovate the pedigree of ecotourism products. After the epidemic, we should optimize the traffic network construction of ecotourism destinations, carefully screen and scientifically combine medium and short-range ecotourism destinations with cities as the core, match the destinations with ecotourism products that have distinctive themes and rich experiences, expand the scope of ecotourism choices, improve the probability of destination selection by tourists, and extend the activity track of tourists.

6 Conclusions

This study takes the ecotourism flow in Hunan Province as the object, uses big data mining on network platforms as the primary data source, and adopts research indicators and methods such as geographic concentration index, hotspot analysis, centrality, structural holes, network density, network centrality, etc., from geographical distribution characteristics and node characteristics. These tools are used to analyze the impact of COVID-19 on the flow of ecotourism in Hunan Province from three aspects of the network characteristics. The main conclusions of the study are three-fold.
(1) COVID-19 has changed the spatial distribution pattern of ecotourism flows in Hunan Province. On the whole, the ecotourism flow in Hunan Province is unevenly distributed, and the tourism flow is mainly concentrated in the western part of Hunan. Zhangjiajie National Forest Park plays a leading role in the pattern of ecotourism in Hunan Province. As affected by COVID-19, the geographical concentration index of the ecotourism flow agglomeration trend in Hunan Province decreased from 30.42 to 28.94, showing a trend that hot spots spreading to the South and flowing to the North has weakened. The average value of the overall connection strength decreased from 7.07 to 6.28.
(2) COVID-19 has triggered changes in the roles of some nodes in the ecotourism flow network of Hunan Province. Under the influence of COVID-19, the situation of primary control by the core node has been alleviated. Under the normalization of the COVID-19 situation, there are two main categories of increase in the comprehensive evaluation value. One is located in the urban centers or suburban areas, which can meet the leisure needs of tourists over a short distance. The other is the dense crowds located near the core scenic spots, which can reasonably avoid the core nodes. In the past, a few core tourism nodes have governed most of the tourism flow in the province, but this has been alleviated under the impact of COVID-19. The surrounding small ecotourism destinations with good natural scenery are more favored by post COVID-19 tourists.
(3) COVID-19 has affected the structural composition of the ecotourism flow network in Hunan Province, which has the characteristics of low network density and a significant radiation effect. Under the influence of COVID-19, the network density and radiation function have both shown downward trends, which is conducive to the optimization of the overall layout of the ecotourism development space in Hunan Province. Tourists' demand for health and safety has driven the development of ecotourism in Hunan Province towards multiple nodes and multiple regions. Under the influence of COVID-19, tourists are less likely to choose long-distance tourism routes, the degree of separation between ecotourism destinations has increased, the small- world characteristics of urban public transportation have become blurred, and the ecotourism flow network has been further divided and reorganized.
[1]
Ceballos L H. 1987. The future of ecotourism. Mexico Journal, (1): 13-14.

[2]
Chen G H, Li M H. 2022. Tourist behavior research related to the COVID-19 pandemic published in English-language journals: A critical review and reflections. Journal of Chinese Ecotourism, 12(1): 114-124. (in Chinese)

[3]
Chen W X. 2020. The COVID-19 prevention and control normalization of the development of a healthy tourism industry. Social Scientist, 273(1): 59-65. (in Chinese)

[4]
Elizabeth Bo. 1990. Ecotourism:The potentiais and pitfails. Washington DC, USA: WWF.

[5]
Hassan S S. 2000. Determinants of market competitiveness in an environmentally sustainable toursim industry. Journal of Travel Research, 38(3): 239-246.

[6]
Huang Z F, Yuan L W, Yu Z Y, et al. 2008. Temporal and spatial evolution and characteristics of tourism flow in ecotourism area—Taking Yancheng Milu Ecotourism Area as an example. Geographical Research, 27(1): 55-64. (in Chinese)

[7]
Kang L, Zhu K. 2020. An empirical analysis of the change of tourists’ behavioral intentions before and after the outbreak of new crown pneumonia. Journal of Xiamen University of Technology, 28(2): 41-47. (in Chinese)

[8]
Kim S S, Prideaux B, Timothy D. 2016. Factors affecting bilateral Chinese and Japenese travel. Annals of Tourism Reasearch, 61(C): 80-95.

[9]
Kutay K. 1989. Ecotourism and adventure travel. In Tourism and ecology: The impact of travel on a fragile earth. North Ameirican Coordinating Center for Responsible Travel, 8(2): 3-7.

[10]
Li G P, Yang Y, Xu Z, et al. 2020. Comparative study on the impact of major global COVID-19 on economic system and its response. World Geographic research, 29(6): 1091-1101. (in Chinese)

[11]
Liu D J, Chen J Z, Jia Y Y. 2020. The impact of the 8.8 Jiuzhaigou Earthquake on the geographical distribution and flow of regional tourism flows. Resources and Environment in Arid Areas, 34(7): 201-208. (in Chinese)

[12]
Liu S F, Yang H T. 2020. COVID-19’s impact on tourism in China, Japan and South Korea. Asia Pacific Economy, (2): 21-29. (in Chinese)

[13]
Liu Z W, Wang Y L. 2001. Perspective of ecotourism and its landscape ecology. Human Geography, 6(3): 11-15. (in Chinese)

[14]
Lu Y T, Wang J J. 2001. Ecotourism. Beijing, China: Tourism Education Press. (in Chinese)

[15]
Lu Y T. 1996. Ecotourism and sustainable tourism development. Economic Geography, 16(1): 106-112.

[16]
Marianna Sigala. 2020. Tourism and COVID-19: Impacts and implications for advancing and resetting industry and research. Journal of Business Research, 117(C): 312-321.

[17]
Mou N, Zheng Y, Makkonen T, et al. 2020. Tourists’ digital footprint: The spatial patterns of tourist flows in Qingdao, China. Tourism Management, 81: 104151. DOI: 10.1016/j.tourman.2020.104151.

[18]
Qu M J. 2018. Analysis of Zhangjiajie inbound tourism market. Modern Marketing: Xueyuan Edition, (10): 125. (in Chinese)

[19]
Seraphin H. 2020. COVID-19: An opportunity to review existing grounded theories in event studies. Journal of Convention & Event Tourism, 1-33.DOI: 10.1080/15470148.2020.1776657.

[20]
Shen J B, Xu T, Lu M M, et al. 2020. Coping strategies of tourism industry under the impact of the COVID-19 and development trend in the post COVID-19 period. Macroeconomic Management, 442(8): 61-66. (in Chinese)

[21]
Shen X M. 2020. Research on the development of cultural tourism industry in the post COVID-19 era. Journal of Fuyang Vocational and Technical College, 31(4): 87-90. (in Chinese)

[22]
Sirakaya E, Sasidharan V, Sonmez S. 1999. Redefining ecotourism: The need for a supply-side view. Journal of Travel Research, 38(2): 168-172.

[23]
Sun L N, Li J R, Yan X J. 2020. Current situation and prospect of tourism industry in Jilin Province under the normalization of COVID-19 situation. Marketing Circle, (43): 195-196.

[24]
Tang C C, Zhang H L, Zhao L, et al. 2022. Discussion on the impact of COVID-19 on China’s tourism industry and its responses. Journal of Chinese Ecotourism, 12(1): 169-183. (in Chinese)

[25]
TIES(The International Ecotourism Society). 2015. What is ecotourism. https://Ecotourism.org/.Viewed on 2022-6-22.

[26]
Wang F. 2020. Countermeasures and suggestions for the transformation and upgrading of rural tourism in Ningbo in the post COVID-19 era. Ningbo Economy ( Sanjiang Forum), (10): 23-26. (in Chinese)

[27]
Wang Z F. 2009. Empirical analysis of the impact of tourism transportation on the development of tourism industry—Taking Zhangjiajie as an example. Financial Theory and Practice, 30(4): 112-116. (in Chinese)

[28]
Wu S S, Wang L C, Liu H Y. 2020. Study on the structural characteristics of tourism flow network in the Yellow River Basin. Economic Geography, 40(10): 202-212. (in Chinese)

[29]
Wu S S, Wang L C, Liu H Y. 2021. Study on tourism flow network patterns on May Day Holiday. Sustainability, 13(2): 1-23.

[30]
Wu Z W, Wen S W. 2003. Ecotourism. Beijing, China: Forestry Press: 29. (in Chinese)

[31]
Xie Y J. 2011. Basic tourism. Beijing, China: Tourism Press: 314-315. (in Chinese)

[32]
Xie Z H, Wu B H. 2008. Study on tourism spatial structure of resource-based scenic spots in China. Geographical Sciences, 28(6): 748-753. (in Chinese)

[33]
Xu J H. 2014. Econometric geography. Beijing, China: Higher Education Press: 158-164. (in Chinese)

[34]
Yan S S, Jin C. 2019. Spatial network structure characteristics of city tourism flow based on multi-source data—A case study of Luoyang City. Economic Geography, 39(8): 231-240. (in Chinese)

[35]
Yang X, Wang Z F. 2014. Research on the measurement of spatial agglomeration and diffusion of Hunan tourism flow based on traffic network. Regional Research and Development, 33(4): 96-100. (in Chinese)

[36]
Yang X F, Liu T. 2020. The COVID-19 impact on tourism industry and countermeasures summary. Journal of Wuhan Polytechnic, 19(6): 47-50. (in Chinese)

[37]
You J, Peng G H, Li Q. 2020. Study on the impact of the COVID-19 on the tourism economy and countermeasures. Special Economic Zone, (7): 85-88. (in Chinese)

[38]
Yuan X F, Zhang L D, Chen F, et al. 2016. Spatial differentiation and coupling between self-driving tourism development level and tourism traffic accessibility in Yunnan Province. Economic Geography, 36(5): 195-201. (in Chinese)

[39]
Zeng J L. 2020. Post COVID-19 era of tourism. Situation of Sichuan Province, 220(6): 49-49. (in Chinese)

[40]
Zeng Y L, Shen K Y. 2020. Development trend and countermeasures of sports tourism in the COVID-19 situation. Hubei Sports Technology, 39(8): 659-663. (in Chinese)

[41]
Zhang J J, Yang X. 2020. Opportunities, challenges and action strategies for rural tourism under COVID-19. Liaoning Agricultural Sciences, (6): 52-54. (in Chinese)

[42]
Zhang S W. 2020. Research on the spatial network structure of tourism flow in Hunan Province. Market Weekly, (3): 45-47. (in Chinese)

[43]
Zhao L. 2020. COVID-19’s domestic tourism development characteristics and coping strategies research. Economic Research Guide, (33): 125-127. (in Chinese)

[44]
Zheng X R. 2020. Night economy in the post COVID-19 era—Taking “night Neijiang” town as an example. Urban and Rural Construction, (22): 26-27. (in Chinese)

[45]
Zhou H L, Xu C X. 2016. Spatial network structure characteristics of Hunan tourism flow based on travel notes. Economic Geography, 36(10): 201-206. (in Chinese)

[46]
Zhu F. 2020. Research on tourism flow network structure and Optimization in Western Hunan based on digital footprint. Diss., Changsha, China: Hunan Normal University. (in Chinese)

[47]
Zhu Y, Lu X Q, Kang W X. 2007. Definition of ecotourism destination. Geography and Geo-Information Science, 23(6): 100-104. (in Chinese)

Outlines

/