Tourism Resources and Ecotourism

Multi-scenario Evolution of Tourism Carbon Emissions in Jiangxi Province under the “Carbon Peak and Neutrality” Target

  • WANG Liguo , 1, 2, 3, 4 ,
  • ZHU Hai , 1, 3, 4, *
Expand
  • 1. College of Land Resources and Environment, Jiangxi Agricultural University, Nanchang 330045, China
  • 2. Key Laboratory of Agricultural Resources and Ecology in Poyang Lake Basin of Jiangxi Province, Nanchang 330045, China
  • 3. Rural Tourism Development Research Center, Jiangxi Agricultural University, Nanchang 330045, China
  • 4. Nanchang Rural Tourism Development Research Center, Nanchang 330045, China
*ZHU Hai, E-mail:

WANG Liguo, E-mail:

Received date: 2021-11-08

  Accepted date: 2022-05-10

  Online published: 2023-02-21

Supported by

The Humanities and Social Science Planning Project of the Ministry of Education(21YJAZH085)

The National Natural Science Foundation of China(41361035)

Abstract

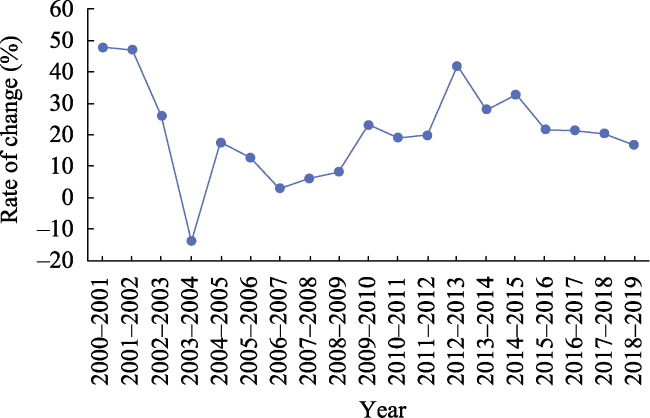
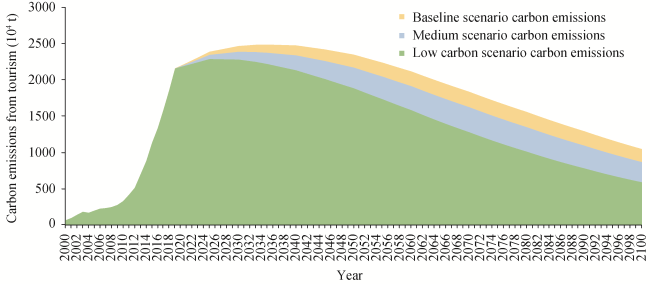
Regional tourism needs to respond positively to the “carbon peak and neutrality” target, and the key and most difficult aspect is the prediction of carbon emissions. In this paper, the total carbon emissions of the tourism industry in Jiangxi Province from 2000 to 2019 are calculated by using terminal consumption and the tourism development coefficient. The factors influencing the carbon emissions of the tourism industry are studied by means of logarithmic mean weight Divisia index decomposition (LMDI), and the timing of the tourism industry carbon peak is predicted by combining the extensible random environmental impact assessment model (STIRPAT) and scenario analysis method. The results show three key aspects of this system. (1) In the historical period, the carbon emissions of the tourism industry in Jiangxi Province increased from 71.365×10⁴ t in 2000 to 2342.456×104 t in 2019, with an average annual change rate of 21.09%. The scale of tourism investment was the most important factor affecting the carbon emissions of tourism industry in this period. (2) The main factor that will affect the change of tourism carbon emissions in Jiangxi Province in the future is the carbon emission intensity, and its influence coefficient reaches 0.810. The degrees of influence of tourism income, tourism number and tourism investment follow in sequence. (3) The peak time of carbon emissions from tourism in Jiangxi Province varies under different scenarios. In the baseline scenario, it is estimated to be around 2035, and the average annual change rate will be -0.88%. In the medium- and low-carbon scenarios, the peak carbon emissions will be realized around 2030 and 2025, with the average annual change rates being -1.11% and -1.58%, respectively, indicating that the government’s low-carbon policy will have an impact on the carbon emission intensity of tourism and promote the tourism industry in Jiangxi Province to advance by 5 to 10 years. This study provides a theoretical basis for allowing regional tourism to achieve its carbon peak in advance, which supports the prediction of the whole country’s “carbon peak and neutrality”, and also provides a measurement basis for the realization of carbon neutralization in tourism.

Cite this article

WANG Liguo , ZHU Hai . Multi-scenario Evolution of Tourism Carbon Emissions in Jiangxi Province under the “Carbon Peak and Neutrality” Target[J]. Journal of Resources and Ecology, 2023 , 14(2) : 265 -275 . DOI: 10.5814/j.issn.1674-764x.2023.02.005

1 Introduction

Tourism is an industry that provides tourism services to tourists through tourism resources and tourism facilities, which is also known as the “smokeless industry”. However, with the development of modern tourism, the World Tourism Organization (UNWTO) believes that tourism carbon emissions account for about 4.9% of the total global carbon emissions. By 2035, the annual growth rate of tourism carbon emissions may reach 2.5% (UNWTO, 2009). Carbon dioxide emissions are one of the important drivers of the greenhouse effect, and the Intergovernmental Panel on Climate Change (IPCC) predicts that the global temperature will rise by 1.4 ℃-5.8 ℃ from 1990 to 2100. In order to curb the environmental damage caused by global warming, the Kyoto Protocol was formulated and adopted in December 1997. Energy conservation and emission reduction have become the consensus goals of most countries in the world.
On September 22, 2020, Chinese decision makers promised at the seventy-fifth United Nations General Assembly that China would increase its national independent contribution, strive to achieve the carbon peak by 2030, and strive to achieve carbon neutrality by 2060 (Xi, 2020). At present, China has become the world’s largest emitter of greenhouse gases, with its greenhouse gas emissions accounting for about one-quarter of the global total. In view of the present environmental situation and the low-carbon goal, the Chinese government once again defined the “carbon peak and neutrality” goal in the “14th Five-Year Plan”, and made peak carbon dioxide emissions one of the eight major tasks of the Chinese government in 2021. Thus, energy conservation and low-carbon environmental protection have become the top priority in the transformation and development of the whole industry in China in the future. Therefore, the greenhouse effect generated by tourism will inevitably attract people’s attention. Green development has become an important concept and effective way for achieving the sustainable development of tourism (Tang et al., 2017a). In 2008, Chinese government documents first proposed “energy conservation and emission reduction in tourism” (Wu and Yue, 2013). Chinese scholarly research on carbon emissions in tourism is still in the exploratory stage. At the same time, scholars in China and abroad mainly study the carbon emissions of tourism from the following three aspects. The first is the calculation of tourism carbon emissions from different scales, including the national (Becken and Patterson, 2006; Meng et al., 2017) provincial (Tao, 2015; Su, 2019), city (Liu et al., 2011; Sun et al., 2015; Wu and Tian, 2016; Tang and Ge, 2018) and other regional scales, based on tourism carbon emissions or the tourism carbon footprint (Cadarso et al., 2016; Lenzen et al., 2018; Hafeez et al., 2019) and carried out through detailed calculations. The second is the spatial and temporal distribution and characteristics of tourism carbon emissions, including those of different time periods (Zeng et al., 2021) and different regional spaces (Li and Lv, 2021; Han et al., 2021; Yao et al., 2021), in order to explore the spatial and temporal heterogeneity of tourism carbon emissions (Huang et al., 2021; Shao and Wang, 2020; Zhang et al., 2021), which has gradually become an emerging trend in the study of tourism carbon emissions. Third, many scholars have studied the factors influencing the carbon emissions from tourism from the perspectives of economic development (Sherafatian-Jahromi et al., 2017; Balsalobre-Lorente et al., 2020; Isaeva et al., 2021), social policy (Feng et al., 2019; Yıldırım et al., 2021), ecological efficiency (Hong et al., 2021; Pata and Balsalobre-Lorente, 2021), energy efficiency (Wang et al., 2016; Tang et al., 2018), physical fluids (Liu and Yue, 2021), life cycle (Tang et al., 2017b), and others. The research methods include the Kaya equation (Ma et al., 2019), LMDI method (Weng et al., 2021), STIRPAT model (Tang and Li, 2019), GMM dynamic regression model (Wang et al., 2019a), and Environmental Kuznets Curve (EKC) (Balsalobre-Lorente et al., 2021; Nosheen et al., 2021). These studies have greatly enriched the research system of tourism carbon emissions.
The coverage rate of forest in Jiangxi Province is 63.1%, ranking second in China, and the ecological background of its social and economic development is green. At the same time, Jiangxi Province has seven national global tourism demonstration zones in China, and its tourism development has both ecological and global characteristics. Therefore, many scholars have carried out profound research on the carbon emissions of tourism in Jiangxi Province. Among them, Wang et al. (2011) established two models of the tourism carbon footprint to measure the total amount of the tourism carbon footprint and the proportion of carbon emissions in the six major tourism sectors in Jiangxi Province, and found that the carbon emission coefficient and energy intensity coefficient are the key factors affecting the overall change in the tourism carbon footprint. Jiao et al. (2012) introduced the concept of geographical space to explore the spatial distribution characteristics of carbon emissions in the tourism industry in Jiangxi. The spatial distribution characteristics are believed to be basically consistent with the distribution characteristics of tourism resources. Poyang Lake Ecological Economic Zone is the largest and fastest growing area of carbon emissions.
In summary, scholars have carried out abundant research on tourism carbon emissions from different perspectives and using different methods, which provides a foundation for further research on tourism carbon emissions. Against the background of the current “Carbon Peak and Neutrality” goal, Tang and other scholars have tried to predict the carbon emissions and carbon peak of tourism at the national level (Tang et al., 2021). However, the current academic research on the dynamic changes of carbon emissions and the carbon peak time of tourism under different scenarios at the regional level is relatively lacking. Therefore, this paper adopts a quantitative research method to estimate the carbon emissions of the tourism industry in Jiangxi Province from 2000 to 2019 by using the stripping coefficient method. On this basis, the LMDI decomposition method is used to explore the relevant factors affecting the carbon emissions of the tourism industry. With the help of the STIRPAT model and scenario prediction method, the future carbon emissions of the tourism industry are estimated. Policy recommendations are then put forward to guide the tourism industry in Jiangxi Province in achieving low-carbon development. These recommendations provide a theoretical basis for the regional assessment of the time at which the tourism industry will achieve its carbon peak, for formulating corresponding green development plans, and for allowing the national tourism industry to achieve the “Carbon Peak and Neutrality” goal as soon as possible.

2 Regional survey

Jiangxi Province is located on the south bank of the middle and lower reaches of the Yangtze River, with various topographies and four distinct seasons. Jiangxi is a major ecological province, and one of China’s first provinces included in the construction of ecological civilization demonstration zone. In 2020, the ecological environment index (EI) of Jiangxi Province was rated as excellent, ranking fourth in China. There are five national practical innovation bases of “lucid waters and lush mountains are invaluable assets”, ranking second in China. There are 16 “National Ecological Civilization Construction Demonstration” cities and counties, and Jiangxi achieves full coverage of national forest cities and national garden cities. Jiangxi Province is also a leading province in tourism. There are tourism resources of high quality and quantity, including Lushan Mountain, Jinggangshan Mountain, Jingdezhen Ancient Official Kiln, Tengwang Pavilion, Poyang Lake and Wuyuan Village, as well as other rich and unique landscape and cultural tourism attractions. In 2019, the tourist arrivals in Jiangxi Province numbered about 793 million, and the tourism income reached 965.638 billion yuan. Tourism has gradually become the leading industry of the tertiary industry, and the proportion of tourism income in the output value of the tertiary industry reached 82.11%. Therefore, realizing the “carbon peak and neutrality” goal of tourism in Jiangxi Province is of great significance for its socio-economic development, and also has guiding significance for the development of low-carbon tourism in other regions.

3 Research data and methods

3.1 Data sources

The basic data in this paper mainly includes energy consumption data and economic development data. On the premise of fully considering the availability of data, the basic data of energy consumption came from the China Energy Statistics Yearbooks from 2001 to 2020. According to the IPCC energy classification and Chinese statistical caliber, the energy terminal consumption of raw coal, briquette, coke, crude oil and other energy was selected for the statistics. Social and economic data, such as total tourism income, number of tourists, GDP of the tertiary industry and investment in fixed assets of the tertiary industry, were derived from the 2001-2020 Jiangxi Statistical Yearbook and statistical bulletins of each year.

3.2 Research methods

3.2.1 Calculation of tourism carbon emissions

At present, China’s tourism energy consumption has not yet achieved independent statistics, so in order to measure tourism carbon emissions, a certain amount of tourism energy consumption must be obtained, and it needs to be stripped from the existing energy statistics. Therefore, this paper uses the tourism development coefficient to extract the tourism energy consumption from the energy terminal consumption of the tertiary industry. The tourism energy consumption is calculated using formula (1).
${{E}_{j}}={{S}_{j}}R$
where Ej represents the j-type energy consumption of the tourism industry; Sj represents the terminal consumption of the j-type energy in the transportation, warehousing and postal industries, as well as the wholesale, retail, accommodation and catering industries; and R represents the tourism development coefficient of each region. Based on relevant research, it is determined by the proportion of total tourism income in the GDP of the tertiary industry (Huang et al., 2019), and the consumption Ej of j-type energy in tourism is separated from the terminal consumption Sj of j-type energy in the tertiary industry by this method. j represents the energy type.
On the basis of the tourism energy consumption, the tourism carbon emissions are then calculated as:
$C=\sum\limits_{j=1}^{n}{{{E}_{j}}{{f}_{j}}k}$
where C represents tourism carbon emissions; ${{f}_{j}}$represents the standard coal conversion coefficient of type $j$ energy (Huang et al., 2019); k represents the CO2 emissions per unit of standard coal, according to the existing research results, set k=2.45; and n represents the type of energy consumption.

3.2.2 LMDI method

This paper uses the logarithmic mean weight Divisia index decomposition (LMDI) to decompose the factors influencing tourism carbon emissions. The traditional Kaya equation is not comprehensive enough for the decomposition of carbon emissions. Therefore, combined with the research of domestic and foreign scholars, the main factors influencing tourism carbon emissions are considered to include carbon emission intensity, energy intensity, energy consumption, investment efficiency and investment scale. Jiangxi Province is currently in the stage of the rapid development of global tourism, and the development of tourism has a profound impact on the regional social economy. Therefore, this paper selects tourism income and tourism number as two important indicators to measure the development of tourism in Jiangxi Province, and reflects the close relationship between the two. The total energy consumption of tourism is selected to reflect the technical level and consumption structure of the energy application of tourism in Jiangxi Province; and the scale of investment is selected as a driving indicator of tourism development in Jiangxi Province. The specific selection factors and extended expression are:
$C=\frac{C}{G}\times \frac{G}{E}\times \frac{E}{B}\times \frac{B}{D}\times D=\alpha \times \beta \times \gamma \times \varepsilon \times \omega $
where C is the total carbon emissions of tourism in Jiangxi Province; E is the total energy consumption of tourism; G is tourism economic benefit, namely tourism income; B is tourist benefit, that is, the number of tourists; let $\omega =D$, where D is the scale of tourism investment, that is, the amount of tourism investment in fixed assets (as there is no direct tourism investment statistics, so it needs to be divested to the amount of investment in fixed assets in the tertiary industry as the base, using the specific divestiture method with reference to the tourism energy consumption stripping method); let $\alpha =\frac{C}{G}$be the carbon emission intensity of tourism, that is, the carbon emission released by each unit of tourism income; let $\beta =\frac{G}{E}$ be the tourism energy intensity, namely the tourism income obtained by consuming one ton of standard coal energy; let $\gamma =\frac{E}{B}$ be tourism energy consumption, that is, the energy consumption per tourist during tourism activities; and let $\varepsilon =\frac{B}{D}$ be the tourism investment efficiency, that is, the tourist arrivals per unit of investment that can be absorbed.
Assuming that ${{C}^{0}}$ and Ct represent the carbon emissions of tourism in the base year and the t year, respectively, according to the additive form in the LMDI decomposition method, the carbon emissions $\Delta C$ of the T period relative to the current tourism industry is decomposed into:
$\Delta C=\Delta {{C}_{\alpha }}+\Delta {{C}_{\beta }}+\Delta {{C}_{\gamma }}+\Delta {{C}_{\varepsilon }}+\Delta {{C}_{\omega }}~$
where $\Delta {{C}_{\alpha }}$, $\Delta {{C}_{\beta }}$, $\Delta {{C}_{\gamma }}$, $\Delta {{C}_{\varepsilon }}$, and $\Delta {{C}_{\omega }}$ denote the effects of tourism carbon emission intensity, tourism energy intensity, tourism energy consumption, tourism investment efficiency and tourism investment scale on tourism carbon emission, respectively. The decomposition results are:
$\Delta {{C}_{\alpha }}=\frac{{{C}^{t}}-{{C}^{0}}}{\ln {{C}^{t}}-\ln {{C}^{0}}}~\times (\ln {{\alpha }^{t}}-\ln {{\alpha }^{0}})$
$\Delta {{C}_{\beta }}=\frac{{{C}^{t}}-{{C}^{0}}}{\ln {{C}^{t}}-\ln {{C}^{0}}}~\times (\ln {{\beta }^{t}}-\ln {{\beta }^{0}})$
$\Delta {{C}_{\gamma }}=\frac{{{C}^{t}}-{{C}^{0}}}{\ln {{C}^{t}}-\ln {{C}^{0}}}~\times (\ln {{\gamma }^{t}}-\ln {{\gamma }^{0}})$
$\Delta {{C}_{\varepsilon }}=\frac{{{C}^{t}}-{{C}^{0}}}{\ln {{C}^{t}}-\ln {{C}^{0}}}~\times (\ln {{\varepsilon }^{t}}-\ln {{\varepsilon }^{0}})$
$\Delta {{C}_{\omega }}=\frac{{{C}^{t}}-{{C}^{0}}}{\ln {{C}^{t}}-\ln {{C}^{0}}}~\times (\ln {{\omega }^{t}}-\ln {{\omega }^{0}})$

3.2.3 STIRPAT model

The expandable random environmental impact assessment model (STIRPAT) is proposed on the basis of the IPAT model, which is mainly used to explore the influences of independent variables on environmental pressure. The expression is as follows:
$I=a{{P}^{b}}{{A}^{c}}{{T}^{d}}e$
Taking the logarithms on both sides of the equation:
$\ln I=\ln a+b\ln P+c\ln A+d\ln T+\ln e$
where I is the total carbon emission of tourism, P is the number of tourists, $A$ is the tourism income, T is the carbon emission intensity, $a$ is a constant term, and $\text{e}$ is a random error term. The coefficients $b$, $c$ and $d$ represent the degrees of influence of each factor on the emission, respectively; $e$ is a random error term.
Based on the following LMDI factor decomposition results, the investment scale will have a significant impact on the carbon emissions of Jiangxi tourism. Therefore, in order to fully predict the future changes in carbon emissions of Jiangxi tourism, the investment scale is introduced into the STIRPAT model, and the expanded STIRPAT model is:
$\ln I=\ln a+b\ln P+c\ln A+\text{d}\ln T+h\ln F+\ln e$
where $F$ is the amount of tourism investment; $b$, $c$, $d$, $h$ are exponential coefficients; and $e$ is a random error term.
Due to the multicollinearity problem between the various elements, in order to avoid its impact on the calculation results, this paper uses the ridge regression method to fit the tourism carbon emissions and the influencing factors. Based on the above extended STIRPAT model, namely formula (12), taking $\ln I$ as the dependent variable and $\ln P$, $\ln A$, $\ln T$, $\ln F$ as independent variables, the ridge regression analysis was carried out. The results are shown in Table 1. From the fitting results, when k =0.01, the regression coefficient of each influencing factor tends to be stable, R2 is 0.997, and the overall fitting degree of the surface model is good. Thus, the ridge regression equation is:
$\ln I=2.437+0.371\ln P+0.466\ln A+0.810\ln T+0.147\ln F$
Table 1 Ridge regression fitting results.
Variable Coefficient Standard error Normal coefficient t statistic P
constant 2.437 0.165 0.000 14.793 < 0.01
$\ln P$ 0.371 0.037 0.415 10.059 < 0.01
$\ln A$ 0.466 0.033 0.636 14.183 < 0.01
$\ln T$ 0.810 0.079 0.330 10.213 < 0.01
$\ln F$ 0.147 0.032 0.240 4.634 < 0.01
Based on the results of ridge regression analysis, the future carbon emissions of tourism in Jiangxi Province can be predicted. The basic formula is:
$I={{\text{e}}^{2.437+0.371\ln P+0.466\ln A+0.810\ln T+0.147\ln F}}$
In order to test the accuracy of this formula, the historical period data of the respective variables are introduced
into formula (14), and the model estimates the carbon emissions results. Compared with the actual measurement results in the following sections, the absolute value of the average error rate was found to be 4.40%, so the calculated values were basically consistent with the measured values, indicating that the prediction model has certain empirical significance.

3.2.4 Scenario analysis

Scenario analysis, also known as the prospective description method, is a method for predicting the possible situations or consequences of the predicted objects under the premise that a certain phenomenon or trend will continue into the future. Based on the above prediction model, this paper uses the scenario analysis method to select three scenarios, the benchmark scenario, medium scenario and low carbon scenario, and takes 2019 as the base year for predicting the carbon emissions of tourism in Jiangxi Province in the future. The predictive values of each variable are set according to relevant literature, policy planning and the general law of social and economic development, and refer to historical change rates to ensure that the data set conforms to the actual economic and social development of Jiangxi Province. The specific variables for different scenarios are set as follows.
1. Baseline scenario
(1) Scenario description: Maintain the existing socio-economic growth model with the “14th Five-Year plan” as the key guidance for future development, and promote the carbon emission scenarios resulting from tourism development in accordance with the current green development policies and measures.
(2) Change rate setting. Setting the change rate of tourist numbers refers to Zhou’s (2018) prediction of China’s population, and it is believed that after the opening up of the two-child policy, the peak population will be reached in 2033, and then the population will remain stable. Population is the basis of regional development. As the population reaches its peak, the number of tourists will decrease. Therefore, the rate of change in the tourist numbers will be set with reference to the population change rate, specifically: 4.00%(① Jiangxi’s “14th Five-Year Plan” for Cultural and Tourism Development.)from 2020 to 2025; 0.18% from 2026 to 2033; and -0.04% from 2034 to 2100.
Setting the rate of change of tourism income. The change rate is set to 3.70%(② Jiangxi’s “14th Five-Year Plan” for Cultural and Tourism Development.)from 2020 to 2025. As the gross national product has been showing a growing trend, the per capita GDP will increase continuously. However, due to the general regularity of economic development, the GDP growth rate will decrease with the expansion of economic volume, so the per capita tourism consumption will increase continuously, but the growth rate will decrease. Therefore, the per capita tourism consumption is set to 4.60%(③ Average change rate of per capita tourism consumption in Jiangxi Province from 2000 to 2019.)from 2026 to 2030; 4.00% from 2031 to 2040; 3.50% from 2041 to 2050; 3.00% from 2051 to 2060; 2.50% from 2061 to 2070; 2.00% from 2071 to 2080; 1.50% from 2081 to 2090; and 1.00% from 2091 to 2100. Total tourism revenue is the number of tourists in a given year multiplied by the per capita tourism consumption in that year.
Setting the investment change rate. China’s economic development presents the characteristics of “new normal”, and “adjusting structure and stabilizing growth” is the goal of China’s economic development. In order to achieve this goal, it will be necessary for the government to implement a normalized and active fiscal policy. According to the principle of regenerative economics, investment always dominates consumption, only investment-led consumption can lead to sustainable consumption, and only investment-led consumption can optimize economic structure and achieve sustainable economic growth and development. Therefore, as the population reaches its peak, the industrial structure is gradually optimized, and the infrastructure construction of the tourism industry tends to be saturated. The investment will still show high growth, but it will gradually slow down, so the rate of change in investment is set as: 8.00%(④ The “14th Five-Year Plan” for National Economic and Social Development of Jiangxi and the Outline of Long-term Goals for 2035.)from 2020 to 2025; 7.00% from 2026 to 2030; 6.00% from 2031 to 2035; 5.00% from 2036 to 2040; 4.00% from 2041 to 2045; 3.00% from 2046 to 2050; 2.00% from 2051 to 2055; 1.00% from 2056 to 2060; and 0.50% from 2061 to 2100.
Setting the tourism carbon emission intensity. To promote the green development of the tourism economy with realistic energy saving and emission reduction intensity, and the change rate of the carbon emission intensity is set as -3.16%.
2. Medium scenario
(1) Scenario description. On the basis of the benchmark scenario, green low-carbon technology research and development are encouraged and the practical results are applied to tourism-related industries to comprehensively promote the low-carbonization of tourism travel, tourism products and tourism services. Tourism-related industries actively participate in the alternative use of clean energy, vigorously promote the substitution of natural gas and electricity for fossil fuels, actively improve the clean and efficient utilization efficiency of coal, cooperate in reducing the utilization rate of bulk coal, adhere to the tourism energy strategy of energy conservation and emission reduction, and reasonably guide the demand for tourism energy.
(2) Change rate setting. The number of tourists, tourism income and industrial investment are set according to the general law of social development, with reference to several documents: “the Opinions of the CPC Central Committee and the State Council on Completely, Accurately and Comprehensively Implementing the New Development Concept and Doing a Good Job of Carbon Neutralization in peak carbon dioxide emissions”, “the Guiding Opinions of the State Council on Accelerating the Establishment and Perfection of Green and Low Carbon Circular Development Economic System”, “the White Paper on China’s Policies and Actions to Address Climate Change”, “the peak carbon dioxide emissions Action Plan before 2030”, and “the Measures on Accelerating the Establishment and Perfection of Green and Low Carbon Circular Development Economic System issued by Jiangxi People’s Government”. “Jiangxi’s 14th Five-Year Plan” for Consumption Upgrading and Development, etc. According to the medium scenario description, the green development of tourism economy is promoted with medium energy saving and emission reduction intensity, and the change rate of the carbon emission intensity is set as -3.50%.
3. Low-carbon scenario
(1) Scenario description. On the basis of the medium scenario, it is necessary to further improve energy conservation and emission reduction, implement more stringent low-carbon development policies, refine carbon emission intensity control indicators in different categories, strengthen the control of energy consumption in tourism through legislation, limit the use of fossil energy, strengthen the use of clean energy, strictly implement energy conservation assessment and review, and strengthen energy conservation monitoring. To build a low-carbon tourism industry system, it is necessary to increase the carbon sink of the tourism ecosystem, realize the “food, shelter, travel, shopping and entertainment” under the low-carbon mode, advocate a new way of tourism for the whole society’s environmental protection, and tourists need to uphold the values of the green low-carbon and consumption concept, and actively carry forward the new social trend of low-carbon.
(2) Change rate setting. The number of tourists, tourism income and industrial investment are set according to the general law of social development. According to the low carbon scenario, the green development of the tourism economy is promoted by high energy conservation and emission reduction intensity, and the change rate of the carbon emission intensity is -4.00%.

4 Results and analysis

4.1 Evolution of tourism carbon emissions in the past 20 years

4.1.1 Characteristics of the tourism carbon emissions evolution

Based on the data of energy consumption and total tourism income in Jiangxi Province from 2000 to 2019, the terminal energy consumption and total carbon emissions of tourism in Jiangxi Province were calculated according to formulas (1) and (2). According to the calculation results, in addition to a decline in 2004, tourism carbon emissions in Jiangxi Province in 2000-2019 showed overall growth, from 71.365×10⁴ t in 2000 to 2342.456×104 t in 2019, with an average annual change rate of 21.09%.
According to the changes in the calculated growth rate (Fig. 1), the interannual change of tourism carbon emissions in Jiangxi Province can be divided into three stages. The first stage is a period of sharp decline (2000-2004). At the beginning of this stage, the growth rate of tourism carbon emissions decreased slightly, but then the growth rate decreased significantly. By 2003, the growth rate decreased by 21.14 %. One possible reason is that a major public health event (SARS) affected the tourism industry due to the problem of epidemic prevention. In 2004, the tourism carbon emissions showed negative growth, and the total tourism carbon emissions decreased. One possible reason is that the state implemented macro-control of energy, and the energy consumption of the transportation industry decreased sharply, thus affecting the tourism industry. The second stage is the period of fluctuating growth (2005-2013). At this stage, the growth rate of tourism carbon emissions fluctuated significantly, and the growth rate in 2007 was 2.98%. One possible reason is that the country began to implement energy conservation and emission reduction policies in that year. The growth rate in 2013 was 41.98%, possibly due to the implementation of the Tourism Law of the People’s Republic of China, the enlargement of the tourism market and the increase of tourism consumption. The third stage is a stable growth period (2014-2019). The growth rate of tourism carbon emissions was relatively stable in this stage. The growth rate of tourism carbon emissions in 2014-2017 was higher than the average annual growth rate, but there was a slight decline.
Fig. 1 Rate of change in the carbon emissions in Jiangxi tourism from 2000 to 2019

4.1.2 Decomposition of the factors influencing tourism carbon emissions

Through the LMDI model, the factors influencing the tourism carbon emissions in Jiangxi Province are decomposed into tourism carbon emission intensity, tourism energy intensity, tourism energy consumption, tourism investment efficiency and tourism investment scale. Based on the calculation results of the model, the trend chart of the contribution rates of each factor to the tourism carbon emissions was drawn (Fig. 2) to explore the influences of the different factors on the change in the tourism carbon emissions in Jiangxi Province.
Fig. 2 Trend of changes in the contribution rates of various factors to tourism carbon emissions
Based on the calculation results, the absolute value of the contribution rate of tourism energy intensity to tourism carbon emissions in Jiangxi Province in 2004 and 2007 was the largest. In addition, the absolute value of the contribution rate of tourism investment scale to the carbon emission of tourism industry in Jiangxi Province in other years is the maximum among the decomposition factors in those years. Therefore, it is generally believed that the scale of tourism investment is the main factor affecting the carbon emissions of tourism in Jiangxi Province in this period.

4.2 The evolution of carbon emissions of the tourism industry in the future under the “carbon peak and neutrality” goal

According to the above scenario variables, we used the prediction model to obtain the prediction results of carbon emissions of tourism in Jiangxi Province in the future (Fig. 3). In the benchmark scenario, the intensities of energy conservation and emission reduction are not intervened under the existing social and economic growth mode. The prediction results show that the peak time of tourism carbon in this scenario is about 2035, and the corresponding peak carbon emission is about 2481.487×104 t, with an annual change rate of -0.88%.
Fig. 3 Forecast of tourism carbon emissions in Jiangxi under the three scenarios (2021-2100)
Clearly, if the government does not constrain the carbon intensity of tourism, tourism carbon emissions in Jiangxi will peak later than those in the country overall, which may delay the country’s overall carbon peak time.
In the medium scenario, the social economy will develop with medium energy saving and emission reduction intensity, and the tourism industry will assume more environmental protection functions. The prediction results show that the peak time of tourism carbon in this scenario is about 2030, and the corresponding carbon emission peak is 2385.737×104 t, with an average annual change rate of -1.11%. Therefore, if the government restricts the carbon emission intensity of the tourism industry, the carbon emission of the Jiangxi Province tourism industry will reach its peak at a predetermined time under the condition of the green development of tourism industry.
In the low-carbon scenario, the social economy will develop with high energy saving and emission reduction intensity, and tourism development will be restricted by strict low-carbon policies. The forecasted results show that the peak carbon dioxide emissions time of tourism in this scenario is around 2025, and the corresponding peak carbon emission is 2285.325×104 t, with an average annual change rate of -1.58%. Therefore, if the government implements restrictive policies on the carbon emission intensity of tourism, energy conservation and emission reduction will become one of the key tasks of tourism development, and the carbon emission of tourism in Jiangxi will reach its peak before the scheduled time.
In summary, government intervention will have an important impact on the tourism industry in Jiangxi Province with regard to its achievement of the carbon peak. Only under the premise of a low carbon policy implemented by the government, can the tourism industry in Jiangxi achieve green development and achieve its carbon peak before 2030.

5 Discussion and conclusions

5.1 Discussion

Based on historical data, this paper establishes the STIRPAT model and finds that carbon emission intensity is the key factor affecting the carbon emission of tourism in Jiangxi Province, which is consistent with our previous research results (Wang et al, 2011). This finding reveals that the change of carbon emission intensity will be the key factor affecting whether the tourism in Jiangxi can achieve the goal of reaching its carbon peak as soon as possible in the future. At the same time, there are numerous studies on the carbon emissions of tourism in academic circles, but the studies on the carbon peaks of industries under multiple scenarios mainly involve the construction (Xu et al., 2021), transportation (Wang et al., 2019b) and other industries. There are few studies on the carbon peak of tourism, and they are only national-level studies (Tang et al., 2021). Compared with other industries, our research indicated that the carbon peak would be reached earlier, and earlier than the national tourism industry. One possible reason is that tourism is a tertiary industry, while construction is a secondary industry, and transportation is one of the industries with large emissions in the tertiary industry. Jiangxi Province is the leading demonstration area of ecological civilization in China. The forest coverage rate ranks second in the country, and the ecological environmental foundation is very excellent. In 2018, Jiangxi Province completed the delineation of the ecological protection red line. The area of the ecological protection zone is 46876 km2, accounting for 28.06% of the province’s land area, which lays a solid foundation for the realization of the “carbon peak and neutrality” goal of tourism in Jiangxi Province. In addition, unlike previous studies, this paper introduces the influencing factor of tourism investment to explore the impact of tourism investment on carbon emissions in historical periods, and in Jiangxi in the future, which enhances the scientific validity of the prediction results. This study provides a theoretical basis for helping the region to achieve the carbon peak of tourism in advance, and also provides an econometric basis for realizing the carbon neutralization of tourism.

5.2 Conclusions and suggestions

In this paper, the carbon emissions of the tourism industry in Jiangxi Province from 2000 to 2019 are calculated. At the same time, the LMDI decomposition method and Kaya equation are used to explore the factors influencing tourism carbon emissions. Based on the STIRPAT model, the peaks of tourism carbon emissions in Jiangxi under different scenarios are predicted and analyzed. Different regions have different low-carbon development policies and green resource endowments. The national “carbon peak and neutrality” research needs to fully consider these levels. This paper provides an empirical case with regional characteristics for the carbon emissions and carbon peaks of the national tourism industry, as well as the theoretical research methods of regional tourism carbon emissions and carbon peaks, which enriches the research system of the national tourism carbon peaks. The main conclusions are three-fold.
(1) The carbon emission of the Jiangxi tourism industry has increased rapidly in the past 20 years. The total amount increased from 71.365×10⁴ t in 2000 to 2342.456×104 t in 2019, with an average annual change rate of 21.09%. The growth rate showed a sharp decline from 2000 to 2004, and an upward trend from 2005 to 2019.
(2) Under the carbon constraint policy, the peak of tourism carbon dioxide emissions in Jiangxi Province can be sped up by 5-10 years. In the baseline scenario, the carbon dioxide emission of tourism in Jiangxi Province is expected to achieve a peak around 2035, with an average annual change rate of -0.88%. Under the medium- and low-carbon scenarios, the peak carbon dioxide emissions can be achieved around 2030 and 2025, with average annual change rates of -1.11% and -1.58%, respectively. These findings indicate that under the intervention of the government, through the restriction of carbon emission intensity with relevant low-carbon policies, the tourism carbon emission in Jiangxi will achieve the peak carbon dioxide emissions target as soon as possible, providing a good foundation for its tourism carbon neutrality.
(3) In different periods, the factors affecting tourism carbon emissions are different. In the past 20 years, the scale of tourism investment has been the main factor influencing tourism carbon emissions in Jiangxi Province. The most critical factor affecting the change in the tourism potential carbon emissions in Jiangxi Province is the intensity of carbon emissions, with an impact coefficient of 0.810, followed by tourism income, tourism number and tourism investment. This information provides ideas for the future management of tourism carbon emissions and related policies in Jiangxi Province.
Therefore, in order to ensure that the tourism industry in Jiangxi Province can achieve the “carbon peak and neutrality” goal as soon as possible, the government should strengthen policy guidance, formulate feasible carbon emission intensity constraint indicators, reasonably limit the use of non-low-carbon energy in tourism, and implement energy conservation supervision and law enforcement on the basis of fully considering the actual development needs of tourism. At the same time, we should expand investments in energy-saving and emission reduction facilities in tourism destinations, guide the entry of private capital, encourage tourism enterprises to increase their use of clean energy, and increase the amount of subsidies for low-carbon energy use in tourism. In addition, we should increase investments in major projects for ecological protection and the restoration of natural landscape tourism destinations, comprehensively carry out integrated protection and restoration of mountains, rivers, forests, fields, lakes and grass, and increase the carbon sink increment of tourism ecosystems.
Despite the improved methods, there are still some deficiencies in this study. Due to limitations in data availability, more research can be conducted on predicting the carbon peak times at the city and county levels, as well as the scenic sites. In addition, future studies are expected to further explore the factors influencing tourism carbon emissions, to more accurately assess the time when tourism reaches its carbon peak, and to promote the achievement of tourism “carbon peak and neutrality” goals.
[1]
Balsalobre-Lorente D, Driha O M, Shahbaz M, et al. 2020. The effects of tourism and globalization over environmental degradation in developed countries. Environmental Science and Pollution Research, 27(2): 1-15.

[2]
Balsalobre-Lorente D, Driha O M, Leitão N C, et al. 2021. The carbon dioxide neutralizing effect of energy innovation on international tourism in EU-5 countries under the prism of the EKC hypothesis. Journal of Environmental Management, 298: 113513. DOI: 10.1016/j.jenvm an.2021.113513.

[3]
Becken S, Patterson M. 2006. Measuring national carbon dioxide emissions from tourism as a key step towards achieving sustainable tourism. Journal of Sustainable Tourism, 14(4): 323-338.

[4]
Cadarso M A, Gómez N, López L A, et al. 2016. Calculating tourism’s carbon footprint: Measuring the impact of investments. Journal of Cleaner Production, 111: 529-537.

[5]
Feng L, Chen D, Gao S, et al. 2019. Responding to global warming: Mitigation policies and actions of stakeholders in China’s tourism industry. Journal of Resources and Ecology, 10(1): 94-103.

[6]
Hafeez M, Yuan C, Shahzad K, et al. 2019. An empirical evaluation of financial development-carbon footprint nexus in One Belt and Road region. Environmental Science and Pollution Research, 26: 25026-25036.

[7]
Han Z Y, Li T, Liu X M. 2021. Temporal and spatial characteristics and evolution of China’s inbound tourism carbon footprint. Journal of Resources and Ecology, 12(1): 56-67.

[8]
Hong Z, Wang L, Zhang C. 2021. Influencing factors of regional tourism ecological efficiency under the background of green development-taking the western region as an example. Acta Ecologica Sinica, 41(9): 3512-3524. (in Chinese)

[9]
Huang G Q, Wang Z L, Shi P F, et al. 2021. Study on the decoupling effect and spatial differentiation of tourism carbon emissions in the Yellow River Basin. China Soft Science, (4): 82-93. (in Chinese)

[10]
Huang H P, Qiao X Z, Zhang J. 2019. Analysis of temporal and spatial evolution of carbon emissions from tourism in Yangtze River Economic Belt. Guizhou Social Sciences, (2): 143-152. (in Chinese)

[11]
Isaeva A, Salahodjaev R, Khachaturov A, et al. 2021. The impact of tourism and financial development on energy consumption and carbon dioxide emission: evidence from post-communist Countries. Journal of the Knowledge Economy, 13: 773-786.

[12]
Jiao G Y, Zheng Y T, Ye Q. 2012. Temporal and spatial characteristics of tourism energy consumption and CO2 emission in Jiangxi Province. Journal of Central South University of Forestry and Technology, 32(10): 105-112. (in Chinese)

[13]
Lenzen M, Sun Y Y, Faturay F, et al. 2018. The carbon footprint of global tourism. Nature Climate Change, 8: 522-528.

[14]
Li S, Lv Z. 2021. Do spatial spillovers matter? Estimating the impact of tourism development on CO2 emissions. Environmental Science and Pollution Research, 28: 32777-32794.

[15]
Liu J, Feng T, Yang X. 2011. The energy requirements and carbon dioxide emissions of tourism industry of western China: A case of Chengdu City. Renewable & Sustainable Energy Reviews, 15: 2887-2894.

[16]
Liu J, Yue M T. 2021. Carbon emissions from regional tourism and its influencing factors-from the perspective of tourism mobility. China Population Resources and Environment, 31(7): 37-48. (in Chinese)

[17]
Ma H Q, Liu J L, Gong Z Q. 2019. Measurement and evolution mechanism of carbon emissions from tourism transportation in Shanxi Province. Economic Geography, 39(4): 223-231. (in Chinese)

[18]
Meng W, Xu L, Hu B, et al. 2017. Reprint of quantifying direct and indirect carbon dioxide emissions of the Chinese tourism industry. Journal of Cleaner Production, 163: 401-409.

[19]
Nosheen M, Iqbal J, Khan H. 2021. Analyzing the linkage among CO2 emissions, economic growth, tourism, and energy consumption in the Asian economies. Environmental Science and Pollution Research, 28: 16707-16719.

[20]
Pata U K, Balsalobre-Lorente D. 2021. Exploring the impact of tourism and energy consumption on the load capacity factor in Turkey: A novel dynamic ARDL approach. Environmental Science and Pollution Research, 29: 13491-13503.

[21]
Shao H Q, Wang Z F. 2020. Comprehensive measurement and spatial-temporal differentiation of carbon emission efficiency of tourism in Yangtze River Economic Belt. Resources and Environment of Yangtze River Basin, 29(8): 1685-1693. (in Chinese)

[22]
Sherafatian-Jahromi R, Othman M, Law S, et al. 2017. Tourism and CO2 emissions nexus in Southeast Asia: New evidence from panel estimation. Environment, Development and Sustainability, 19(4): 1407-1423.

[23]
Su J. 2019. Impact of tourism resource development based on low-carbon mode: A case study of Guizhou ethnic areas. Ecological Processes, (1): 288-294.

[24]
Sun J K, Zhang J H, Liu Z H, et al. 2015. Carbon emission measurement model and empirical analysis of regional tourism transportation. Acta Ecologica Sinica, 35(21): 7161-7171. (in Chinese)

[25]
Tang C C, Zha J P, Zhang J K, et al. 2021. Dual-carbon goal of China’s tourism industry under high-quality development: Evaluation & prediction, major challenges and realization path. Journal of Chinese Ecotourism, 11(5): 242-255. (in Chinese)

[26]
Tang C, Zheng Q, Qin N, et al. 2017a. A review of green development in the tourism industry. Journal of Resources and Ecology, 8(5): 449-459.

[27]
Tang C, Zhong L, Jiang Q. 2018. Energy efficiency and carbon efficiency of tourism industry in destination. Energy Efficiency, 11(3): 539-558.

[28]
Tang C, Zhong L, Ng P. 2017b. Factors that influence the tourism industry’s carbon emissions: A tourism area life cycle model perspective. Energy Policy, 109: 704-718.

[29]
Tang M, Ge S. 2018. Accounting for carbon emissions associated with tourism-related consumption. Tourism Economics, 24(5): 510-525.

[30]
Tang Z, Li X H. 2019. Influencing factors of carbon dioxide emissions from tourism in Heilongjiang Province based on STIRPAT Model. Ecological Economics, 35 (8): 141-145. (in Chinese)

[31]
Tao Y G, Huang Z F, Shi C Y. 2015. Carbon emission measurement of regional tourism transportation based on alternative bottom-up method. Acta Ecologica Sinica, 35(12): 4224-4233. (in Chinese)

[32]
UNWTO. 2009. Towards a low carbon travel and tourism sector. Davos, Switzerland: World Economic Forum, 2009: 3-36.

[33]
Wang J B, An B C, Ma G C, et al. 2019a. Calculation and influencing factors of carbon emission intensity of provincial tourism. Statistics and Decision-making, 35(18): 99-102. (in Chinese)

[34]
Wang L G, Liao W M, Huang M, et al. 2011. Calculation of tourism carbon footprint based on terminal consumption—Taking Jiangxi Province as an example. Ecological Economy, (5): 121-124, 168. (in Chinese)

[35]
Wang S, Wang G, Fang Y. 2016. Energy efficiency and influencing factors of tourism transport in China. Journal of Resources and Ecology, 7(4): 246-253.

[36]
Wang Y, Han S W, Li J Y, et al. 2019b. Empirical decomposition and scenario prediction of carbon peaks in five major transportation modes: Taking three northeastern provinces as examples. Resource Science, 41(10): 1824-1836. (in Chinese)

[37]
Weng G M, Li C H, Pan Y, et al. 2021. Decoupling effect and influencing factors of tourism carbon emissions in China. Geography and Geo-Information Science, 37(2): 114-120. (in Chinese)

[38]
Wu P, Tian M. 2016. On estimating transportation energy consumption and carbon dioxide emissions from off-shore island tourism—A case study of Haikou City, China. Journal of Resources and Ecology, 7(6): 472-479.

[39]
Wu P, Yue S. 2013. Research progress of tourism energy demand and carbon dioxide emission. Journal of Tourism Science, 28(7): 64-72. (in Chinese)

[40]
Xi J P. 2020. Carry forward the past and open a new journey of global response to climate change—Speech at Climate Ambition Summit. People ’ s Daily, 2020-12-13(1). (in Chinese)

[41]
Xu W, Ni J B, Sun D Y, et al. 2021. China’s construction carbon peak and carbon neutralization target decomposition and path analysis. Architectural Science, 37(10): 1-8, 23. (in Chinese)

[42]
Yao D, Ren L Y, Ma R F, et al. 2021. Spatial pattern and influencing factors of carbon emission intensity of tourism in Yangtze River Delta. Ecological Science, 40(2): 89-98. (in Chinese)

[43]
Yıldırım S, Yıldırım D C, Aydın K. et al. 2021. Regime-dependent effect of tourism on carbon emissions in the Mediterranean countries. Environmental Science and Pollution Research, 28: 54766-54780.

[44]
Zeng J, Zhang R, Tang J. et al. 2021. Ecological sustainability assessment of the carbon footprint in Fujian Province, southeast China. Frontiers of Earth Science, 15(1): 12-22.

[45]
Zhang Y, Pan J, Zhang Y. et al. 2021. Spatial-temporal characteristics and decoupling effects of China’s carbon footprint based on multi-source data. Journal of Geographical Sciences, 31(3): 327-349.

[46]
Zhou W. 2018. Forecast of China’s population trend in the next 30 years under the comprehensive two-child policy. Statistics and Decision, 34(21): 109-112. (in Chinese)

Outlines

/