Tourism Resources and Ecotourism

Performance Evaluation of Ecological Compensation at the County Level: A Case Study of Anyuan County in Dongjiangyuan Watershed, China

  • TANG Wenyue ,
  • WANG Qianguang , * ,
  • CHENG Hao ,
  • ZHU Zhenhong
Expand
  • Institute of Ecological Civilization, Jiangxi University of Finance and Economics, Nanchang 330013, China
*WANG Qianguang, E-mail:

TANG Wenyue, E-mail:

Received date: 2021-09-18

  Accepted date: 2022-01-30

  Online published: 2023-02-21

Supported by

The Humanities and Social Science Research Project of Ministry of Education of China(21YJAZH078)

The Humanities and Social Science Research Project of Ministry of Education of China(19YJA790080)

The Jiangxi Provincial Graduate Innovation Special Fund Project(YC2021-B138)

The Jiangxi University Humanities and Social Science Research Project(JJ18121)

Abstract

Watershed ecological compensation is an important means to protect the ecological environment and an important part of China’s ecological civilization construction. It can promote the sustainable and coordinated development of a region, enhance the advantages of the ecological environment in the upstream area, and lay the foundation for the high-quality development of ecological tourism in the upstream area. The accurate evaluation of the effect and efficiency of ecological compensation is a prerequisite for optimizing and perfecting the ecological compensation system. In order to evaluate the effect and efficiency of watershed ecological compensation, this paper used the case study area of Anyuan County, an important ecological area of the Dongjiangyuan watershed in the pilot area of China’s interprovincial watershed ecological compensation. This paper established an evaluation index system, used the entropy method and the data envelopment analysis (DEA) method to construct a watershed ecological compensation effect and efficiency evaluation model, and selected the ecological compensation index data from 2015 to 2020 to evaluate the effect and efficiency. This paper also constructed an econometric model to analyze their driving factors. The results showed that the effect of watershed ecological compensation was generally on the rise. Low pure technical efficiency (PTE) was the main reason for low comprehensive efficiency (CE), and the management efficiency of ecological compensation projects needs to be improved. The overall performance of scale efficiency (SE) was good, but there was still a problem of capital redundancy. Ecological compensation expenditure had a significant negative impact on the efficiency of ecological compensation, and ecotourism had a significant positive impact on the effect and efficiency of the ecological compensation. The results of this study can provide a scientific basis and theoretical reference for improving the effect and efficiency of watershed ecological compensation schemes.

Cite this article

TANG Wenyue , WANG Qianguang , CHENG Hao , ZHU Zhenhong . Performance Evaluation of Ecological Compensation at the County Level: A Case Study of Anyuan County in Dongjiangyuan Watershed, China[J]. Journal of Resources and Ecology, 2023 , 14(2) : 252 -264 . DOI: 10.5814/j.issn.1674-764x.2023.02.004

1 Introduction

Green development is an important way to achieve the harmonious coexistence and high-quality development of the economy and the environment. Ecological compensation is dedicated to seeking a balance of interests between the beneficiaries and providers of ecosystem services. Therefore, ecological compensation has become a key link in the national ecological civilization construction strategy. Watershed ecological compensation is an important type of ecological compensation, and an important means to protect the water environment and prevent water pollution. It refers to the internalization of environmental costs through various means to protect the watershed ecological environment in order to realize the reasonable allocation of watershed resources and the coordinated development of the watershed economy and society (Chang et al., 2013; Zhao, 2013). Evaluating the effect and efficiency of watershed ecological compensation is helpful for summarizing the experiences and lessons of the pilot projects and providing theoretical reference and practical experience for the transformation and upgrading of the watershed ecological compensation scheme.
In China, watershed ecological compensation has been implemented continuously since the 1990s. Typical projects have included the Three North Shelter Forest Project, the Dongjiangyuan Area Ecological Compensation Project, and the Qiandao Lake Ecological Compensation Project (Zheng and Zhang, 2006). In 2012, the State Council (2012) proposed implementing the most stringent water resource management system. In 2016, the General Office of the State Council (2016) issued the “Opinions on Improving the Compensation Mechanism for Ecological Protection”, and the Ministry of Finance and four other departments (2017) jointly issued the “Guiding Opinions on Accelerating the Establishment of a Horizontal Ecological Protection and Compensation Mechanism for the Upper and Lower Reaches of the Watershed”. In 2018, the National Development and Reform Commission and nine other departments issued the “Action Plan for Establishing a Market-oriented and Diversified Ecological Protection and Compensation Mechanism” (Ministry of Water Resources, 2019). In 2019, the National Development and Reform Commission (2019) issued the “Ecological Comprehensive Compensation Pilot Program”, emphasizing the importance of ecological compensation performance evaluation.
At present, the research on watershed ecological compensation tends to focus on the connotation, definitions of the subject and object, determination of standards, and evaluation, as well as the meaning of watershed ecological compensation. Ecological compensation is one of the incentives for watershed environmental protection. The compensation between the upstream and downstream areas of a watershed is realized through the use of specific laws, policies and market means, in order to achieve the internalization of the externality of the ecological protection of the watershed (Sun et al., 2021). Regarding the definitions of the subject and object of watershed ecological compensation, the purpose is to solve the problem of “who compensates whom”. Freeman (1994) analyzed the subject of compensation and the object of compensation from the perspective of stakeholders. The subject of compensation is the purchaser of ecosystem services, and the object of compensation is the provider of ecosystem services. Regarding the research on the determination of watershed ecological compensation standards, the research in this area is very rich. The methods for measuring watershed ecological compensation include the concepts of opportunity cost, willingness survey method and ecological benefit value (Costanza et al., 1997; Kaplowitz, 2001; Kosoy et al., 2007; Pagiola et al., 2007; Martin-Ortega et al., 2019; Song et al., 2020). Regarding the research on the evaluation of watershed ecological compensation, “extra gain” is emphasized. Wunscher and Engel (2012) noted that the goal of the compensation plan is emphasized when evaluating ecological compensation. The forest protection plans of Costa Rica and Mexico were evaluated by comparing the deforestation rates before and after the implementation of ecological compensation in the same area and whether ecological compensation was implemented in different areas (Alix-Garcia et al., 2008; Pfaff et al., 2008; Robalino et al., 2008). Another perspective for the evaluation of watershed ecological compensation is poverty reduction, since ecological compensation is closely related to poverty reduction. Miranda et al. (2003) used the Villa watershed in Costa Rica as an example and analyzed the social impact of ecological compensation schemes based on the framework of sustainable livelihoods. Pagiola et al. (2005) studied the impact of ecological compensation on the poverty problem in upstream areas and concluded that a reasonably designed ecological compensation system would help reduce poverty. In addition, there have been evaluations of the economic, social, and ecological benefits of ecological compensation (Peng, 2020; Wang et al., 2020; Von Thaden et al., 2021).
At present, there are various qualitative and quantitative methods for the evaluation of ecological compensation. The qualitative methods mainly use a comparative analysis method and questionnaire survey method to compare and analyze the watershed ecological compensation policy before and after implementation (Zhang et al., 2010; Yu et al., 2011). In quantitative research, the methods include the TOPSIS method, the cost-benefit method, data envelopment analysis (DEA), difference-in-differences (DID) model, analytic hierarchy process, difference coefficient method, entropy weight method, principal component analysis method, and fuzzy evaluation method (Govindan et al., 2014; Li and Li, 2015; Ma and Du, 2015; Geng et al., 2017; Chen et al., 2018; Jing and Zhang, 2018; Tang et al., 2018; Wang et al., 2020; Chen et al., 2021). Chen et al. (2018) used the AHP-DEA model to measure the efficiency of ecological compensation in the Yangtze River Economic Zone. Jing and Zhang (2018) used the DID method, taking the Xin’an watershed as an example, and concluded that the trans-provincial watershed horizontal ecological compensation mechanism could effectively promote the improvement of the ecological environment in the basin.
The rich research results of watershed ecological compensation have an important guiding role in the practice of watershed ecological compensation, but there are also some shortcomings. First, scholarly research on watershed ecological compensation has generally focused on the definitions of meaning, subject and object and the determination of standards, but it has been limited by the lack of examples from China’s watershed ecological compensation practice, which include relatively few results in evaluating the effects and efficiency of watershed ecological compensation policies. Second, there are few analyses of the impact of horizontal ecological compensation on the effect and efficiency of ecological compensation among existing studies. Third, when using the index system for evaluation, the subjective expert scoring method is typically used to assign the weights to each index, while the objective entropy method is rarely used to assign the weights.
As one of the few pilot watersheds for cross-provincial horizontal ecological compensation in China, ecological compensation in the Dongjiangyuan watershed has completed its first round of pilot projects. In addition, the Dongjiangyuan watershed mainly includes Anyuan County, Xunwu County and Dingnan County. The main body responsible for implementing watershed ecological compensation projects is the county. The county is at the middle level in China’s administrative system—it is managed by the city government and manages the township government. Therefore, the administrative power of the county government is very important in the Chinese political structure and is the main body of the project (Yang, 2015). There are three main reasons for adopting the entropy method in the indicator system of ecological compensation expenditure. First, the entropy value can objectively evaluate uncertain systems and avoid the subjectivity of index assignments. Second, the factors affecting the water resource environment are complex and nonlinear, which is suitable for the entropy method. Finally, the data sample size is small, so factor analysis and principal component analysis are not applicable. In addition, the reason for adopting DEA is that DEA can evaluate the decision-making unit without considering the functional relationship between input and output and obtain objective results. Therefore, this study took Anyuan County in the Dongjiangyuan watershed as an example, used the entropy method to assign weights to the indicators and evaluated the effects. On this basis, the DEA was used to measure efficiency and the effects of ecological compensation and the influencing factors of efficiency were analyzed. This study makes three main contributions. First, in terms of evaluation methods, the entropy method was used to assign weights, and then the DEA was used to calculate the efficiency. Therefore, the evaluation results are relatively objective. Second, it analyzed the impact of ecotourism on the performance of watershed ecological compensation. Third, in terms of policy implications, some effective countermeasures for achieving both the effect and the efficiency of the watershed ecological compensation could be put forward.
Therefore, the objectives of this study are three-fold:
(1) Reveal the overall effect, target level, criterion level and dynamic changes of the basin ecological compensation in Anyuan County, Dongjiangyuan Region;
(2) Reveal the dynamic changes of PTE, SE, and CE of the ecological compensation in Anyuan County, Dongjiangyuan Region;
(3) Analyze the factors affecting the effect and efficiency of the ecological compensation.

2 Research area and research methods

2.1 Case study area and data sources

2.1.1 Case study area

The Dongjiangyuan watershed is located in south-eastern Ganzhou City, Jiangxi Province, China. It mainly includes Anyuan, Xunwu, and Dingnan in Ganzhou. The downstream area of Guangdong Province is an economically developed area in China. Its source is the south side of Yajibo Mountain, and the length of the main river is approximately 127 km. In 2014, Jiangxi Province formulated and passed the “Ecology Protection Compensation Plan for Jiangxi Dongjiangyuan”. The Dongjiangyuan Region plan involves the three counties of Xunwu, Anyuan, and Dingnan in Ganzhou City, as well as Wenlong Town in Longnan County and Qingxi Township in Huichang County. The total planned area is 6273.14 km2, of which the drainage area is 3532.6 km2. In 2016, under the promotion of the state, the two provinces of Jiangxi and Guangdong signed the “Agreement on Horizontal Ecological Compensation for the Upstream and Downstream of the Dongjiang Watershed”. Thus far, the counties in the source area have invested a total of 3.3 billion yuan in ecological compensation funds. The investment projects include pollution control, soil erosion control, water source protection, and ecological restoration. According to the characteristics of the country's administrative system, the main body for the implementation and execution of the Dongjiangyuan watershed ecological compensation system is the county. Therefore, this paper uses Anyuan County, which is the key county town of the Dongjiangyuan watershed, as the case site for evaluating the effect and efficiency of ecological compensation.
Anyuan County is located in the south of Jiangxi Province, in the southeast of Ganzhou City. It has eight towns and ten townships under its jurisdiction. Huichang County is to the east, Xunwu County is to the southeast, Dingnan County is to the southwest, Xinfeng County is to the west, and Yudu County and Gan County are to the north, as shown in Fig. 1. Sanbai Mountain in Anyuan County is the birthplace of the Dongjiang River which provides drinking water for residents of Guangdong and Hong Kong. In recent years, Anyuan County has implemented the development concept of “Clear waters and green mountains are as valuable as mountains of gold and silver”, vigorously developed ecotourism, transformed green ecological resources into economic advantages, and taken the opportunity of Sanbai Mountain to create a national 5A-level tourist attraction. These efforts have continuously improved the tourism infrastructure, forming an ecotourism pattern with Sanbai Mountain Ecotourism as the core, and rural holiday tourism, agricultural sightseeing tourism, and Hakka food experience as supplementary options.
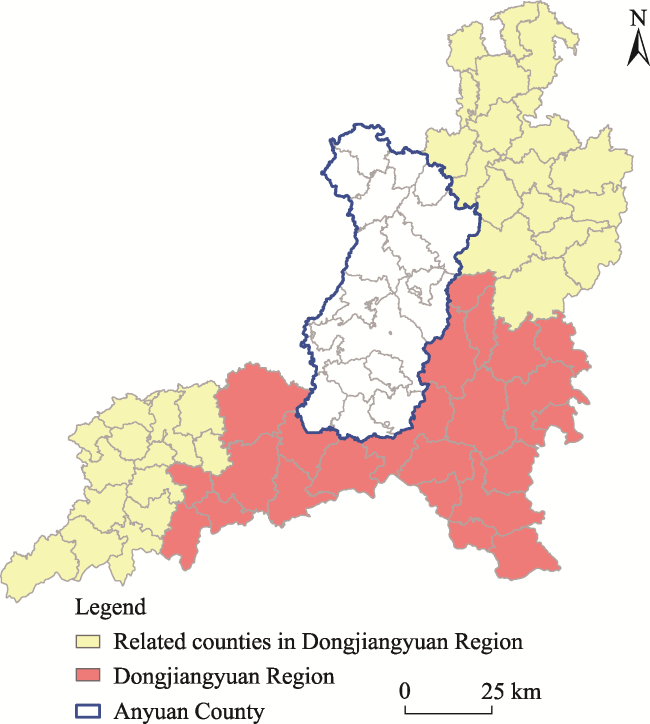
Fig. 1 Location of Anyuan County, Dongjiangyuan Region, China

2.1.2 Data sources

The original data for the 2015-2020 ecological compensation input and output indicators selected in this paper were mainly derived from field investigations in Anyuan County. The surveyed departments included the Development and Reform Commission, the Ecological Environment Bureau, the Agriculture and Rural Bureau, the Forestry Bureau, the Finance Bureau, the Water Conservancy Bureau, the Urban Management Bureau, and the Industry and Information Bureau of Anyuan County. In addition, some data were obtained from the “Anyuan County Statistical Yearbook” and the Anyuan County National Economic and Social Development Statistical Bulletin.

2.2 Index system, evaluation model and influencing factor analysis model

2.2.1 Index system

One system is the investment indicators, such as the ecological compensation expenditure in Anyuan County’s fiscal expenditure.
The second system is the output indicators. According to the overall implementation plan for ecological environmental protection and governance of the Dongjiang River Basin, ecological compensation funds are specifically used for water environmental protection and water pollution control, which covers pollution control, drinking water source protection, ecological restoration, etc. During the investigation in Anyuan County, we found that the ecological compensation projects can also be divided into two types: water environmental protection and water pollution protection. The ecological compensation projects specifically include river protection forests and river ecological environmental protection projects, water and soil conservation ecological management projects, wetland protection construction projects, low-efficiency forest renovation projects, subsidy projects for the closure and demolition of breeding plants, construction of township domestic sewage treatment plants, a river dredging and remediation connection project, a simple domestic waste landfill treatment project, shut down and transfer enterprise subsidy, and agricultural non-point source pollution and other pollution treatment projects. Therefore, we classified the special ecological compensation funds into the two types of water environmental protection and water pollution control as the target layer, and further subdivided it into the criterion layer and the indicator layer to form an indicator system. The expenditure indicator system is shown in Table 1.
Table 1 Ecological compensation output indicator system
Target layer Criterion layer Index layer Description Units
Water environmental protection Water ecological protection and restoration Aquatic product output Negative index t
Plantation area Positive index mu
Soil erosion control area Negative index km2
Water pollution prevention Urban and rural pollution prevention and control Sewage treatment rate Positive index %
Harmless treatment rate of garbage Positive index %
Industrial pollution prevention Industrial wastewater discharge Negative index t
COD emissions in industrial wastewater Negative index t
Ammonia nitrogen emissions from industrial wastewater Negative index t
Agricultural pollution prevention Amount of agricultural fertilizer Negative index t
Pesticide usage Negative index t

Note: The data are from investigations conducted by the Development and Reform Commission, Ecological Environment Bureau, Agriculture and Rural Bureau, Forestry Bureau, Finance Bureau, Water Conservancy Bureau, Urban Administration Bureau, Industry and Information Technology Bureau and other departments of Anyuan County. In addition, some data are from the “Anyuan County Statistical Yearbook”; 1 mu is equal to 0.067 ha.

2.2.2 Evaluation model

In this paper, the entropy method and the DEA were used in combination, and the entropy method was used to weight the ecological compensation output index system. On this basis, the DEA was then used to construct a watershed ecological compensation expenditure efficiency evaluation model.
(1) Entropy method
The entropy method is an objective weighting method which refers to the DEA of information entropy. This method can determine the weight of an indicator by calculating the information entropy of each indicator and the relationship between the relative change of each individual indicator and the whole. In other words, the weighting is performed according to the degree of differences between the standard values of each indicator to obtain the weight of each indicator, and the more the indicator changes, the greater its weight.
(2) DEA
DEA was first proposed by American scholars, including Charnes and others. It can be divided into the BCC model and the CCR model to evaluate the relative efficiency ratio of input and output in the decision-making unit. The difference between the BCC model and the CCR model is in the assumption of returns to scale. The BCC model assumes that the return to scale is variable, while the CCR model assumes that the return to scale remains unchanged. Obviously, the return to scale can be changed in line with the actual situation. We found that compared with the CCR model, the BCC model could more accurately determine the direction of improvements in the input and output, so this paper used a DEA-BCC model to measure the ecological compensation efficiency of Anyuan County.
The basic principles of the DEA-BCC model are as follows. Suppose that n sample is selected, then each sample is a decision-making unit (DMU), and each decision-making unit has m types of inputs and s types of outputs, where: i=1, 2,…, m; j=1, 2,…, n; r=1, 2,…, s.
The following formula can be used to evaluate the effectiveness of a certain decision-making unit:
$\text{min}\left[ \theta -\varepsilon \left( \underset{r=1}{\overset{s}{\mathop \sum }}\,S_{r}^{+}+\underset{i=1}{\overset{m}{\mathop \sum }}\,S_{i}^{-} \right) \right]$
$\text{s}\text{.t}\text{.}\left\{ \begin{array}{*{35}{l}} \underset{j=1}{\overset{n}{\mathop \sum }}\,{{\lambda }_{j}}{{X}_{ij}}+S_{i}^{-}=\theta {{X}_{i0}},\begin{matrix} {} & {} \\ \end{matrix}S_{i}^{-}\ge 0 \\ \underset{j=1}{\overset{n}{\mathop \sum }}\,{{\lambda }_{j}}{{Y}_{rj}}-S_{r}^{+}={{Y}_{i0}},\ \begin{matrix} {} & {} \\ \end{matrix}S_{r}^{+}\ge 0 \\ \underset{j=1}{\overset{n}{\mathop \sum }}\,{{\lambda }_{j}}=1,\begin{matrix} {} & {} \\ \end{matrix}{{\lambda }_{j}}\ge 0~ \\ \end{array} \right.$
where: $\theta $ is the technical efficiency of the decision-making unit; $\varepsilon $ is an infinitesimal amount; ${{\lambda }_{j}}$ is the decision variable; ${{X}_{ij}}$ is the total input of the j-th decision-making unit to the i-type input; ${{Y}_{rj}}$ is the total output of the j-th decision-making unit for the r-type output; $S_{i}^{-}$ is the slack variable of input; $S_{r}^{+}$ is the slack variable of output; ${{X}_{i0}}$ is the input value of a certain decision-making unit; ${{Y}_{i0}}$ is the output value of a certain decision-making unit.
The basic conclusions are:
When $\theta =1$, $S_{i}^{-}=0$, and $S_{r}^{+}=0$, a certain decision- making unit is valid for DEA;
When $\theta =1$, and $S_{i}^{-}$ and $S_{r}^{+}$ are not all zero, a certain decision-making unit is effective for weak DEA;
When $\theta <1$, a certain decision-making unit is invalid.
The evaluation steps are as follows.
1) According to the characteristics of the ecological compensation project in Anyuan County and referring to related documents, an output indicator system of ecological compensation in Anyuan County was constructed.
2) The output indicator weight was calculated.
Different indicators have different units, and there are positive and negative indicators that cannot be directly compared; thus, dimensionless processing is required. Dimensionless processing methods include the extreme value method and the standardization method. This study adopted the extreme value method, which keeps all index values in the 0-1 interval. Using the extreme value method, the following formula can be used for positive indicators:
${{{x}'}_{ij}}=({{x}_{ij}}-{{m}_{j}})/({{M}_{j}}-{{m}_{j}})$
where ${{M}_{j}}$ is the maximum value of ${{x}_{ij}}$, and ${{m}_{j}}$ is the minimum value of ${{x}_{ij}}$.
For negative indicators, the following formula can be used:
${{{x}'}_{ij}}=\left( {{M}_{j}}-{{x}_{ij}} \right)/\left( {{M}_{j}}-{{m}_{j}} \right)$
In addition, it should be noted that for the purpose of the calculation, ${{{x}'}_{ij}}$ cannot be zero or negative. After dimensionless processing, translation is required, where ${{{x}'}_{ij}}=$ ${{{x}'}_{ij}}+\alpha $, and $\alpha $ should be as small as possible; thus, this study used $\alpha =0.0001$.
The characteristic proportion of the first index year is calculated as follows:
${{p}_{ij}}={{{x}'}_{ij}}/\underset{i=1}{\overset{n}{\mathop \sum }}\,{{{x}'}_{ij}}$
Entropy calculation. The entropy of the first indicator is as follows:
${{e}_{j}}=-\frac{1}{\ln n}\underset{i=1}{\overset{n}{\mathop \sum }}\,{{p}_{ij}}\ln {{p}_{ij}},0\le {{e}_{j}}\le 1$
The coefficient of difference is as follows:
${{g}_{j}}=1-{{e}_{j}}$
The formula to determine the index weight is as follows:
${{w}_{j}}={{g}_{j}}/\underset{j=1}{\overset{m}{\mathop \sum }}\,{{g}_{j}},j=1,2,\cdots,m$
The formula to calculate the comprehensive score of the output indicators is as follows:
$S=\underset{j=1}{\overset{m}{\mathop \sum }}\,{{w}_{j}}\times {{{x}'}_{ij}}$
3) Based on the DEA-BCC model, the efficiency of ecological compensation expenditure in Anyuan County from 2015 to 2020 was calculated and evaluated using Deap2.1 software.

2.2.3 Analysis model of influencing factors

In this study, we established an econometric model to explore the factors affecting the comprehensive score and comprehensive efficiency of Anyuan County's ecological compensation effect.
The econometric model is as follows:
${{y}_{t}}={{\beta }_{0}}+{{\beta }_{1}}{{I}_{t}}+{{\beta }_{2}}{{T}_{t}}+{{\mu }_{t}}$
Where t represents year, ${{\beta }_{0}}$ is a constant,${{\mu }_{t}}$ represents the random error term, and ${{y}_{t}}$ refers to the comprehensive score or comprehensive efficiency of the ecological compensation effect of Anyuan County in the t year. Regarding the influencing factors,${{I}_{t}}$ refers to the ecological compensation expenditure of Anyuan County in the t year, and ${{T}_{t}}$ represents the tourism income of Anyuan County in the t year.
As ecological compensation expenditure comes from government financial funds, the ecological compensation expenditure reflects the government's guidance on ecological environmental governance. The greater the investment, the stronger the motivation to guide residents, enterprises and environmental protection social organizations to participate, so that the effect and efficiency of ecological compensation will be improved. However, according to the economic principles of diminishing marginal effects (Guo, 2020), with more ecological compensation investment, the problem of capital redundancy will occur, resulting in the inefficient use of funds. Therefore, this study assumes that ecological compensation expenditure is positively correlated with the effect of ecological compensation; and the ecological compensation funds are bound within a certain limit, so the higher the ecological compensation expenditure, the higher the CE of ecological compensation, but after a certain value, the ecological compensation expenditure has a negative effect on the CE of ecological compensation.
The development of tourism is a double-edged sword for the destination ecological environment (Wu et al., 2021). Excessive development of tourism resources will destroy the local ecological environment. However, in recent years, people are keen on ecological environmental protection, which has enabled the development of new tourism models such as ecotourism and reduced the conflict between tourism and the environment. Therefore, the development of ecotourism can promote the sustainable development of the tourism industry and is also a driving force for promoting ecological environmental protection. Anyuan County has been vigorously developing ecotourism in recent years and has formed an ecotourism pattern with Sanbai Mountain ecotourism as the core, and rural holiday tourism, agricultural sightseeing tourism, and the Hakka food experience as supplements (Shao, 2019). The development of ecotourism brings an increase in income to Anyuan County on the one hand,, but it also requires Anyuan County to protect the ecological environment better on the other hand, thereby helping Anyuan County to improve the effect and efficiency of ecological compensation. Therefore, this study assumes that ecotourism is positively related to the effect of ecological compensation; and ecotourism is also positively related to the efficiency of ecological compensation.

3 Analysis of evaluation results

3.1 Analysis of the effect of ecological compensation

After the calculations, the weights of each index under the entropy method are obtained, and at the same time, an output index table of each level of ecological compensation in Anyuan County is obtained, as shown in Table 2.

3.1.1 Overall evaluation results

The comprehensive scores of the 2015-2020 ecological compensation effects calculated by the entropy method are shown in Table 2. Overall, the comprehensive score declined slightly in 2019 and increased year-by-year from 2015 to 2018, with the largest increase in 2015-2016. In general, the output effect of ecological compensation in Anyuan County shows a fluctuating upward trend.
Table 2 Anyuan County ecological compensation output index score table
Target layer Criterion layer Index layer Weight 2015 2016 2017 2018 2019 2020
Water environmental protection Water ecological protection and restoration Aquatic product output 0.1130 0.1130 0.0925 0.0527 0.0416 0.0231 0.0000
Plantation area 0.1044 0.0827 0.0285 0.0338 0.0589 0.0000 0.1044
Soil erosion control area 0.1027 0.0000 0.0992 0.1027 0.0818 0.0175 0.0893
Subtotal 0.3201 0.1957 0.2202 0.1892 0.1823 0.0406 0.1937
Water pollution prevention Urban and rural pollution prevention and control Sewage treatment rate 0.0817 0.0000 0.0331 0.0418 0.0495 0.0535 0.0817
Harmless treatment rate of garbage 0.0649 0.0000 0.0649 0.0649 0.0649 0.0649 0.0649
Subtotal 0.1466 0.0000 0.0980 0.1067 0.1144 0.1184 0.1466
Industrial pollution prevention Industrial wastewater discharge 0.0672 0.0000 0.0568 0.0633 0.0672 0.0476 0.0594
COD emissions in industrial wastewater 0.0653 0.0000 0.0565 0.0629 0.0624 0.0653 0.0598
Ammonia nitrogen emissions from industrial wastewater 0.0658 0.0000 0.0638 0.0658 0.0658 0.0652 0.0540
Subtotal 0.1983 0.0000 0.1771 0.1920 0.1954 0.1781 0.1732
Agricultural pollution prevention Amount of agricultural fertilizer 0.1755 0.0000 0.0009 0.0426 0.1533 0.1625 0.1755
Pesticide usage 0.1595 0.0000 0.0087 0.0318 0.1209 0.1264 0.1597
Subtotal 0.3350 0.0000 0.0096 0.0744 0.2742 0.2889 0.3352
Subtotal 0.6799 0.0000 0.2847 0.3731 0.5840 0.5854 0.6550
Overall 1.0000 0.1957 0.5049 0.5623 0.7663 0.6260 0.8487

3.1.2 Target-level evaluation results

The comprehensive scores of the two target layers of water environmental protection and water pollution prevention are shown in Table 2. The results show that the overall score of water environmental protection fluctuated from 2015 to 2020. Among the years, it remained stable from 2015 to 2018, dropped sharply from 2018 to 2019, and then rebounded sharply from 2019 to 2020. The comprehensive score of the water pollution prevention and control target level increased year-by-year from 2015 to 2020. Among the years, 2015-2018 had a large increase, and the 2018-2020 growth trend slowed down, but remained at a high level. Based on the comparison of the comprehensive scores of these two target levels, Anyuan County attaches great importance to pollution prevention and control in the ecological compensation work, but is relatively insufficient for promoting environmental protection.
Further analysis of the comprehensive scores of the environmental protection index layer, as shown in Table 2, indicated that the index scores of the aquatic product output, artificial afforestation area and soil erosion control area are quite different. Among them, the score of aquatic product output has declined year-by-year from 2015 to 2020; the score of planted afforestation area generally shows a downward trend from 2015 to 2020, and then a rebound trend, a sharp decline in 2015-2016, a small increase in 2016-2018, a sharp decline in 2018-2019, and a sharp rebound in 2019-2020. The score of the area under water and soil erosion control rose sharply from 2015 to 2016, remained stable from 2016 to 2018, dropped sharply from 2018 to 2019, and rebounded sharply from 2019 to 2020. These changes show that Anyuan County lacks in the promotion of aquaculture de-stocking, and artificial afforestation generally does not receive enough attention. The control of soil erosion has received attention in the years other than 2015 and 2019, and that work has achieved remarkable results. These results indicated that the lack of water environmental protection is mainly due to the unsatisfactory implementation and promotion of aquaculture de-stocking projects and artificial afforestation projects.

3.1.3 Evaluation results of each criterion level of water pollution prevention and control

According to the results in Table 2, a more in-depth analysis of pollution prevention and control in the target layer was then performed. This analysis found that the three standard levels of pollution prevention and control target levels, i.e., urban and rural pollution prevention, industrial pollution prevention, and agricultural pollution prevention, have improved overall from 2015 to 2020. Specifically, the urban and rural pollution control score was zero in 2015, and rose sharply from 2015 to 2016. After that, it was generally stable from 2016 to 2020, with a slight increase. The trend in the prevention and control of industrial pollution is similar to that of urban and rural pollution. In 2015, it was zero, and it rose sharply from 2015 to 2016. It remained stable from 2016 to 2018. Then there was a slight upward trend, but a downward trend for the two consecutive years from 2019 to 2020. The trend of agricultural pollution prevention and control is quite different from the previous two. It remained at a relatively low level from 2015 to 2016, increased sharply from 2016 to 2018, and then remained stable from 2018 to 2020 with a certain increase. These results show that Anyuan County is generally better in pollution prevention and control, but industrial pollution prevention and control has declined for the two consecutive years of 2019 and 2020.
In order to further analyze the downward trend of industrial pollution prevention and control in 2018-2020, the index level scores of industrial pollution prevention and control were examined, as shown in Table 2. The score of industrial wastewater discharge increased sharply from 2015 to 2016, remained stable and slightly increased from 2016 to 2018, declined sharply from 2018 to 2019, and then rebounded significantly from 2019 to 2020. COD emissions in industrial wastewater rose sharply from 2015 to 2016, remained stable in 2016-2019, increased slightly, and then declined in 2019-2020. The score of ammonia nitrogen emissions in industrial wastewater is similar to that of COD emissions in industrial wastewater. It increased sharply in 2015-2016, maintained a steady increase in 2016-2019, and then declined in 2019-2020. In summary, we believe that the declines in industrial pollution control scores in 2019 are mainly due to the sharp drop in the industrial wastewater discharge scores in 2019. The decline in 2020 is mainly due to the significant declines in industrial wastewater emissions, COD emissions in industrial wastewater, and ammonia nitrogen emissions in industrial wastewater compared with 2018.

3.2 Analysis of ecological compensation efficiency

Watershed ecological compensation has always been an important task of Anyuan County. This study selected Anyuan County’s ecological compensation expenditure from 2015 to 2020 as the input indicator, and the expenditure indicator target level water environmental protection and water pollution prevention as the two output indicators, used the software DEAp2.1 to perform efficiency calculations, and the results are shown in Table 3. Under the DEA, the CE is decomposed into PTE and SE, and the reasons for the lack of efficiency can be found from the perspectives of technology and scale.
Table 3 Results of the ecological compensation efficiency in Anyuan County, Dongjiangyuan Region
Year CE PTE SE Return to scale
2015 0.292 0.293 0.995 Decrease
2016 0.981 1.000 0.981 Decrease
2017 1.000 1.000 1.000 Constant
2018 0.579 0.661 0.876 Decrease
2019 0.770 0.880 0.875 Decrease
2020 0.855 1.000 0.855 Decrease
Average 0.746 0.806 0.930

3.2.1 Analysis of PTE

The data in Table 3 show that the PTE of ecological compensation expenditures in Anyuan County in 2016, 2017 and 2020 were 1, indicating that the PTE was at the optimal state in these years. The PTE values in 2015, 2018 and 2019 were all less than 1. Comparing the values of these three years, 2015 was the smallest, followed by 2018, and again in 2019. In the past six years, the average PTE of Anyuan County was 0.806. From the perspective of input and output indicators, the ecological compensation expenditure was the largest in 2015. However, seven of the output indicators were the most unsatisfactory in six years. The seven indicators are sewage treatment rate, waste harmless treatment rate, agricultural fertilizer application, pesticide use, industrial wastewater discharge, industrial wastewater medium COD emissions, and ammonia nitrogen emissions in industrial wastewater. Only the three indicators of soil erosion control area, aquatic product output and artificial afforestation area performed well. This analysis shows that there were serious management problems in pollution prevention and control in ecological compensation in 2015. The ecological compensation expenditure in 2018 was the largest, except for 2015. Among the output indicators, the output of aquatic products was not ideal, and the other indicators improved. This shows that there were some management problems in environmental protection in 2018, and pollution control had been improved. Ecological compensation expenditures in 2019 were average, the output of aquatic products and the area of artificial afforestation in the output indicators were not ideal, and the area of soil erosion control was excellent. These indicators show that environmental protection needed to be improved in 2019.
In 2016 and 2017, Anyuan County’s ecological compensation expenditure was less, only about one-third of that in 2015. However, the sewage treatment rate, waste innocuous treatment rate, agricultural fertilizer application, pesticide use, COD emissions in industrial wastewater, and ammonia nitrogen emissions in industrial wastewater in its output indicators were all better than in 2015. The PTE levels in 2016 and 2017 were relatively good. The ecological compensation input in 2020 was almost the same as in 2019. However, indicators such as sewage treatment rate, pesticide use, artificial afforestation area, and industrial wastewater discharge were better than they were in 2019. The efficiency value in 2020 was at its best state, relatively. In short, the efficiency of the ecological compensation management in 2016, 2017 and 2020 was relatively high, but the management efficiency in 2015, 2018, and 2019 needed to be improved.

3.2.2 SE analysis

The SE value is the ratio of the CE to the PTE. If it does not reach the effective value of 1, then the increasing or decreasing trend of return to scale can be estimated to control the scale of the ecological compensation expenditure. As shown in Table 3, the SE of ecological compensation expenditure in Anyuan County was 1 in 2017, and the SE values of the remaining years were less than 1. The average SE is 0.93, which is lower than the average level in 2018, 2019 and 2020. The scale and efficiency of ecological compensation expenditure in Anyuan County were the best in 2017. Each unit of expenditure brings the most output and is in the stage of constant returns to scale. The five-year SE in 2015, 2016, 2018, 2019, and 2020 was in the stage of diminishing returns to scale. These results show that the increase in ecological compensation output was smaller than the increase in expenditure, and there was redundancy in the ecological compensation expenditure. Therefore, based on the situation in 2015, 2016, 2018, 2019 and 2020, the future expenditure of ecological compensation should be appropriately controlled, and the allocation of funds should be appropriately optimized to improve the SE of the ecological compensation.

3.2.3 CE analysis

CE is the product of SE and PTE, and an efficiency value of 1 means effective. An efficiency value less than 1 means invalid, indicating that there is a problem of redundant input and insufficient output, which needs to be adjusted. According to the calculation results in Table 3, the year with the highest CE was 2017, and the efficiency value was 1. The lowest year was 2015, and the efficiency value was only 0.292. The average CE is 0.746, the CE value is close to the PTE value, and the change is basically the same as the PTE. The CE of ecological compensation expenditure is mainly affected by PTE. Therefore, in order to improve the CE, Anyuan County should pay attention to the improvements of the ecological compensation system and management level.

3.2.4 Analysis of the improvement of ecological compensation efficiency

Technical means can provide PTE. Therefore, the PTE of Anyuan County’s ecological compensation expenditure in 2015-2020 can be improved and analyzed to improve the CE. The PTE in 2015, 2018 and 2019 was relatively ineffective, and the data on its improvement are shown in Table 4.
Table 4 Improvement of ecological compensation efficiency in Anyuan County, Dongjiangyuan Region
Year Index Original data Target data Slack variable
Input redundancy value Under-output value
2015 Water environmental protection 0.196 0.196 0 0
Water pollution prevention 0 0 0 0
Ecological compensation expenditure 185.69 54.45274 ‒131.22274 0
2018 Water environmental protection 0.182 0.193 0 0.01
Water pollution prevention 0.584 0.584 0 0
Ecological compensation expenditure 141.65 93.69475 ‒47.96525 0
2019 Water environmental protection 0.041 0.193 0 0.152
Water pollution prevention 0.585 0.585 0 0
Ecological compensation expenditure 106.83 93.95874 ‒12.87126 0

Note: The unit of ecological compensation expenditure is million yuan.

From the perspective of investment indicators, if the PTE in 2015, 2018 and 2019 were to be fully effective, they would need to be reduced by 131.22274 million yuan, 47.96525 million yuan, and 12.87126 million yuan, respectively. From the perspective of output indicators, environmental protection would need increased output values of 0.01 and 0.152 in 2017 and 2018, respectively, while pollution prevention and control can remain unchanged.

4 Analysis of influencing factors

Based on Formula (10) we can use the multiple regression model to analyze the mechanism of influence of various factors on the comprehensive score and CE of Anyuan County's ecological compensation effect. The comprehensive effect score calculated by the entropy method is between 0 and 1, and the efficiency value obtained by the DEA is also between 0 and 1. The model in which these two are the explained variables is the restricted model. If the ordinary least squares (OLS) model is used for regression, the parameter estimation may be biased and inconsistent. Therefore, this study chose the Tobit model and ran the regression using Stata16.0 software. The regression results are shown in Table 5.
Table 5 Regression results
Variable Comprehensive score of ecological compensation effect CE of ecological compensation
I -0.088 (0.094) -0.517*** (0.028)
T 0.016** (0.04) -0.004** (0.001)
Constant 0.349* (0.149) 1.233*** (0.044)

Note: The standard errors are in parentheses. ***, ** and * indicate significance at the levels of 1%, 5% and 10%, respectively.

According to the regression results in Table 5, the impact of ecological compensation expenditure on the efficiency of ecological compensation has a negative relationship, which is significant at the 1% statistical level, and this is consistent with the hypothesis. This result confirms the previous analysis of the efficiency of ecological compensation, the redundancy problem of ecological compensation expenditure, and the urgent need to improve the efficiency of the ecological compensation expenditure. The effect of the ecological compensation expenditure on ecological compensation did not pass the significance test, which is inconsistent with the hypothesis. The possible reasons may be that there is a serious redundancy problem in the ecological compensation expenditure funds, or the projects invested in ecological compensation expenditures cannot play a role in enhancing the effect of ecological compensation.
The effect of tourism income on ecological compensation and the efficiency of ecological compensation are both significant at the 5% statistical level, showing a positive correlation, which is consistent with the hypothesis. This result shows that Anyuan County vigorously develops ecotourism, which brings economic benefits to the local area on the one hand, and it can promote the protection of the ecological environment on the other hand. In order to promote the development of ecotourism, the local area must pay attention to the protection and improvement of the ecological environment, and improve the effect and efficiency of ecological compensation. Therefore, the development of tourism can play a good role in promoting economic development and environmental protection.

5 Discussion and conclusions

5.1 Discussion

The evaluation of the effect of watershed ecological compensation in Anyuan County, Dongjiangyuan Region, shows that the overall effect improved from 2015 to 2020. During the ecological compensation period in the Xiaoqing River Basin, the benefits of water quality improvement, climate regulation, and water conservation were obvious, and the improvement of the ecological compensation effect in the basin was similar to this study (Li and Ge, 2019). The overall effect of the implementation of the ecological compensation policy in the Xin’an River Basin from 2012 to 2014 was relatively good and similar to this study (Wang et al., 2020). From 2008 to 2015, the comprehensive ecological compensation effect of the four counties in the Xiaohong River Basin showed an upward trend, which is also similar to this study (Meng et al., 2019). Therefore, the results of this study indicate to a certain extent that watershed ecological compensation has a positive effect and improves the ecological environmental quality of the upstream area.
The evaluation of the efficiency of watershed ecological compensation in Anyuan County, Dongjiangyuan Region, yields an SE evaluation value of 0.93, which indicates a good overall performance, but there is still a problem of fund redundancy. The PTE is low, with an average value of 0.806. The CE of ecological compensation mainly depends on PTE, so the improvement of PTE is the key to improving CE. Zhang et al. (2020) took the Xin’an River basin as an example and showed that the improvement of the CE of that area required the improvement of PTE and the improvement of SE, which is similar to the results of this paper. Therefore, improving the efficiency of watershed ecological compensation needs to start with strengthening the management of ecological compensation expenditures and optimizing and adjusting the ecological compensation projects.
The analysis of the factors influencing the effect and efficiency of ecological compensation indicated that ecotourism has a significant positive impact on the effect and efficiency of ecological compensation. A study by Wu et al. (2021) on the coordinated development of tourism-economy-environment coupling in Guangdong Province showed that eco-tourism can reduce the conflict between tourism and the environment, and the development of eco-tourism is the driving force for promoting ecological environmental protection, which is similar to the results of this paper. Therefore, eco-tourism has a positive effect, and the development of eco-tourism helps to improve the effect and efficiency of ecological compensation.

5.2 Conclusions

The basic conclusions of the study are three-fold.
(1) The results of the effect analysis show that from an overall perspective, Anyuan County was on the rise from 2015 to 2020 against the background that the People’s Governments of Jiangxi and Guangdong Provinces signed the “Agreement on Horizontal Ecological Compensation for the Upstream and Downstream of the Dongjiang River Basin”. The overall water environment has improved. From a target perspective, water pollution prevention and control are continuously improving, and water environmental protection is showing a trend of shocks. Water environmental protection is not as strong as water pollution prevention and control, especially for aquaculture de-stocking projects and artificial afforestation projects. From the perspective of the standards of water pollution prevention and control goals, urban and rural pollution prevention and agricultural pollution prevention and control have gradually improved, and industrial pollution prevention and control gradually increased in 2015-2018 and declined in 2019 and 2020. This reflects a certain degree of contradiction and conflict between the protection of water resources and the development of the industrial economy.
(2) The efficiency analysis results show that from the perspective of PTE, there were three years of low management efficiency from 2015 to 2020, which shows that the management efficiency of ecological compensation projects in Anyuan County needs to be improved urgently. From the perspective of SE, except for 2017, the returns to scale from 2015 to 2020 were diminishing returns. The redundancy phenomenon of ecological compensation expenditure was more prominent. From the perspective of CE, the trend is similar to PTE, and the key to improving CE is to improve PTE.
(3) The analysis of influencing factors shows that ecological compensation expenditure has a significant negative impact on the efficiency of ecological compensation, and ecological compensation expenditure has not passed the significance test on the effect of ecological compensation. This proves that there is a redundancy problem in the ecological compensation expenditure in the efficiency analysis. Ecotourism has a significant positive impact on the effect and efficiency of ecological compensation, which illustrates the positive effect of ecotourism on ecological environmental protection.

6 Policy implications and limitations

6.1 Policy implications

In the context of the second round of horizontal ecological compensation for the upstream and downstream areas of the Dongjiang River in Jiangxi and Guangdong provinces, in order to improve the effect and efficiency of ecological compensation, three policy implications are drawn based on the conclusions of this paper.
(1) Optimize and adjust ecological compensation projects. First, in view of the current lack of water environmental protection, when arranging ecological compensation projects, we should appropriately slant them towards aquaculture de-stocking and artificial afforestation projects in water environmental protection. Second, in response to the decline in industrial pollution prevention and control, the investment in environmental protection facilities in industrial parks should be increased. Finally, the investment in ecological compensation projects that have redundancy problems should be appropriately reduced.
(2) Strengthen the management of ecological compensation expenditures. First, the management and decision-making ability of ecological compensation projects should be improved, experts and the public should be brought into the decision-making process, and the blindness of the project should be reduced. For example, the opinions of experts and the public are widely listened to in the planning process. On this basis, a reasonable plan for ecological compensation is formulated. Second, the management method of ecological compensation expenditure should be formulated and strictly implemented to reduce the arbitrariness of expenditures.
(3) The development of eco-tourism, can transform the existing ecological environmental advantages into industrial advantages, promote the realization of the value of ecological products, accelerate the conversion of green waters and green mountains to golden mountains and silver mountains, and increase the income level of local people on the one hand; and on the other hand, it can force the government to improve the local ecological environment further and enhance the effect and efficiency of ecological compensation.

6.2 Limitations

The index system and methods used in this article are scientifically valid and objective, and the suggestions for improving the effect and efficiency of ecological compensation based on this are pertinent and feasible. However, there are still some areas for improvement.
(1) This article only measures the effect and efficiency of watershed ecological compensation in Anyuan County, Dongjiangyuan Region, from 2015 to 2020. Therefore, the research results have time limitations, and only reflect the ecological compensation situation of Anyuan County from 2015 to 2020. The judgment and predictions of the development trends before 2015 and in the future need to be further tracked and studied.
(2) This article uses Anyuan County, an important county in the Dongjiangyuan basin, as a case study area, but the study area is relatively small. In the future, it is possible to conduct comparative studies on the effects and efficiency of the whole Dongjiangyuan watershed by county, obtain a comprehensive understanding of the implementation and operation of the entire Dongjiangyuan watershed ecological compensation project, and provide more systematic watershed ecological compensation policy suggestions.
[1]
Alix-Garcia J, De Janvry A, Sadoulet E. 2008. The role of deforestation risk and calibrated compensation in designing payments for environmental services. Environment and Development Economics, 13(3): 375-394.

[2]
Chang L, Xu D W, Hou T S, et al. 2013. On the intergovernmental river basin ecological compensation mechanism of across administration area. Science-Technology and Management, 15(2): 92-97. (in Chinese)

[3]
Chen T G, Liu F, Yang Y. 2021. Performance evaluation and influence factors of ecological compensation policy in the Yangtze River Basin: The case study of Hubei and Guizhou provinces. Journal of Natural Resources, 36(12): 3144-3155. (in Chinese)

[4]
Chen W, Yu X H, Xiong X. 2018. Study on the measurement of ecological compensation efficiency of government led river basins: A case study of major coastal cities in the Yangtze River Economic Belt. Jiang-huai Tribune, (3): 43-50. (in Chinese)

[5]
Costanza R, d’Arge R, de Groot R, et al. 1997. The value of the world’s ecosystem services and natural capital. Nature, 387(6630): 253-260.

[6]
Freeman R E. 1994. The politics of stakeholder theory: Some future directons. Business Ethics Quarterly, 4(4): 409-421.

[7]
General Office of the State Council. 2016. Opinions of the General Office of the State Council on improving the ecological protection compensation mechanism. Contemporary Rural Finance and Economics, (6): 44-46. (in Chinese)

[8]
Geng X Y, Ge Y X, Wang A M. 2017. Study on comprehensive benefit evaluation of ecological compensation in water source areas: A case study of Lake Yunmeng in Shandong Province. Issues in Agricultural Economy, 38(4): 93-101, 112. (in Chinese)

[9]
Govindan K, Kaliyan M, Kannan D, et al. 2014. Barriers analysis for green supply chain management implementation in Indian industries using analytic hierarchy process. International Journal of Production Economics, 147: 555-568.

[10]
Guo Q H. 2020. Comparative analysis of the efficiency of regional financial technology investment based on DEA-Tobit analysis method. Diss., Tianjin, China: Tianjin University of Finance and Economics. (in Chinese)

[11]
Jing S W, Zhang J. 2018. Can Xin’anjiang River Basin horizontal ecological compensation reduce the intensity of water pollution? China Population, Resources and Environment, 28(10): 152-159. (in Chinese)

[12]
Kaplowitz M D. 2001. Assessing mangrove products and services at the local level: The use of focus groups and individual interviews. Landscape and Urban Planning, 56(1-2): 53-60.

[13]
Kosoy N, Martinez-Tuna M, Muradian R, et al. 2007. Payments for environmental services in watersheds: Insights from a comparative study of three cases in central America. Ecological Economics, 61(2-3): 446-455.

[14]
Li C H, Ge Y X. 2019. Study on comprehensive benefit evaluation of two-way ecological compensation in river basins: A case study of Xiaoqing River Basin in Shandong Province. Shandong Social Sciences, (12): 85-90. (in Chinese)

[15]
Li Q P, Li C J. 2015. Study on the measurement of ecological compensation efficiency of watershed water resources: A case study of Yichang City in Central China. Seeker, (10): 34-38. (in Chinese)

[16]
Ma Q H, Du P F. 2015. Evaluation on the effect of ecological compensation in Xin’an River Basin. Chinese Journal of Environmental Management, 7(3): 63-70. (in Chinese)

[17]
Martin-Ortega J, Dekker T, Ojea E, et al. 2019. Dissecting price setting efficiency in payments for ecosystem services: A meta-analysis of payments for watershed services in Latin America. Ecosystem Services, 38: 100961. DOI: 10.1016/j.ecoser.2019.100961.

[18]
Meng Y, Zhang K, Gao F H, et al. 2019. Comprehensive evaluation of ecological compensation effect in Xiaohong River Basin based on combination weight model. Water Saving Irrigation, (10): 64-67. (in Chinese)

[19]
Ministry of Finance, Ministry of Environmental Protection, Development and Reform Commission, et al. 2017. Guiding opinions on accelerating the establishment of a horizontal ecological protection and compensation mechanism for the upper and lower reaches of the watershed. Gazette of the Ministry of Finance of the People ’ s Republic of China, (4): 54-56. (in Chinese)

[20]
Ministry of Water Resources. 2019. Nine departments including the National Development and Reform Commission, the Ministry of Finance, and the Ministry of Water Resources jointly issued the “Action Plan for Establishing a Market-oriented and Diversified Ecological Protection and Compensation Mechanism”. Journal of Economics of Water Resources, 37(1): 64. (in Chinese)

[21]
Miranda M, Porras I T, Moreno M L. 2003. The social impacts of payments for environmental services in Costa Rica: A quantitative field survey and analysis of the Virilla Watershed. London, UK: International Institute for Environment and Development.

[22]
National Development and Reform Commission. 2019. Ecological comprehensive compensation pilot program. Energy Saving of Nonferrous Metallurgy, 35(6): 1-2. (in Chinese)

[23]
Pagiola S, Arcenas A, Platais G. 2005. Can payments for environmental services help reduce poverty? An exploration of the issues and the evidence to date from Latin America. World Development, 33(2): 237-253.

[24]
Pagiola S, Ramirez E, Gobbi J, et al. 2007. Paying for the environmental services of silvopastor practices in Nicaragua. Ecological Economics, 64(2): 374-385.

[25]
Peng Y T. 2020. Comprehensive benefit evaluation of ecological compensation for water source areas in Xin’an River Basin. Jiang-huai Tribune, (5): 75-82. (in Chinese)

[26]
Pfaff A, Robalino J, Sanchez-Azofeifa G A. 2008. Payments for environmental services: Empirical analysis for Costa Rica. Durham, USA: Duke University.

[27]
Robalino J, Pfaff A, Sanchez-Azofeifa G A, et al. 2008. Deforestation impacts of environmental services payments: Costa Rica’s PSA Program 2000-2005. Washington, USA: Environments for Development.

[28]
Shao Y F. 2019. “Six Steps Ahead” plays the strongest voice in poverty alleviation: The practice and results of poverty alleviation in Anyuan County. Old District Construction, (9): 31-35. (in Chinese)

[29]
Song X Y, Liu Y Q, Zhong F L, et al. 2020. Payment criteria and mode for watershed ecosystem services: A case study of the Heihe River Basin, Northwest China. Sustainability, 12(15): 6177. DOI: 10.3390/su12156177.

[30]
State Council. 2012. Opinions of the State Council on implementing the strictest water resources management system. Western Resources, (1): 28-30. (in Chinese)

[31]
Sun F H, Zhang X J, Gao X, et al. 2021. Cooperative mechanism of trans-stream ecological compensation evolution based on reputation effect. Resources & Industries, 23(1): 87-96. (in Chinese)

[32]
Tang P P, Zhang X L, Hu Y Y. 2018. The construction and application of ecological compensation performance evaluation system in water source area: Based on empirical analysis of Hanjiang water source area in middle route of the South-North Water Transfer Project. Ecological Economy, 34(2): 170-174. (in Chinese)

[33]
Von Thaden J, Manson R H, Congalton G, et al. 2021. Evaluating the environmental effectiveness of payments for hydrological services in Veracruz, Mexico: A landscape approach. Land Use Policy, 100: 105055. DOI: 10.1016/j.landusepol.2020.105055.

[34]
Wang H J, Bi F F, Dong Z F. 2020. Evaluation of ecological compensation policy for Xin’an River Basin based on AHP-Fuzzy comprehensive method. Acta Ecologica Sinica, 40(20): 7493-7506. (in Chinese)

[35]
Wu Q, Xie R P, Song C. 2021. Research on the coordinated development of tourism, economy and environment in Guangdong Province. Ecological Economy, 37(4): 140-146, 155. (in Chinese)

[36]
Wunscher T, Engel S. 2012. International payments for biodiversity services: Review and evaluation of conservation targeting approaches. Biological Conservation, 152: 222-230.

[37]
Yang J. 2015. The research of supervision and accountability mechanism of county governments under the system of province directly governing county. Diss., Changsha, China: Hunan Normal University. (in Chinese)

[38]
Yu L J, Ge L Y, Liang Y X. 2011. Evaluation of the water environment ecological compensation mechanism and implementation effect in Henan Province. Environmental Pollution & Control, 33(4): 87-90. (in Chinese)

[39]
Zhang J, Ni C H, Zhu M M. 2020. Study on the financial expenditure efficiency of ecological compensation in Xin’an River Basin. Chinese Journal of Environmental Management, 12(4): 112-119. (in Chinese)

[40]
Zhang L Z, Dang W Q, Zheng H, et al. 2010. Implimention effect evaluation and mechanism of soil and water conservation eco-compensation in Yellow River Basin. Bulletin of Soil and Water Conservation, 30(3): 176-181. (in Chinese)

[41]
Zhao Y. 2013. Research on willingness to payment and payment behavior of ecological compensation of trans-regional river basin: Taking Liaohe River as an example. Diss., Dalian, China: Dalian University of Technology. (in Chinese)

[42]
Zheng H X, Zhang L B. 2006. Chinese practices for ecological compensation and payments for ecological and environmental services and its policies in river basins:Washington DC, USA: The World Bank.

Outlines

/