Tourism Resources and Ecotourism

Spatial and Temporal Changes and Influencing Factors of Tourism Resilience in China’s Provinces under the Impact of COVID-19

  • YU Jinyan , 1, 2 ,
  • ZHANG Yingnan 1, 2 ,
  • ZHANG Yahui 1, 2 ,
  • JIANG Yixuan , 1, 2, *
Expand
  • 1. China Academy of the Belt and Road Initiative, Beijing International Studies University, Beijing 100024, China
  • 2. Beijing Key Laboratory of the Belt and Road Data, Beijing 100024, China
*JIANG Yixuan, E-mail:

YU Jinyan, E-mail:

Received date: 2021-10-23

  Accepted date: 2022-04-16

  Online published: 2023-02-21

Supported by

The National Natural Science Foundation of China(42101180)

The General Project of Scientific Research Program of Beijing Education Commission(SM202110031001)

Abstract

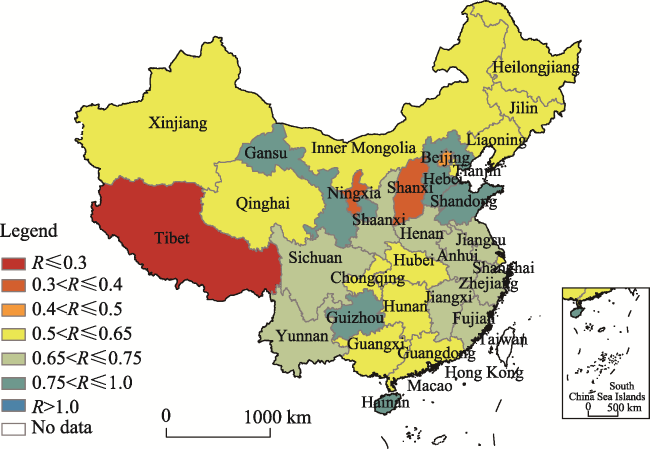
COVID-19 has led to the interruption of personnel flow, and the tourism industry has become one of the most seriously affected industries. With the gradual improvement of the domestic epidemic situation, the tourism industry has recovered in various provinces and regions, but that recovery shows the characteristics of temporal and spatial heterogeneity. From the perspective of “resilience”, this study characterizes the resistance and recovery of the tourism industry in the face of the epidemic impact, analyzes the trends of change, spatial pattern and phased characteristics of tourism resilience, and explores the factors influencing the differences in tourism resilience. The results indicate that China's tourism industry shows obvious resilience characteristics, and the trend of tourism resilience in most provinces and regions fluctuates and rises. For example, Gansu, Hainan, Guizhou, Hebei and Shandong have a high level of comprehensive toughness, while Tibet, Ningxia, Shanxi and Beijing have a very low level of comprehensive toughness, and most other provinces and regions show the characteristic pattern of “weak in the north and strong in the south”. This study shows that China's tourism resilience has experienced three stages: hard resistance, accelerated recovery and increasing with fluctuation. The resistance of the tourism industry to the impact of the epidemic is generally weak, and the ability to recover is significantly variable. The severity of the epidemic, the strictness of prevention and control policies, the joint influences of tourist source-destination, tourism foundation, geographical location and other factors will have a certain impact on tourism resilience.

Cite this article

YU Jinyan , ZHANG Yingnan , ZHANG Yahui , JIANG Yixuan . Spatial and Temporal Changes and Influencing Factors of Tourism Resilience in China’s Provinces under the Impact of COVID-19[J]. Journal of Resources and Ecology, 2023 , 14(2) : 217 -229 . DOI: 10.5814/j.issn.1674-764x.2023.02.001

1 Introduction

Since 2020, the global spread of COVID-19 has impacted most industries to different degrees. The various prevention and control measures, such as national martial law, traffic control, closure of scenic spots and personnel isolation, have severely weakened the mobility of people around the world, thus making tourism one of the hardest hit industries. According to the statistics, the global tourism industry lost 1.3×10¹² USD in revenue in 2020, which is almost 11 times the loss during the global crisis in 2009 (World Tourism Organization, 2021). The number of domestic tourists in 2020 was 2.879×10⁹, a decrease of 3.022×10⁹ over the same period in the previous year, or 52.1% (Ministry of Culture and Tourism, 2021). The tourism industry showed significant vulnerability under the impact of such public health emergencies. On the other hand, with the overall easing of the domestic epidemic situation in a state of flux, the tourism industry has been showing a certain recovery trend. In 2021, the total number of domestic tourists was 3.246×10⁹, an increase of 367×106 or 12.8% over the same period of the previous year, returning to 54.0% of the 2019 level (Ministry of Culture and Tourism of the People’s Republic of China, 2022). As an important part of the national economy, identifying the performance characteristics of tourism under the impact of public health emergencies, and determining the factors influencing its vulnerability and recovery ability are of great significance for promoting the high-quality and sustainable development of tourism in the post-epidemic era, so as to ensure the steady development of China’s economy.
The concept of “resilience” (“elasticity”) originated from ecology (Holling, 1973), where the tolerance and response of ecosystems to different types of changes was expressed as “resilience”. Subsequently, the concept of resilience has been widely used in psychology, engineering, the social sciences and other disciplines. With the deepening of research, scholars have generally recognized that its concept is not only “maintaining stability and restoring the original state” as covered by “engineering resilience” and “ecological resilience”, but also “renewing, transforming, establishing a new growth path, resisting risks”, which is emphasized by adaptive resilience based on an evolutionary perspective (Hu, 2012). In the research of Martin (2012) and other scholars, the concepts of vulnerability, resistance, robustness, and recovery ability are supplemented or re-emphasized, as well as the four processes of resistance, recovery, redirection, and path reconstruction. In the research on evolutionary economic geography, based on the analysis of the resilience and adaptability of the global production network, micro- and meso-theories related to resilience have been constructed, and its application scope has been extended to the field of the tourism industry (Vanchan et al., 2018). In research on the tourism industry, the concept of resilience is proposed based on the sustainable development of the tourism industry, which has the research goal of “improving the industrial construction capacity of tourism destinations and helping them to recover to an ideal state after emergencies” (Basurto-Cedeo and Pennington-Gray, 2018). Feng (2010) found that the impact of the international financial crisis on China’s tourism showed three stages: risk initial stage, comprehensive outbreak stage and gradual recovery stage, which confirmed the existence and phased characteristics of tourism resilience. Most foreign literature equates tourism resilience with the recovery ability of tourism, but also pays attention to the vulnerability, response to the impact and resistance of tourism at the same time (Espiner et al., 2017; Knight, 2017). Combined with the above relevant research, this paper defines tourism resilience as: the ability of the tourism destination to respond, adapt, change and even transform relevant impacts under various shocks, so as to achieve the sustainable development of tourism, including its resistance and recovery.
In general, the existing related research can be divided into three scales: macro research on tourism systems and destinations (McKercher and Chon, 2004; Mason et al., 2005; Joo et al., 2019), meso research on tourism organizations and the industrial value chain (Roy et al., 2016; Wieczorek-Kosmala, 2022), and micro individual research on employees, tourists and residents in the community and the tourism industry (Bui et al., 2021). Among them, most studies on the resilience of tourism destinations focus on the impact of interference factors such as climate change (Bec et al., 2015; Scott et al., 2016) and natural disasters on tourism demand and tourist flow in a certain region. Some studies expand the scope to political, social and economic aspects (Knight, 2017), including terrorist attacks (Liu and Pratt, 2017), financial risks, etc., and further carry out tourism resilience assessments and mechanism analysis (Dogru et al., 2019), and formulate policy recommendations (Jarratt and Davies, 2020). In related research, geospatial analysis is an important method, involving the scale factors considered in the research; and the mechanism analysis of the factors influencing tourism resilience is the focus of tourism resilience research in tourist destinations.
In terms of the geospatial analysis of tourism resilience, some scholars pay special attention to the role of community structure and behavior on the tourism resilience of aboriginal tourism areas, heritage reserves and other special tourism areas (Rahmawati et al., 2014; Maureira and Stenbacka, 2015; Espeso-Molinero and Pastor-Alfonso, 2020). Such studies are more focused on a single national or regional level (Cellini and Cuccia, 2015; King et al., 2021). Bhati et al. (2016) analyzed the challenges brought by national disasters (economic crisis, health hazards, natural disasters and/or terrorist acts) to the tourism industry of the five Association of Southeast Asian Nations (ASEAN) countries (Singapore, Indonesia, Thailand, the Philippines and Malaysia) and the effectiveness of the measures taken by those countries to deal with the catastrophic events, which enriched the research on the spatial heterogeneity of tourism resilience. However, there are few relevant studies in China which focus on the measurement of urban tourism resilience and the analysis of influencing factors (Zhan and Gai, 2018). Wang et al. (2020) evaluated the temporal and spatial evolutionary characteristics of the resilience of the tourism economic system in various provinces and regions of China, and further deepened the understanding of tourism resilience from the perspective of geography. After the outbreak of COVID-19, the studies of tourism resilience have become more abundant (Bui et al., 2021; Sharma et al., 2021), and the geospatial analysis of tourism resilience has attracted more and more attention. Feng et al. (2021) put forward a set of index systems and approaches that can be used in research on tourism resilience, and clarified the important explanatory significance of geospatial analysis for tourism resilience. Watson and Deller (2022) simulated how the dependence on tourism affects regional economic resilience based on the constructed model. That study found that, on the whole, regional tourism dependence is negatively correlated with economic resilience, although the opposite is true in some regions. Based on this, the spatial heterogeneity of tourism resilience in various regions of the United States was described and explained.
In terms of the mechanism of tourism resilience and policy suggestions, it has been shown that post-disaster recovery may bring the creation of new products, the improvement of image and the enrichment of local knowledge, so as to promote the sustainable development of tourism. Effective cooperation among local stakeholders, including the public sector, the private sector and other non-governmental or community-based organizations, can enhance the tourism resilience of destinations by improving their ability to recover (Chan et al., 2020). After the COVID-19 outbreak, the research on factors affecting tourism resilience is more abundant. The government response, technological innovation, tourism substitution in nearby areas, and consumer and employee confidence are widely considered to be important factors affecting regional tourism resilience in the post-epidemic period (Brouder, 2020; Hall et al., 2020; Mao et al., 2020; Tremblay-Huet, 2020). Based on the analysis of influencing factors, Sheller et al. (2020) explored several ways to rebuild tourism in the current climate crisis in small island countries and non-independent territories in the Caribbean region after eliminating COVID-19, and set a model for the practical application of related mechanism research.
On the whole, the existing research on the temporal and spatial characteristics of tourism resilience is still inadequate (Dogru et al., 2019), especially analyses based on the provincial or urban scale. As the COVID-19 pandemic continues to spread, the research on the regional differentiation characteristics and influencing factors of tourism resilience needs to be improved, so as to support the tourism industry’s revitalization. This study characterizes the spatial and temporal characteristics of tourism resilience in various provinces and regions in China, and identifies key factors that affect tourism resilience. The formulation of tourism development strategies for different regions will provide support for improving the overall toughness level of China’s tourism industry.

2 Data and methods

2.1 Data sources and processing

As it is difficult to obtain detailed data on the number of tourists and tourism revenue, the core data for this study on the measurement of tourism resilience is the operating revenue of star hotels in each quarter of each province, which comes from the quarterly National Star Hotel statistical report issued by the Ministry of Culture and Tourism of the People’s Republic of China. It should be noted that the operating income of star-rated hotels can only reflect the situation of the tourism industry to a certain extent as it only reflects the income brought by tourists’ accommodation, but cannot represent the tourism activities that occur without the accommodation demand of star hotels. The data collected covers the period from the first quarter of 2018 to the second quarter of 2021, and includes the data of 31 provincial administrative regions in China (hereinafter referred to as “provinces and regions”) excluding Hong Kong Special Administrative Region, Macao Special Administrative Region and Taiwan. After preliminary sorting, the following characteristics were found.
In order to more clearly show the overall changes in the revenue of star hotels in various provinces and regions across the country before and after the epidemic, only the trends of the top three, the middle three, the last three provinces and regions in the ranking of pre-epidemic star hotel revenue, and the national average of star hotel revenue are displayed (Fig. 1). In the first wave of COVID-19, the revenue of the nationwide star-rated hotels declined, and then it rose gradually. Under the impact of the second wave of the epidemic, the decline of operating income decreased, showing that it had a certain toughness. Before the outbreak of the epidemic, the operating revenue of national star hotels was relatively stable, and the national total operating revenue remained at about 49 thousand million yuan in each quarter of 2018 and 2019. In each year, the total operating revenue of national star hotels shows an overall upward trend over time. In the fourth quarter of 2018, it increased by 7.9% compared with the first quarter, and then resumed growth after decreasing by 17.3% in the first quarter of 2019. The overall operating revenue in 2019 increased by 13.4%. Due to the strong impact of COVID-19 in early 2020, the total revenue of the star hotels in the first quarter dropped by 63.9%, and the vulnerability of the national tourism industry under the epidemic situation was highlighted. Subsequently, the total operating revenue continued to rise. In the fourth quarter of 2020, the total revenue increased by 107.1% compared with the first quarter. The tourism industry gradually recovered and developed well, but it was still at a lower level than before the epidemic. In the first quarter of 2021, the total operating revenue of national star hotels decreased compared with the previous quarter, but increased by 52% compared with the first quarter of 2020. In the second quarter of 2020, the total operating revenue still maintained an upward trend, with a year-on-year increase of 71% in the second quarter of 2020. Therefore, although the epidemic has caused a serious blow to the domestic tourism industry, it still maintains a trend of continuous growth of tourism revenue over time, and the overall level shows an increasing trend year by year. This change not only includes the internal trend characteristics of the tourism industry changing with the quarters, but also highlights the internal motivation of resilience to promote the tourism industry to gradually return to normal, which is worthy of further discussion.
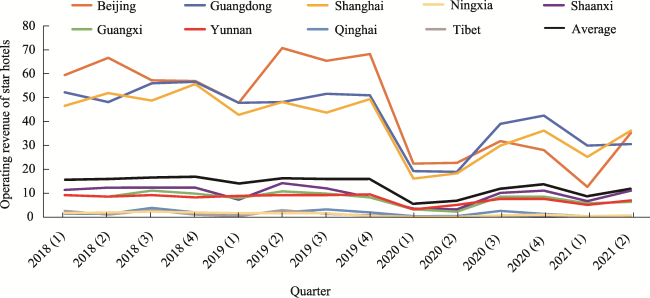
Fig. 1 Changes in operating revenue of star hotels

2.2 Resilience measurement model

Referring to the resilience measurement model of Zhou et al. (2019), the “time axis integral of the change range of operating income of star hotels”, which integrates the time change and time accumulation, is defined as the “resilience characterization quantity”. Based on this, the tourism resilience measurement model is constructed, and its basic expression is:
$R=\frac{S'}{S'+\Delta S}=\frac{\int_{t1}^{t2}{f'(t)\text{d}t}}{\int_{t1}^{t2}{f(t)\text{d}t}}$
where R is the resilience index, S' represents the time axis integral of the predicted trajectory, ∆S represents the time axis integral of the difference between the actual trajectory and the predicted trajectory, t is the time, f'(t) is the actual trajectory of the epidemic impact, f (t) is the predicted trajectory without the epidemic situation, and t1 and t2 are time points, as shown in Fig. 2.
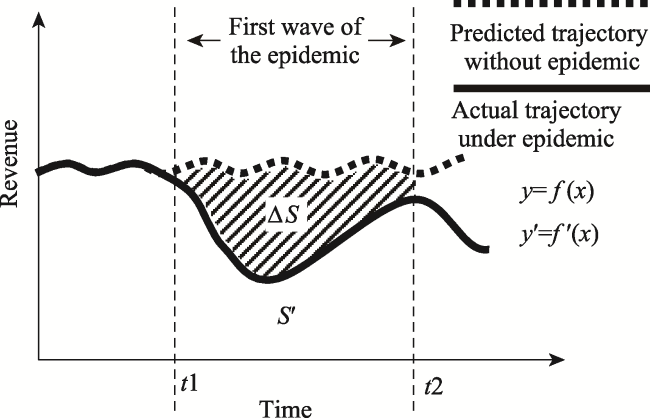
Fig. 2 Schematic diagram of resilience measurement
Formula (1) is the general formula of the resilience measurement, and different time periods correspond to resilience indexes with different connotations. The tourism resilience of the whole investigation period from the first quarter of 2020 to the second quarter of 2021 is defined as the comprehensive tourism toughness index. The tourism toughness from the beginning of a wave to a specific time point is defined as the time section resilience index (noting that the first wave was in 2020 and the second wave was in the first two quarters of 2021). Generally, the larger the R value, the smaller the ΔS value and the stronger the tourism resilience, and vice versa. If R=1, this indicates that the epidemic had no significant impact on tourism; if R>1, the revenue of star hotels is higher than predicted, which may be due to major technological progress, improvement of management efficiency, the launch of innovative tourism products and other reasons which establish a new growth path. For ease of expression, the “resilience index” mentioned in this study refers to the resilience index of a certain time section unless otherwise specified.

3 Comprehensive characteristics of tourism resilience

3.1 Increases in tourism resilience with fluctuations

Generally, the national tourism resilience gradually increased over time in 2020. After a slight decline in the first quarter of 2021, it resumed an upward trend in the second quarter. The resilience index increased from 0.39 to 0.67, which shows that the fundamental improvement of the epidemic situation has helped tourism to resume. After the first round of the epidemic hit the country, the introduction and implementation of various prevention and control policies greatly affected the flow of personnel, but at the same time they fundamentally reversed the epidemic situation, and the tourism industry as a whole was slowly recovering. At the beginning of 2021, the tourism industry was hit again due to the second wave of the large-scale winter epidemic, but the resilience index only dropped slightly, almost the same as in the fourth quarter of 2020, and it quickly increased to a new high in the second quarter. The seven provinces and regions of Zhejiang, Jiangsu, Henan, Yunnan, Hainan, Jiangxi and Jilin, are completely consistent with the overall trend of tourism resilience, accounting for only 21.88% of the total sample.
The tourism resilience trends of most other provinces are quite different, and the “partial outbreak” of the epidemic and corresponding control policies are important reasons why. For example, as is shown in Fig. 3, the resilience index of 14 provinces (municipalities directly under the Central Government) declined in the second quarter of 2020, of which Hubei had the largest decline, exceeding 0.1 (the declines in the other regions were below 0.1). As the first outbreak location of the epidemic, Wuhan of Hubei took on strict lockdown measures which were not fully lifted until April 2020. After the measures were lifted, its tourist attraction still declined due to the impact of the epidemic. In addition, Hubei Province did not lower its response level of public health emergencies from level 1 to level 2 until June 2020, with all existing confirmed and suspected cases being cleared to zero. The severe impact of the epidemic and the long period of prevention and control are the main reasons for the significant decline in tourism resilience in Hubei. In the third quarter of 2020, only Xinjiang’s tourism resilience declined, mainly due to the outbreak of the epidemic in Xinjiang from July to August of that year and the implementation of extremely strict prevention and control measures. Major cities such as Urumqi were almost in a fully “closed” state, and tourism revenue declined more severely. In the first quarter of 2021, the resilience of tourism in 11 provinces and regions across the country declined. Among them, the Beijing Tourism Resilience Index had a largest drop, by 0.19. Under the uncertain situation that the first case of the British mutant virus was discovered in January 2021, as the capital, Beijing had tightened the control of the epidemic during the “two festivals” in winter, New Year’s Day and the Spring Festival, and advocated that travel agencies and online travel companies should not organize travel teams to enter Beijing, and that scenic spots in Beijing strictly control the number of reservations, which resulted in a significant decline in tourism resilience in the second quarter of 2021. The tourism resilience of most other provinces and regions maintained an upward trend in the first quarter of 2021. The increase in tourism resilience in Gansu exceeded 0.2 and the resilience level exceeded 1, ranking first among all provinces. Gansu was a relatively low-endemic area, and products such as “Gansu Lunar New Year” tour group and independent travel were launched during the Spring Festival, making Gansu one of the most popular tourist destinations for the Spring Festival, and the revenue of star hotels even exceeded the pre-epidemic level. In the second quarter of 2021, only the four provinces (municipalities directly under the Central Government) of Tianjin, Gansu, Qinghai, and Tibet experienced a slight decline in tourism resilience (none of which declined by more than 0.04), and the country generally maintained an upward trend.
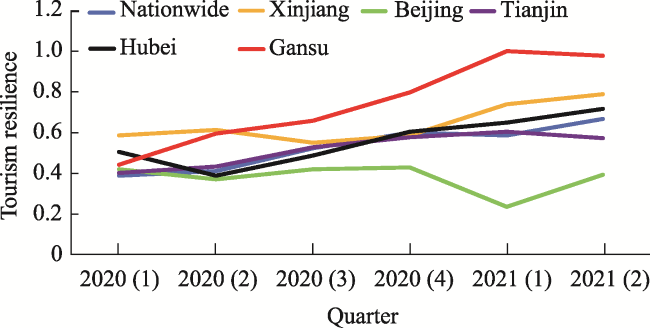
Fig. 3 Different provinces and regions representative of the tourism resilience trends

3.2 The spatial pattern of comprehensive tourism resilience

The spatial pattern of comprehensive tourism resilience during the study period is shown in Fig. 4. In terms of specific provinces and regions, the provinces with comprehensive tourism resilience over 0.75 during the study period included Gansu, Hainan, Guizhou, Hebei, and Shandong. Many factors allowed them to have a high level of tourism resilience. Among them, Gansu, Hainan, and Guizhou were provinces with relatively light epidemics and obvious advantages in tourism characteristics; while Hebei relies on the strong tourism consumption demand of Beijing and Tianjin, and Shandong relies on the recovered customer source from it and neighboring provinces such as Jiangsu, so their tourist industries showed strong resilience as a whole. The provinces with low comprehensive tourism resilience were Tibet, Ningxia, Shanxi, and Beijing, with resilience values below 0.5. The reasons for the low level of tourism resilience in each of these provinces were different. Among them, Ningxia, Tibet, and Shanxi are all provinces with poor tourism development levels. The weak tourism transportation infrastructure construction and related operation and maintenance, the unreasonable proportion of star hotels’ operating income, the lack of tourism management professionals, the insufficient development of tourism resources, the incomplete supporting facilities, the lack of publicity and many other issues significantly magnified the adverse impact of the national epidemic on their tourism industries, so they became the provinces with the lowest level of comprehensive tourism resilience. As the capital, the main reason for the low tourism resilience of Beijing was that its epidemic prevention and control measures were always extremely strict. Since the outbreak of the “epidemic of Xinfadi” in June 2020, the prevention and control of personnel movement has been strictly tightened, and the Civil Aviation Administration issued a “fuse instruction”. The mobility of people inside and outside the city has been severely weakened, and the tourism industry has also suffered a relatively large blow. In short, due to many considerations and factors such as transportation convenience and tourism experience quality, passengers would be less likely to choose the above-mentioned provinces as their travel destinations when there were fewer travel opportunities.
The comprehensive tourism resilience values of most other regions were between 0.5-0.75, showing the overall pattern of “weak north and strong south”, but Guangdong, Guangxi, Hunan, Hubei, Chongqing and Shanghai were less resilient than other southern regions, showing certain particularity. The three northeastern provinces, Inner Mongolia and Xinjiang are located in the northern border regions of China, which were facing certain risks of imported cases during the epidemic. For example, the main epidemic risk threat of China in April 2020 was the imported cases from Russia. Heilongjiang Province accounts for the largest number of imported cases which caused a locally-associated epidemic. Also, there were cases imported from Russia into Inner Mongolia in November 2020, and an epidemic of cold-chain food imports in Tianjin during the same period. Relevant prevention and control measures would severely hinder the inflow of tourists and affect the development of the local tourism industry. In addition, the tourism foundations of most northern regions are relatively weaker than those of the south, especially due to the geographical location, and the tourism industry of northern cities in China is under greater pressure in autumn and winter. Coupled with the repeated anticipation of the winter epidemic, people’s willingness to choose northern cities as tourist destinations had become weaker, which to a certain extent inhibited the recovery of the tourism industry in northern China. Therefore, Beijing was more severely affected, while Shandong and Qinghai also showed a consistent trend of revenue decline in the fourth quarter of 2020. The “Matthew Effect” of the tourism industry under the impact of emergencies was manifested. Among the southern provinces, Hubei Province has been most affected by the epidemic, and its tourism industry has also suffered a greater impact. At the same time, it has affected neighboring areas such as Chongqing and Hunan since it is the main source of tourists. The average revenues of star hotels before the epidemic in Guangdong and Shanghai were ranked second and third. The scale of tourism was relatively large, but the resilience performance under the epidemic was mediocre. Similarly, the reason is that these two places are important transportation hubs at home and abroad, and the mobility of people is extremely high under normal circumstances. Under the control of the epidemic, there was a large loss of foreign tourists, and the high risk of cases imported from overseas further affected the recovery of tourism in these areas. The main source of tourists from other provinces in Guangxi is Guangdong, which also affected its tourism resilience to a certain extent.
Fig. 4 Comprehensive Resilience Index

4 Characteristics of three tourism resilience stages

4.1 Temporal and spatial variation of tourism resilience

Based on the trend of national tourism resilience changes, it is easy to see that tourism resilience was at its lowest level in the first two quarters of 2020 and the improvement was slow. Tourism resilience recovered rapidly in the third and fourth quarters. After a small shock in the first half of 2021, it continued to maintain a growth trend. The degree of recovery varies across provinces (municipalities directly under the Central Government) over time. On this basis, the resilience changes during the investigation period could be divided into three stages.
The first stage (the first quarter to the second quarter of 2020, shown in Fig. 5): Hard resistance. All parts of the country have been severely affected by the epidemic, the first-level responses to major public health emergencies have been launched one after another, and tourism resilience has successively reached the lowest level (except in Beijing). In the first half of 2020, the spread of the epidemic caused the vulnerability of the tourism industry to be revealed, which caused a significant decline in tourism resilience across the country. In the first and second quarters, the average tourism resilience of each province (municipalities directly under the Central Government) was 0.37 and 0.39, respectively, that is, the national tourism market had shrunk by nearly two-thirds compared to before the epidemic. Ningxia, Tibet, Shanxi, Inner Mongolia, Hunan, Sichuan, and Chongqing had minimum resilience values of less than 0.3, and the southwestern and southeastern coastal areas were also seriously affected. Among them, the local epidemics in Tibet and Ningxia provinces were relatively mild (as of October 2021, Tibet had confirmed a total of one case, and Ningxia had confirmed a total of 77 cases), but the two provinces were at an extremely low level of tourism resilience throughout the study period. This is because tourism in Tibet is restricted by terrain, weather, and road conditions, and the convenience of round-trip travel is lower than that of other regions. In addition, the traffic interruption caused by the epidemic and the extremely strict control policies have further reduced the willingness and possibility of tourists to travel to Tibet. In addition, the average revenues of star hotels in Ningxia and Tibet before the epidemic were the two lowest in the country, and the tourism foundation was extremely weak. During the epidemic, tourists were less concerned about such tourist destinations given the limited choices of tourist destinations. Similarly, the average revenue of star hotels in Inner Mongolia and Shanxi before the epidemic ranked 9th and 10th at the bottom of the country, and their tourism attractiveness was low. The spread of the epidemic then magnified the tourism shortcomings of these two places. Except for Beijing, Shanghai and Guangzhou, the main source of tourists from other provinces in Hunan, Sichuan, and Chongqing is Hubei. Hubei had a serious epidemic, and Beijing, Shanghai and Guangzhou implemented strong control policies, so the loss of tourist sources directly caused the tourism industry in these provinces to be greatly hit in the early stage of the epidemic. The southeastern coastal region and the southwestern region have concentrated on China’s richest tourism resources. As major tourism provinces accounted for a larger share of the national tourism industry, the impact of the epidemic was even more pronounced at the beginning of the epidemic.
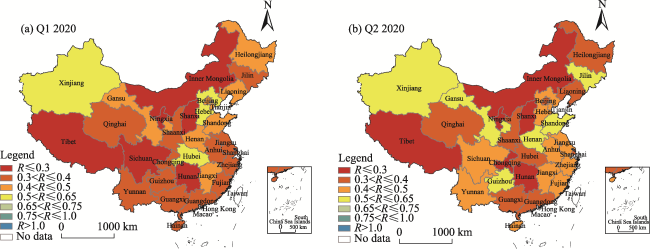
Fig. 5 Temporal and spatial changes of tourism resilience in the first stage

Note: Q1 2020 is the first quarter of 2020; Q2 2020 is the second quarter of 2020.

The second stage (the third quarter to the fourth quarter of 2020, shown in Fig. 6): Accelerated recovery. Most parts of the country had passed the peak of the first epidemic. As Beijing-Tianjin-Hebei, Hubei, etc. respectively lowered the response level of their public health emergencies from Level 1 to Level 2, and the Mid-Autumn National Day holiday approached, major tourism provinces promoted the obvious improvement of tourism resilience in the surrounding areas. In the third and fourth quarters of 2020, the average tourism resilience of each province (municipalities directly under the Central Government) was 0.5 and 0.6, respectively, which was a substantial increase compared to the first half of the year. With the improvement of the epidemic situation, various industries gradually resumed work and production. In the third quarter of 2020, economic growth across the country turned from negative to positive, and tourism consumption demand increased accordingly. In addition to the National Day and Mid-Autumn Festival holiday, the national civil aviation transported about 1.67 million passengers on 1 October, which was basically the same as in the previous year. During the National Day and Mid-Autumn Festival, 637 million domestic tourists were received throughout the country, which strongly promoted the restoration of tourism resilience across the country. In this stage, Hebei Province, the southwest region represented by Sichuan and its neighboring Guizhou, Yunnan, etc., the Yangtze River Delta region represented by Jiangsu and Zhejiang, and its neighboring eastern provinces such as Shandong took the lead in tourism resilience recovery and upgrading to a higher level. Among them, Hebei resumed inter-provincial team tours in July, and its largest tourist sources from other provinces-Beijing and Tianjin- rapidly released tourism consumption demand, causing its resilience to increase rapidly. The average revenues of star hotels before the epidemic in Zhejiang, Jiangsu, Shandong, and Sichuan ranked 7, 8, 9, and 11, respectively, and their tourism resources are relatively rich. During the 11th Golden Week, Shanghai, Guangzhou and Beijing remained the most popular travel destinations, while Hangzhou, Chengdu, Chongqing, Shenzhen, Xi’an, Wuhan and Kunming ranked fourth to tenth. With the improvement of the epidemic situation, the major tourism provinces had more tourism resources to use and release, and a more complete tourism industry chain also enabled them to have a more significant recovery capacity. Moreover, the tourism consumption demand of the people in the above-mentioned areas was relatively strong, so they were important tourist sources. The demand for intra-provincial travel and inter-provincial peripheral travel in such areas had been released, and tourism resilience had been intensively rising in the regional space. During this period, sporadic areas such as Inner Mongolia and Sichuan occasionally experienced localized epidemics, but they were quickly contained. For example, there were imported cases from Russia in Inner Mongolia in November, and no new local cases in December; while the cases in Chengdu, Sichuan Province, were contained in about 10 days, and the medium-risk areas were cleared in about 20 days. Therefore, they did not have a major impact on the overall recovery of tourism resilience.
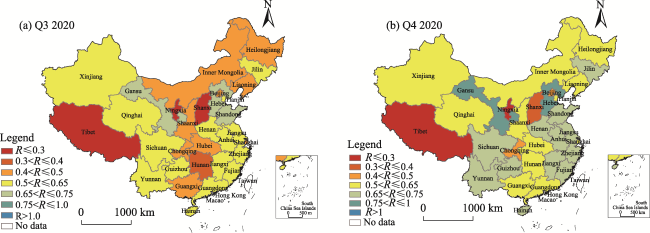
Fig. 6 Temporal and spatial changes of tourism resilience in the second stage

Note: Q3 2020 is the third quarter of 2020; Q4 2020 is the fourth quarter of 2020.

The third stage (the first quarter to the second quarter of 2021, shown in Fig. 7): Increasing with fluctuation. Compared with the first and second quarters of 2020, the overall level in this stage had improved significantly, but the differences in tourism resilience between provinces increased, and the characteristic tourism provinces performed well. Affected by the second wave of the winter epidemic and the tourism industry cycle, the overall resilience in the first quarter of 2021 decreased from 0.62 in the fourth quarter of 2020 to 0.59, but it was much higher than the 0.39 level of resilience under the impact of the first wave of the epidemic in the first quarter of 2020. Although local epidemics broke out in many provinces (municipalities directly under the Central Government) in January 2021, zero new additions in local areas were realized in early February, and all medium- and high-risk areas across the country were cleared, so the epidemic was effectively controlled. During the Spring Festival, about 80% of A-level tourist attractions nationwide were open normally, which further restored the tourism industry in most provinces and regions across the country. In particular, the tourism resilience of Gansu and Guizhou successively exceeded 1, showing a bit of “resilience improvement”. The reason for this improvement lies in two aspects. Firstly, the severity of the epidemic in these two provinces was at a relatively low level across the country, creating the possibility of short-distance “intra-provincial travel” during the epidemic, and offsetting the adverse impact of the epidemic on the tourism industry to a certain extent. Secondly, in the later period of the epidemic, the distinctive tourism resources of these two provinces once again became the favored choice of tourists. Among them, Gansu’s tourist growth rate after the resumption of inter-provincial tourism was close to 280%, ranking first in the country; while Guizhou successively introduced “Wine Tourism” “Integration” and other specialty tourism products, making it a more desirable travel destination for tourists. In addition, the resilience of Xinjiang, Shaanxi, Inner Mongolia and other northwestern provinces and regions exceeded 0.75 in the second quarter of 2021. In the post-epidemic era, the non-crowded and distinctive tourism resources make this type of area more attractive, and their degrees of tourism recovery rank among the top in the country. Similarly, Hainan’s tourism industry has performed well. Sanya, an important tourist city in the province, has played a significant and positive role in the competitive advantage of “Chinese Hawaii”. Coupled with the accelerated layout of duty-free shops and the pulling effect of the China International Consumer Goods Fair, Hainan has shown extremely strong resilience under the impact of the epidemic. However, the three provinces of Tibet, Qinghai, and Ningxia are at an extremely low level of the resilience index due to various reasons, such as their weak tourism foundation. By the end of the study period, most provinces had not recovered to their pre-epidemic levels, and the import of cases from overseas and local epidemic outbreaks had a negative impact on some areas.
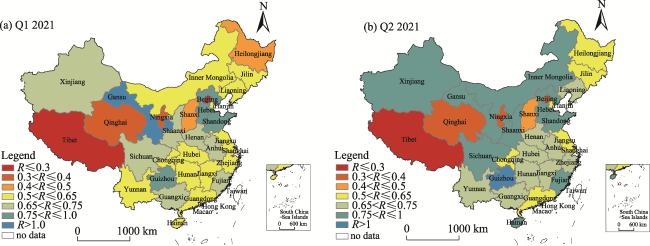
Fig. 7 Temporal and spatial changes of tourism resilience in the third stage

Note: Q1 2021 is the first quarter of 2021; Q2 2021 is the second quarter of 2021.

Although the overall tourism resilience to the epidemic has improved significantly after one and a half years of recovery, only one province (Guizhou) has a resilience index exceeding 1 in the second quarter of 2021, and none of the other provinces have returned to their pre-epidemic levels. Heilongjiang, Jilin, Tianjin, Guangdong, Shanghai and other provinces were more prominently affected by overseas case imports and local outbreaks at this stage. For example, a local diagnosis in Heilongjiang Province occurred in December 2020, and an asymptomatic infection occurred in January 2021, and then the province entered an emergency state, which reduced its resilience in the first quarter. The super-spreading incident in Tonghua, Jilin in January 2021, coupled with the relatively inadequate northeastern regional tourism attractiveness, made recovery relatively difficult. Another case was detected in Ruili, Yunnan in March 2021, and then traffic control was implemented as “no entry, no exit”. This continued to relax until May Day. Normalized epidemic prevention management was implemented, and the resilience index increased in the second quarter. Guangdong has always been troubled by the import of cases from overseas. There was one case of overseas import in December 2020, the first British mutant virus in January 2021, the first Nigeria mutant virus imported from abroad in March, the Indian mutant strain in May, and as of the end of June, all four medium-risk regions across the country were in Guangdong (one in Foshan, two in Dongguan, and one in Shenzhen). As a hub area connecting home and abroad, the risk of overseas imports has largely affected the recovery of its tourism industry. Therefore, the resilience performance of the above-mentioned provinces at the end of the study period is not as good as those of some northwestern regions and characteristic tourist regions.

4.2 The spatial patterns of resistance and recovery ability

The lowest resilience index value of each province tends to be below 0.5, and the tourism industry is generally weak. The worst level of resilience performance under the epidemic reflects the resistance of the tourism industry in each province to the epidemic, and the higher the lowest value, the stronger the resistance of the tourism industry to the epidemic. The spatial pattern of the lowest value for the resilience index in each province during the study period is shown in Fig. 8a, and Tibet, Sichuan, Chongqing, Hunan, Ningxia, Shanxi, Beijing, and Inner Mongolia are the provinces with poor resistance. The lowest value of the resilience index is less than 0.3, so the epidemic had a greater impact on the local tourism industry. The minimum resilience index values of Xinjiang, Gansu, Henan, Shandong, Hebei, Tianjin, and Jiangxi are relatively high, reaching above 0.4. Therefore, the tourism industries in these provinces were relatively weakly affected by the epidemic, but they are still at a very low level. The lowest resilience indices of the provinces are not very different, and they tend to be below 0.5, indicating that under the impact of the epidemic, the vulnerability of the tourism industry is universal.
The recovery ability of the tourism industry varies greatly among provinces, with Gansu and Guizhou showing increased resilience, while the developed areas and areas surrounding Hubei province were subject to stricter epidemic prevention and control measures, and they have moderate resilience and recovery ability. The optimal level of resilience performance during the epidemic reflects the recovery ability of the tourism industry in the various provinces, that is, the higher the maximum resilience index, the stronger the recovery ability. The spatial pattern of the highest value of the resilience index in each province during the study period is shown in Fig. 8b. The resilience values of Gansu and Guizhou exceeded 1, showing a significant improvement in resilience; while Xinjiang, Sichuan, Shaanxi, Hebei, Shandong, Fujian, and Inner Mongolia also showed strong recovery ability, with their highest resilience index values reaching above 0.75; and the developed regions, Hubei and some of its surrounding areas and the border provinces performed at a mediocre level. According to calculations by Zhang et al. (2020), the four developed regions of Shanghai, Beijing, Jiangsu, and Guangdong ranked first in the country in terms of their epidemic prevention and control capabilities; while Henan, Hunan, Chongqing, Anhui, Shanxi and other neighboring areas in Hubei also had excellent epidemic prevention and control capabilities. This also means that more stringent control measures would present a multi-faceted barrier to travel within the province and cross-provincial travel from outside the province. However, the highest index values of Tibet, Ningxia, and Shanxi are less than 0.4, and the highest value of Tibet’s resilience index is only 0.26, showing that the effect of tourism recovery was minimal.
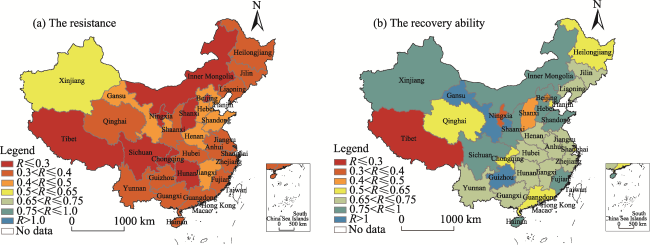
Fig. 8 Spatial patterns of resistance and recovery ability

5 Discussion

(1) The trade-off of the strictness of the epidemic prevention and control policies
The relatively strict epidemic prevention and control measures have strongly boosted the improvement of the epidemic situation and created a positive environment for the overall recovery of the tourism industry. On the other hand, strict epidemic prevention and control policies also mean that the flow of tourism will be greatly cut off, which is the key reason why the tourism industry is in trouble under the impact of the epidemic. The “Guidelines for the Reopening of Scenic Spots on Epidemic Prevention and Control Measures (Revised in March 2021)” mentioned that “If the local COVID-19 prevention and control risk level and emergency response level are adjusted, the prevention and control strategies and measures of tourist attractions should be scientifically and dynamically adjusted in accordance with the requirements of the local party committee and government”. Subsequently, how to better balance the advantages and disadvantages of epidemic prevention and control policies, prohibit the occurrence of “one size fits all” phenomena, and refine the implementation of the epidemic prevention and control policies, so as to give full development space for tourism, will be the important directions of relevant policy formulation under the background of a normalized epidemic.
(2) The changes and strengthening of the attractiveness of tourist destinations in the post-epidemic era
This study found that the provinces with the strongest tourism resilience are Gansu, Guizhou, Hainan and other provinces with relatively light epidemics and strong tourism characteristics. This shows that in the post-epidemic era when travel convenience has declined, tourists will take health and safety factors into important consideration on the one hand, and on the other hand they will pay more attention to the distinctive and attractive tourist scenes, such as beaches, northwestern style, ethnic characteristics, etc., so the “Matthew effect” of tourism products will be further highlighted. Therefore, when faced with unexpected shocks, the stronger the tourism industry foundation, the more obvious the recovery advantages in the crisis. This is especially true in the characteristic tourism provinces that can gradually recover to a higher level of resilience by virtue of their own tourism resource base or innovative tourism products, and the development focus of such regions will be the innovation of tourism products to maximize the advantages of their tourism industry. In areas with a weak tourism industry foundation, the unfavorable impacts of emergencies on the tourism industry in the region will be further magnified. Such regions should focus on improving the infrastructure level of their own tourism industry, and intensify their efforts and innovate in terms of tourism resource development and later publicity, so as to actively cultivate their own advantages. Such efforts will ultimately improve the tourism industry’s resistance to unexpected shocks, and allow it to achieve sustainable development.
(3) Attention to emerging tourism methods
With the changes in tourism consumption trends and the macroeconomic environment, if you stick to the traditional industrial model of the mass tourism era, you will face the risk of being eliminated. This risk suggests that all provinces and regions should actively follow the industrial development trend, seize the new business development opportunities such as health tourism, smart tourism, “hotel + air ticket” and other private customized services, and innovate tourism products based on the characteristics of their own regional tourism. They should give full play to their own advantages, satisfy consumers’ new demands for health, personalization, and digitalization of tourism in the post epidemic era, and promote the sustainable development of the tourism industry.

6 Conclusions

(1) Under the impact of COVID-19, the tourism industry of China has shown obvious characteristics of resilience. At the beginning of 2021, under the impact of the second wave of relatively strong winter epidemics, the overall decline in the revenue of star hotels across the country had decreased, showing a significant increase in resilience. The fundamental improvement of the epidemic situation has helped the tourism industry continue to recover as a whole, and the trend of tourism resilience in most provinces has been one of rising with fluctuations.
(2) Some provinces and regions with high or very low comprehensive resilience have certain characteristics, and the overall resilience of the vast majority of the other provinces and regions presents a pattern of “weak in the north and strong in the south”. Gansu, Hainan, Guizhou, Hebei, and Shandong have relatively high levels of comprehensive resilience; Tibet, Ningxia, Shanxi, and Beijing have extremely low comprehensive resilience indexes, and the tourism foundation and geographical factors have affected the recovery of tourism in northern regions to a certain extent. Meanwhile, Hubei and its neighboring provinces, as well as the southern provinces such as Shanghai, are affected by factors such as the source-destination joint influence, overseas importation of cases, and strict prevention and control policies, and their overall resilience performance is not as good as the other southern provinces.
(3) During the study period, China’s tourism resilience experienced three stages: hard resistance—accelerated recovery—increasing with fluctuation. From the first quarter to the second quarter of 2020, all provinces and regions were severely affected by the epidemic, the vulnerability of tourism was exposed, and the resilience of tourism reached its lowest level and slowly improved. From the third quarter to the fourth quarter of 2020, with the improvement of the epidemic situation and the arrival of the Mid-Autumn Festival and National Day holidays, characteristic tourism provinces significantly improved the resilience of tourism in the surrounding areas. From the first quarter to the second quarter of 2021, tourism resilience recovered quickly after a slight decline, and the resilience gap between provinces increased, with the particularly characteristic tourism provinces and regions performing well. From the first quarter to the second quarter of 2021, tourism resilience recovered quickly after a slight decline, the resilience gap between provinces increased, and the characteristic tourism provinces and regions performed well.
(4) The tourism industry in various provinces and regions was generally weak in its resistance to the impact of the epidemic, with obvious differences in resilience. The lowest resilience index values of all provinces and regions tended to be below 0.5 and the gap was not large, confirming that the vulnerability of the tourism industry was universal under the impact of the epidemic. The highest resilience index values of the tourism industry after the impact of the epidemic had a large gap among the provinces. The resilience values of Gansu and Guizhou exceeded 1, showing a significant increase in resilience; Tibet and other provinces had little effect in the recovery of tourism; developed regions and surrounding areas in Hubei were more strongly affected by the epidemic prevention measures and the strict control, and exhibited a mediocre recovery performance.
(5) Many factors affect the level of tourism resilience and the changing trends in various regions. Provinces with relatively mild epidemics, obvious advantages in tourism characteristics and basic tourism conditions, and close proximity to areas with high tourism demand have strong resistance and recovery ability. The fundamental improvement of the epidemic situation has helped tourism to resume; the “partial outbreak” of the epidemic and corresponding control policies are important reasons why the resilience index of some provinces declined; and the launch of special tourism products in the later period of the epidemic has effectively improved the resilience of regional tourism, and it may exceed the original level to show a certain degree of resilience improvement.
In conclusion, under the background of the strong impact of COVID-19 on the tourism industry, based on the dimensions of China’s provinces and regions, and using star hotel revenue to characterize tourism resilience, this study analyzed the temporal and spatial heterogeneity of tourism resilience and its influencing factors in order to discover the internal driving mechanism by which the tourism industry resists risks and resumes development. The results can provide theoretical support for the formulation of tourism-related policies that are specific for the various provinces and regions, and help us to realize the sustainable development of the tourism industry in the post-epidemic era. There are still many improvements to be made in subsequent studies. For example, in terms of the representation of tourism resilience indicators, due to the limitations of data availability, this study selected the total operating income of star-rated hotels in each province to represent tourism revenue, but this metric cannot reflect the tourism consumption generated by tourists who do not stay in star-rated hotels. Therefore, it is not accurate enough. In addition, there is a lack of empirical quantitative analysis between various influencing factors and tourism resilience, so the mechanistic explanation is not deep enough, and this is where future research needs to be further deepened and improved.
[1]
Basurto-Cedeo E M, Pennington-Gray L. 2018. An applied destination resilience model. Tourism Review International, 22(3): 293-302.

[2]
Bec A, Mclennan C L, Moyle B D. 2015. Community resilience to long-term tourism decline and rejuvenation: A literature review and conceptual model. Current Issues in Tourism, 19(5): 431-457.

[3]
Bhati A, Upadhayaya A, Sharma A. 2016. National disaster management in the ASEAN-5: An analysis of tourism resilience. Tourism Review, 71(2): 148-164.

[4]
Brouder P. 2020. Reset redux: Possible evolutionary pathways towards the transformation of tourism in a COVID-19 world. Tourism Geographies, 22(3): 484-490.

[5]
Bui P L, Chen T L, Wickens E. 2021. Tourism industry resilience issues in urban areas during COVID-19. International Journal of Tourism Cities, 7(3): 861-869.

[6]
Cellini R, Cuccia T. 2015. The economic resilience of tourism industry in Italy: What the ‘great recession’ data show. Tourism Management Perspectives, 16: 346-356.

[7]
Chan C S, Nozu K, Zhou Q. 2020. Tourism stakeholder perspective for disaster-management process and resilience: The case of the 2018 hokkaido eastern iburi earthquake in Japan. Sustainability, 12(19): 78-82.

[8]
Dogru T, Marchio E A, Bulut U, et al. 2019. Climate change: Vulnerability and resilience of tourism and the entire economy. Tourism Management, 72(6): 292-305.

[9]
Espeso-Molinero P, Jose Pastor-Alfonso M. 2020. Governance, community resilience, and indigenous tourism in Naha, Mexico. Sustainbility, 12(15): 59-73

[10]
Espiner S, Orchiston C, Higham J. 2017. Resilience and sustainability: A complementary relationship? Towards a practical conceptual model for the sustainability-resilience nexus in tourism. Journal of Sustainable Tourism, 25(10): 1385-1400.

[11]
Feng L, Guo J X, Liu Y. 2021. Research methodology for tourism destination resilience and analysis of its spatiotemporal dynamics in the post-epidemic period. Journal of Resources and Ecology, 12(5): 682-692.

[12]
Feng X G. 2010. Research on the National Leisure Plan and tourism flexible consumption: based on tourism policy options concerning crisis response.. Tourism science, 24(1): 25-35. (in Chinese)

[13]
Hall C M, Scott D, Gossling S. 2020. Pandemics, transformations and tourism: Be careful what you wish for. Tourism Geographies, 22(3): 577-598.

[14]
Holling C S. 1973. Resilience and stability of ecological systems. Annual Review of Ecology and Systematics, 4(1): 1-23.

[15]
Hu X. 2012. Review and prospect of research on regional economic elasticity. Foreign Economics & Management, 34(8): 64-72.

[16]
Jarratt D, Davies N J. 2020. Planning for climate change impacts: Coastal tourism destination resilience policies. Tourism Planning & Development, 17(4): 423-440.

[17]
Joo H, Maskery B A, Berro A D, et al. 2019. Economic impact of the 2015 MERS outbreak on the Republic of Korea’s tourism-related industries. Health Security, 17(2): 100-108.

[18]
King C, Iba W, Clifton J. 2021. Reimagining resilience: COVID-19 and marine tourism in Indonesia. Current Issues in Tourism, 24(19): 2784-2800.

[19]
Knight D W. 2017. A review of “Tourism, resilience and sustainability: Adapting to social, political and economic change”. Tourism Geographies, 20(2): 364-365.

[20]
Liu A, Pratt S. 2017. Tourism’s vulnerability and resilience to terrorism. Tourism Management, 60(6): 404-417.

[21]
Mao Y, He J, Morrison A M, et al. 2020. Effects of tourism CSR on employee psychological capital in the COVID-19 crisis: From the perspective of conservation of resources theory. Current Issues in Tourism, 24(19): 2716-2734.

[22]
Martin R. 2012. Regional economic resilience, hysteresis and recessionary shocks. Journal of Economic Geography, 12(1): 1-32.

[23]
Mason P, Grabowski P, Wei D. 2005. Severe acute respiratory syndrome, tourism and the media. International Journal of Tourism Research, 7(1): 11-21.

[24]
Maureira T M, Stenbacka S. 2015. Indigenous tourism and processes of resilience—About communicative strategies among tourism workers in Quebec. Acta Borealla, 32(2): 148-170.

[25]
McKercher B, Chon K. 2004. The over-reaction to SARS and the collapse of Asian tourism. Annals of Tourism Research, 31(3): 716-719.

[26]
Ministry of Culture and Tourism. 2021. Domestic tourism statistics in 2020. http://www.gov.cn/xinwen/2021-02/19/content5587665.htm. Viewed 15 Sep 2021.

[27]
Ministry of Culture and Tourism of China. 2022. Domestic tourism data in 2021. http://zwgk.mct.gov.cn/zfxxgkml/tjxx/202201/t20220124_930626.html. Viewed Jan 12 2022.

[28]
Rahmawati D, Supriharjo R, Setiawan R P, et al. 2014. Community participation in heritage tourism for Gresik resilience. Procedia - Social and Behavioral Sciences, 135: 142-146.

[29]
Roy S, Amar R, Mandal S. 2016. A dynamic capability view on tourism supply chain resilience evidence from Indian Tourism Sector. Journal of Advanced Research in Management, 7(1): 133-149.

[30]
Scott D, Hall C M, Gössling S. 2016. A review of the IPCC Fifth Assessment and implications for tourism sector climate resilience and decarbonization. Journal of Sustainable Tourism, 24(1-3): 8-30.

[31]
Sharma G D, Thomas A, Paul J. 2021. Reviving tourism industry post-COVID-19: A resilience-based framework. Tourism Management Perspectives, 37. DOI: 10.1016/j.tmp.2020.100786.

[32]
Tremblay-Huet S. 2020. COVID-19 leads to a new context for the “right to tourism”: A reset of tourists’ perspectives on space appropriation is needed. Tourism Geographies, 22(3): 720-723.

[33]
Vanchan V, Mulhall R, Bryson J. 2018. Repatriation or reshoring to the U.S. and UK: Dynamics and global production networks or from here to there and back again. Growth and Change, 49(1): 97-121.

[34]
Wang Q, Zhao L, Yu W, et al. 2020. Spatial-temporal evolution characteristics and influencing factors of resilience of tourism economic system in China. Geography and Geo-Information Science, 36(6): 113-118. (in Chinese)

[35]
Watson P, Deller S. 2022. Tourism and economic resilience. Tourism Economics, 28(5): 1193-1215.

[36]
Wieczorek-Kosmala M. 2022. A study of the tourism industry's cash-driven resilience capabilities for responding to the COVID-19 shock. Tourism Management, 88. DOI: 10.1016/j.tourman.2021.104396.

[37]
World Tourism Organization. 2021. International tourism and COVID-19. https://www.unwto.org/unwto-tourism-dashboard. Viewed on Dec 04 2021.

[38]
Zhan Y R, Gai M. 2018. Study on measurement and coordinated development of socio-ecological system resilience in Coastal tourism destination. Areal Research and Development, 37(5): 158-164. (in Chinese)

[39]
Zhang H, Shen H L, Xia L. 2020. Construction of COVID-19 epidemic prevention and control capacity based on big data perspective. Acta Mathematicae Applicatae Sinica, 43(2): 468-481. (in Chinese)

[40]
Zhou K, Liu B Y, Fan J. 2019. Economic resilience and recovery efficiency in the severely affected area of Ms 8.0 Wenchuan Earthquake. Acta Geographica Sinica, 74(10): 2078-2091.

Outlines

/