Ecosystem Assessment

Spatio-temporal Analysis of Water Supply Services in the Li River Basin

  • LIU Jia , 1, 2 ,
  • XIAO Yu , 1, 2, * ,
  • HUANG Mengdong 1, 2 ,
  • ZHANG Changshun 1, 2 ,
  • QIN Keyu 1, 2 ,
  • XU Jie 3 ,
  • LIU Jingya 1, 2
Expand
  • 1. Institute of Geographic Sciences and Natural Resources Research, Chinese Academy of Sciences, Beijing 100101, China
  • 2. University of Chinese Academy of Sciences, Beijing 100049, China
  • 3. School of Ecology and Nature Conservation, Beijing Forestry University, Beijing 100083, China
*XIAO Yu, E-mail:

LIU Jia, E-mail:

Received date: 2021-11-18

  Accepted date: 2022-04-26

  Online published: 2023-01-31

Supported by

The Guangxi Science and Technology Major Project(AA20161002-3)

The National Natural Science Foundation of China(41971272)

The Strategic Priority Research Program of Chinese Academy of Sciences(XDA20020402)

Abstract

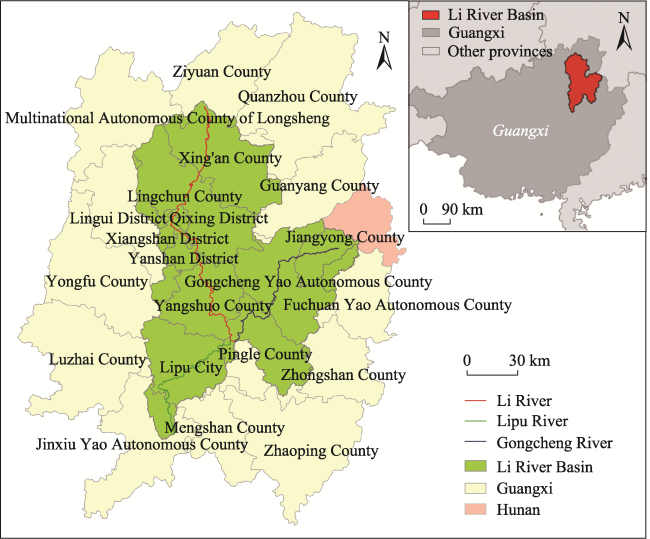
The water supply services of the Li River are essential for the ecological environment and local social development. Based on the InVEST model, we quantitatively analyzed the spatial and temporal distribution patterns of water supply services in the Li River Basin from 2000 to 2018 at multiple scales, including the raster, sub-basin, and regional scales, clarified the differences in water yield among different land use types, and explored the different stages of changes in the characteristics of water services. The results revealed four key aspects of this system. (1) The water supply service of Li River Basin showed a spatial distribution pattern of high in the north and low in the south, and the water yield gradually decreased from north to south. (2) Among the various land use types in Li River Basin, the average water supply capacity decreased in the following order: artificial surface, unused land, grassland, forest, cropland and wetland. (3) The average amounts of water services in the 18 sub-basins varied widely, with four sub-basins belonging to the high-value area for water supply services, eight in the middle-value area, and six in the low-value area. (4) From 2000 to 2010, the regions with large fluctuations in water supply services include the midstream region, Lipu River region, and the northern region of Gongcheng River; while from 2010 to 2018, the areas with large fluctuations were in the midstream region and Gongcheng River region. The results of this research increase our understanding of the water supply services in the Li River Basin and provide a critical scientific basis for the reverse compensation of a regional ecological compensation mechanism.

Cite this article

LIU Jia , XIAO Yu , HUANG Mengdong , ZHANG Changshun , QIN Keyu , XU Jie , LIU Jingya . Spatio-temporal Analysis of Water Supply Services in the Li River Basin[J]. Journal of Resources and Ecology, 2023 , 14(1) : 195 -206 . DOI: 10.5814/j.issn.1674-764x.2023.01.019

1 Introduction

As one of the most important disturbance factors of the ecosystem, water provides a medium for multiple ecosystem processes, which indirectly affects the esthetic view, microclimate regulation, food production, and more (Fu et al., 2013). Its movement directly provides the physical water for plant growth, human life, and industrial production (Brauman et al., 2007), which are the most valuable ecosystem services (Costanza et al., 1997). However, water surplus appears when the water supply is more plentiful than water demand. In contrast, water shortage appears when the water supply cannot meet water demand, including the demand for the effective operation of the ecosystem (Meijer et al., 2012). Water surplus or shortage will affect its evaluation and decision-making about water resources (Costanza et al., 2017). Therefore, accurately assessing the water supply service of the ecosystem is the basis for the effective and sustainable management of water resources.
Due to the different purposes and scales of research, there are two approaches for quantifying ecosystem water services. One refers to water yield in a broad sense, usually expressed as the difference between the water input (precipitation) and output (actual evapotranspiration) of water resources in a region under certain natural conditions (Xu et al., 2016). The other is water availability in a narrow sense, which refers specifically to the availability of water resources to meet specific needs (Xiao et al., 2015), such as the water supply used to regulate the forest ecosystems (Thevs et al., 2017) or the water used for extractive and in situ purposes (Brauman et al., 2007). The water supply service discussed in this study is based on a broad concept, expressed in terms of water yield (mm) and water supply (m3) within a certain period.
Water supply mainly depends on climatic factors (Fan et al., 2015), and is also affected by land surface and human activities (Peng et al., 2020; Sun and Shi, 2020), which together limit the temporal and spatial distribution of water supply services (Milly et al., 2005; Xu et al., 2018). To better evaluate the changes in water supply, various methods and frameworks have been used (Xu et al., 2013; Fan and Shibata, 2015; Chen et al., 2020; Lin et al., 2021). Among them, the Integrate Valuation of Ecosystem Services and Tradeoffs Tool (InVEST) model based on the water balance method has become one of the mainstream methods for calculating the water supply, especially at interannual scales (Boithias et al., 2014; Li et al., 2017; Thevs et al., 2017; Qin et al., 2019). It has achieved good simulation results in many regions of China, such as the Xitiaoxi River Basin (Zhang et al., 2012), the Three Rivers Source Area of China (Pan et al., 2013), the Dongjiang Lake Basin (Xu et al., 2015), the Yellow River Basin (Yang et al., 2020), the Danjiangkou Reservoir Area (Zhang et al., 2020), the Taihu Basin (Ou et al., 2020), the Qinling Mountains barrier region (Wang et al., 2021), and the Weihe River Basin (Li and Zhang, 2021). However, few studies have investigated the water supply services in the Li River Basin.
The Li River Basin is one of the representative karst landscapes in the world and is a typical national key area of ecological environment protection and a prohibited development area. The Li River is not only an important water source for Guilin City and Guangxi Zhuang Autonomous Region but also a key element of the Guilin karst. However, the Li River is currently facing a water shortage problem (Yang and Wei, 2004), and even with the current water supply policy, it cannot fully meet the water demand of the Li River ecosystem (Huang et al., 2014). During the dry period, problems such as exposed mountains on both sides of the Li River, drying up of the rivers, and significant declines in landscape value and biodiversity have seriously affected the ecological environment and the landscape tourism image of Guilin. Therefore, there is an urgent need to accurately assess the water supply services of the Li River Basin and study their temporal and spatial distributions to guide the better planning and utilization of water resources. Based on these considerations, this paper used the InVEST model to accurately quantify the water supply service of the Li River Basin in 2000, 2005, 2010, 2015, and 2018, systematically analyzed its differences in different sub-basins and different land use types and explored its spatial and temporal distribution patterns and changing trends. The results will help to improve our understanding of the water supply services in the Li River Basin and provide an important scientific basis for the compensation of regional ecosystem services.

2 Sthdy area and methods

2.1 Study area

Situated at 110°04°59E-111°17°35E and 24°06°39N- 25°54°56N, the study area is located in the northeast of Guangxi Zhuang Autonomous Region, which is an essential link between the Yangtze River water system and the Pearl River water system (Fig. 1). It is a belt-shaped area along its north and south orientation, spanning 16 districts and counties in Guangxi Zhuang Autonomous Region and one county in Hunan Province, with a total area of 13000 km2, accounting for 46.76% of the total area of Guilin City. The site is rich in mountain and water resources and has nurtured a world-class valuable resource, the karst-style Guilin landscape, of which the Li River is the lifeline. The Li River (also called the Lijiang River) is one of the national key protected rivers and a natural heritage shared by all humanity. It originates in Mao’er Mountain at the junction of Xing’an and Lingchuan counties, flows through Guilin City and Yangshuo County, and finally reaches near Pingle County where it meets with Gongcheng River and Lipu River to become the upstream of the Guijiang River. Given the complexity of the river confluence, the Li River Basin studied in this paper includes parts of the Gongcheng River and the Lipu River.
Fig. 1 Geographical location and administrative area map of the study area
The topography of the Li River Basin is high in the north and low in the south, high in the east and low in the west, with the highest elevation in the territory of 2110 m and the lowest is at 9 m (Fig. 2a). The basin is located at a low latitude. It belongs to the typical mid-subtropical monsoon climate, with high temperatures and humidity in summer and cold and dry weather in winter. Its annual average temperature is 18 ℃ and annual average precipitation is 1688 mm. There are many rivers in the basin, mainly the mainstream of Li River, including tributaries such as Lingqu River, Gantang River, Taohua River, Liangfeng River, and Yulong River. Since precipitation in the basin is greatly affected by monsoon activities, more than 80% of the rainfall is concentrated in March to August, resulting in significant differences in the runoff volumes of the tributaries during the rainy and dry seasons (Duan et al., 2014).

2.2 Water yield model

According to factors such as land use/land cover, climate, and soil, the water yield model of the InVEST model realizes the quantitative, dynamic, and visual evaluation of the water production function of the ecosystem. It is based on the Budyko curve and the principle of water balance, quantitatively analyzes abstract ecosystem services on a unified pixel scale, and uses the precipitation of each pixel minus the actual evapotranspiration to estimate the water production of the pixel, including surface runoff, soil water content, litter water holding capacity, and canopy interception. The equation is given as:
$Y_{xj}=P_{x}-AET_{xj}$
where Yxj is the annual water yield for pixel x on the land use type j (mm), Px is the average yearly precipitation for pixel x (mm), and AETxj is the actual annual evapotranspiration for pixel x on land use type j (mm) which is calculated by the following formula:
$A E T_{x j}=\frac{1+\omega_{x} \times \frac{P E T_{x j}}{P_{x}}}{1+\omega_{x} \times \frac{P E T_{x j}}{P_{x}}+\frac{P_{x}}{P E T_{x j}}} \times P_{x}$
where PETxj is the potential evapotranspiration for pixel x on land use type j (mm), which is defined by Equation (3) andωx is an empirical parameter that can be expressed as a linear function, as shown in Equation (4). Their computation formulas are as follows:
$PETxj=Kcxj×ET0xj$
$ω_{x}=Z×\frac{AWC_{x}}{P_{x}}+1.25$
where ET0xj is the reference evapotranspiration of pixel x on land use type j (mm) that can be calculated according to the Penman-Monteith Equation, and Kcxj is the plant evapotranspiration coefficient associated with the land use type j on pixel x. Z is an empirical constant, also known as the “seasonality factor”, which characterizes regional precipitation patterns and local hydrogeological features. AWCx is the effective soil water content (mm), which is used to determine the total amount of water provided and stored by the soil for vegetation growth and can be determined by the minimum value of the maximum soil root burial depth and plant root depth in conjunction with the vegetation available water content. The formula is as follows:
$AWC_{x}=min(MaxSoildepth,Rootdepth)×PAWC$
where MaxSoildepth is the maximum root burial depth of the soil, Rootdepth is the plant root depth, and PAWC is the plant available water content, usually expressed as the difference between the field water holding capacity and the wilting point, here using the Zhou et al. (2005) nonlinear fitted soil PAWC estimation model:
$\begin{aligned} \text { PAWC }= & 54.509-0.132 \times \text { sand } \%-0.003 \times(\text { sand } \%)^{2}- \\ & 0.055 \times \text { silt } \%-0.006 \times(\text { silt } \%)^{2}-0.738 \times \text { clay } \%+ \\ & 0.007 \times(\text { clay } \%)^{2}-2.688 \times O M \%+0.501 \times(\text { OM } \%)^{2} \end{aligned}$
where the sand%, silt%, clay%, and OM% refer to the specific gravities of sand, silt, clay, and organic matter in the soil texture, respectively.

2.3 Data requirements and preparation

The datasets required for the InVEST water yield model include watershed boundaries, land use/land cover, precipitation, average annual reference evapotranspiration, root restricting layer depth, and plant available water content data. The projection coordinates of all GIS data were unified to Krasovsky_1940_Albers, with linear units of meters and a uniform spatial resolution of 30 m.

2.3.1 Sub-basins

Based on the NASA’s SRTM DEM data (30 m resolution), the Li River basin was delineated into 142 sub-basins by ArcSWAT. Then 18 sub-basins were obtained by combining the physical geographic features and water system distribution (Fig. 2b). Each sub-basin was given only one identification number and the 18 sub-basins were grouped into five regions based on their locations: upstream region, midstream region, downstream region, Lipu River region, and Gongcheng River region. Among them, sub-basins 1-3 are located in the upstream, sub-basins 4-8 in the mid-stream, sub-basins 9-12 in the downstream, sub-basins 13-14 in the Lipu River, and sub-basins 15-18 in the Gongcheng River area of the watershed (Fig. 2b).
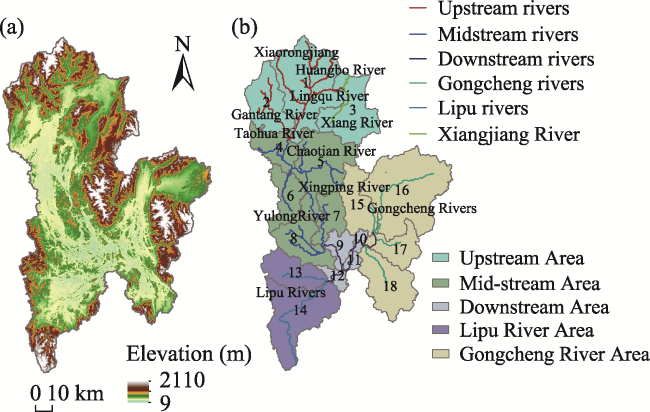
Fig. 2 Topography (a) and river system and sub-basin divisions (b) of the Li River Basin

Note: The numbers 1-18 are the codes for each sub-basin. The same below.

2.3.2 Land use/land cover

Land use and land cover data for 2000, 2005, 2010, 2015, and 2018 (spatial resolution 30 m) were provided by the Resource and Environmental Science Data Center of the Chinese Academy of Sciences (https://www.resdc.cn/), which were classified into six first-level land types and 25 second-level land types. The land use types in the Li River Basin were mainly forest land, which was distributed primarily in the northern and eastern areas, followed by cropland and grassland, with cropland concentrated in the plain areas on both sides of the river and grassland distributed in the middle of the cropland and forest land (Fig. 3).
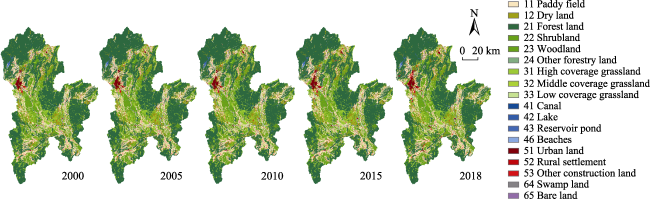
Fig. 3 Distributions of land use types in the Li River Basin in 2000, 2005, 2010, 2015 and 2018

2.3.3 Precipitation and average annual potential evapotranspiration

Meteorological daily value data (including temperature, precipitation, radiation, relative humidity, wind speed, sunshine hours, etc.) were obtained from the China Meteorological Data Service Center (http://data.cma.cn/). First, the data from 21 national meteorological stations in and around the Li River Basin were extracted, and annual precipitation was calculated for each of the 21 stations from 1998 to 2018. Second, the Penman-Monteith formula was used to calculate the annual evapotranspiration from 1998 to 2018 for the 21 meteorological stations. To avoid unrepresentative single-year data due to the large interannual variability in precipitation and evapotranspiration, the average values of five-time periods (1998-2002, 2003-2007, 2008-2012, 2013-2017, 2018) were used in this study to represent the precipitation and evapotranspiration for 2000, 2005, 2010, 2015 and 2018, respectively. Finally, the professional meteorological interpolation software ANUSPLIN batch interpolation was used to obtain the raster data of precipitation and evapotranspiration for 2000, 2005, 2010, 2015, and 2018 in the Li River Basin.

2.3.4 Root restricting layer depth and plant available water content

The root restricting layer depth refers to the actual depth that various plant roots can reach in different types of land. The reachable depth directly affects the way and intensity of water resource use by plants, and it can be approximated by soil depth. Plant available water content (PAWC) represents the effective soil water content, which was determined by the soil texture and adequate soil depth, and was estimated through the non-linear fitting soil PAWC model by Zhou et al. (2005). The relevant soil data above were obtained from the 1:1000000 soil data of the second national land survey provided by the Nanjing Institute of Soil Science, Chinese Academy of Sciences.

2.3.5 Biophysical parameter table

The InVEST model requires the input of a table of biophysical parameters to reflect the land use/cover type attributes, including land use/cover code, maximum root depth, and evapotranspiration coefficient. The maximum root depth refers to the maximum root depth of the vegetated land use type and can be determined with reference to Xu et al. (2016), Yang et al. (2020), and the documentation in the InVEST model. The evapotranspiration coefficients Kc for various land types can be determined using the reference values of the evapotranspiration coefficient given by the Food and Agriculture Organization of the United Nations (FAO), which is the ratio of water demand of crops at different growth stages to the possible evapotranspiration. The maximum root depth and evapotranspiration coefficients for each land use in the Li River Basin are shown in Table 1.
Table 1 Maximum root depth coefficients and evapotranspiration coefficients for different land use types in the Li River Basin
Land use type Lucode LULC_veg Root_depth (mm) Kc
Paddy field 11 1 2100 1.02
Dry land 12 1 2000 0.91
Forest land 21 1 5200 1
Shrubland 22 1 5200 0.95
Woodland 23 1 5200 0.93
Other forestry land 24 1 2500 0.73
High coverage grassland 31 1 2600 0.85
Middle coverage grassland 32 1 2300 0.65
Low coverage grassland 33 1 2000 0.65
Canal 41 0 100 1
Lake 42 0 1 1
Reservoir pond 43 0 1 1
Beaches 46 0 100 1.2
Urban land 51 0 100 0.3
Rural settlement 52 0 100 0.3
Other construction land 53 0 100 0.3
Swamp land 64 0 300 1
Bare land 65 0 1 0.2

Note: To display the data in a raster format, each land use type was mapped to an integer code, and these codes did not have to be contiguous or ordered. Here Lucode is used to identify each land use type.

2.3.6 Seasonal factors and model correction

The seasonality factor refers to the Z parameter, which is a constant precipitation characteristic. The longer the precipitation time for regions with the same total area, the larger the Z parameter. The model can be calibrated with other parameters determined by adjusting the Z parameter to achieve higher accuracy. The basin’s upper, middle, and downstream outlets correspond to Guilin Station, Yangshuo Station, and Pingle Station, so the multi-year average runoff from Guilin and Pingle stations can be used as a reference for the water supply results of the basin. From the measured data, the multi-year average runoff volumes of Guilin and Pingle stations from 1990 to 2016 are known to be about 41.98×10⁸ m3 and 138.36×10⁸ m3, respectively (Wei et al., 2021). When Z was taken as 3.5, the observed values of the annual runoff volumes can reach 98.98% and 99.84% of the water production in the same period, respectively, with only a slight overall error.

3 Results

3.1 The spatiotemporal patterns of Li River’s water supply services

Water yield and water supply are the important indicators of water supply services in a basin, with the former expressed through unit water production depth (mm) and the latter characterized by total basin water production (m3). The average water yields in the Li River Basin were 1069 mm, 1024 mm, 859 mm, 1512 mm, and 840 mm in 2000, 2005, 2010, 2015, and 2018, respectively, with a multi-year average yield of 1061 mm (Fig. 4). In terms of overall trends, the water supply services fluctuated widely from year to year and varied significantly from period to period. The water yield in the basin showed a slight downward trend from 2000 to 2010, with a rate of decline of 21 mm yr-1; a more pronounced upward trend from 2010 to 2015, with a rate of increase of 130.6 mm yr-1; and a significant downward trend from 2015 to 2018, with a rate of decline of 67.2 mm yr-1. The total water supply in the whole basin showed the same trend directions, with the highest total water supply in 2015 of 196.84×10⁸ m3, the lowest total water supply in 2018 of 109.44×10⁸ m3, and the multi-year average total water supply of 138.14×10⁸ m3. From the water balance perspective, precipitation and actual evapotranspiration are the two key factors that determine water production. As shown in Fig. 4, precipitation over the same period also showed a trend of decreasing, then increasing and then decreasing again, basically maintaining a level between 1400-2100 mm, with the highest average precipitation of 2127 mm in 2015. The average potential evapotranspiration and actual evapotranspiration showed a decreasing trend, decreasing by 23 mm from 2000 to 2018.
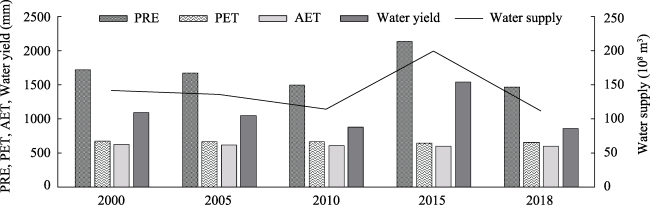
Fig. 4 Variation of precipitation (PRE), potential evapotranspiration (PET), actual evapotranspiration (AET), water yield, and the water supply in Li River Basin
The spatial distribution pattern of water yield in the Li River Basin was generally high in the north and low in the south, and showed a gradual decrease from north to south with noticeable gradient changes (Fig. 5). The high-value areas were mainly concentrated in the northern part of the basin, with the most concentrated areas in the low elevation plains centered in Guilin City. The low-value areas were distributed primarily in the south of the basin, with the most significant concentration in the high elevation areas. This distribution pattern was directly related to average annual precipitation (PRE) and actual evapotranspiration (AET). Areas with high PET and low AET had a substantial water production capacity, and conversely, areas with low PET and high AET had a weak water production capacity. Specifically, PRE gradually decreased from northwest to southeast, showing a high north to low south pattern, similar to the water yield (Fig. 5). This distribution was caused by the Mao’er Mountains in the northern part of the basin blocking the southward airflow, forcing the air masses to lift and form heavy rainfall, resulting in the upper reaches becoming one of the high-value rainfall areas in China. In this case, the PRE in the storm center reached 2600 mm, making the moisture input in the northern part of the basin much higher than in the southern region. AET was another critical factor affecting water yield. Its high values were distributed at high elevations, while the low values were concentrated in the central plains of the basin, especially in urban settlements (Fig. 5). The former had higher AET values due to higher vegetation cover at higher altitudes, while the latter was dominated by construction land and agricultural cropland and had lower AET values.
Fig. 5 Spatial distributions of Water yield, PRE, and AET in the study area during the study period

3.2 The differences in the water supply services among different land use types

Water yield was also directly related to the distribution of land use types, and there are significant differences in water yield among the land use types in the study area (Table 2). The primary land use types in descending order of water yield were artificial surface (1559 mm), unused land (1349 mm), grassland (1169 mm), forest land (1050 mm), cropland (1036 mm), and wetland (912 mm). The top six secondary land use types in terms of water yield were urban land, other construction land, bare land, rural settlement, middle coverage grassland, and swamp land. These differences are largely due to impervious surfaces increasing the surface temperature by absorbing solar radiation energy. Thus, the sensible heat is high and the latent heat is low, which ultimately leads to low evapotranspiration. Therefore, these types had a higher water supply capacity under the same precipitation conditions. In comparison, the water yields of lake, beaches, canals, woodland, shrubland, and paddy field occupied the last six positions. The lowest water yield of the first three land use categories was due to the large and rapid evaporation from the water surface. The lower water yield in the last three land use categories was due to high evapotranspiration caused by vegetation transpiration.
Table 2 Water yield for the various land use types in the Li River Basin during the study period (Unit: mm)
Lucode Land use type 2000 2005 2010 2015 2018 Multi-year average
11 Paddy field 1092 890 870 1289 839 996
12 Dry land 1157 983 938 1415 892 1077
21 Forest land 1038 1079 828 1604 802 1070.2
22 Shrubland 988 920 796 1423 804 986.2
23 Woodland 996 949 799 1429 803 995.2
24 Other forestry land 1239 1049 1005 1490 963 1149.2
31 High coverage grassland 1056 1075 859 1579 868 1087.4
32 Middle coverage grassland 1324 1330 1105 1818 1091 1333.6
33 Low coverage grassland 1090 1050 887 1420 976 1084.6
41 Canal 1077 822 845 1250 779 954.6
42 Lake 787 736 599 1013 716 770.2
43 Reservoir pond 1210 901 917 1282 810 1024
46 Beaches 1149 785 754 1092 706 897.2
51 Urban land 1786 1484 1529 1916 1422 1627.4
52 Rural settlement 1546 1345 1322 1729 1284 1445.2
53 Other construction land 1705 1452 1516 1981 1364 1603.6
64 Swamp land 1098 1457 930 1161.7
65 Bare land 1452 1352 2108 1230 1535.5

Note: Lucode is used to identify each land use type. “‒” means no data.

3.3 The spatiotemporal patterns of the sub-basin water supply services

Sub-basins are the basic units of water production formation, so it is more meaningful to explore the spatial and temporal differences of water supply services at the sub-basin level. Using the average water yield (mm) of each sub-basin in 2000, 2005, 2010, 2015, and 2018 as an indicator to assess the regional water supply services, the results showed that the water supply services in the Li River Basin were predominantly upstream and the yields decreased from upstream to downstream (Fig. 6). Overall, the average multi-year water yields of the five major regions fell in the following order: upstream region (1253.2 mm), midstream region (1132.6 mm), Gongcheng River region (928 mm), Lipu River region (925.2 mm), and downstream region (823.4 mm). Specifically, sub-basins 1-4 had higher water yields, with multi-year averages above 1200 mm; sub-basins 5-8 and 13-16 had the next highest water yields, fluctuating between 900 mm and 1200 mm; and sub-basins 9-12 and 17-18 had the lowest water yields, all below 900 mm (Fig. 6).
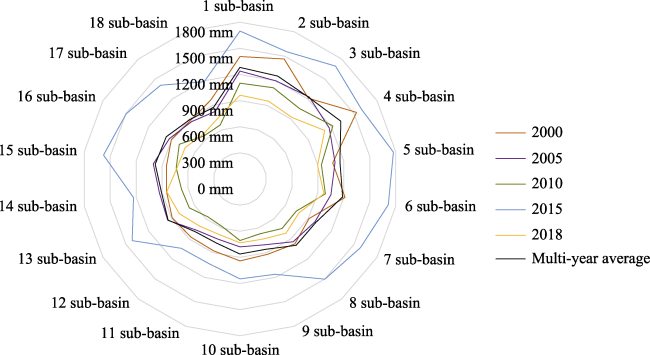
Fig. 6 Water yields in the sub-basins of the study area during the study period
In terms of the magnitude of changes in water yield in the sub-basins, the overall trend of water supply services in the sub-basins from 2000 to 2010 was decreasing (Fig. 7). The sub-basins with larger decreases include 1, 2, 4, 12, and 18, where the yearly declines were higher than 30 mm yr-1; the sub-basins with smaller decreases include 3, 5, 14, 15, and 16, where the annual decreases were lower than 20 mm yr-1. From 2010 to 2015, the overall water supply services in the sub-basins increased significantly, with all sub-basins producing more than 1000 mm, which was related to the increase in precipitation during this period. The sub-basins with higher annual increases include 5, 7, 8, 13, 15, and 17, with annual increases higher than 150 mm yr-1; while the sub-basins with smaller increases include 2, 4, 9, 10, 11, and 12, with annual increases lower than 100 mm yr-1. The water yields of the sub-basins declined significantly from 2015 to 2018, and the overall water yield was lower than the multi-year average. Sub-basins with significant decreases include 3, 5, 7, 15, and 16 with annual decreases above 150 mm yr-1 and the sub-basins with smaller decreases were 11, 12, and 14 with annual reductions below 80 mm yr-1.
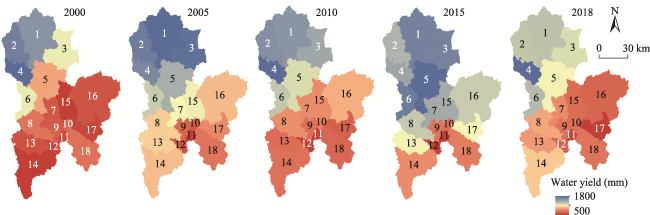
Fig. 7 Spatial distribution of water yields in the sub-basins during the study period
In terms of the fluctuations of water yield in the sub-basins (Fig. 8), the sub-basins with large changes in the water yield between the first stage (2000-2005) and the second stage (2005-2010) include 4, 7, 13, 14, and 15, which correspond to the midstream, Lipu River and the northern part of Gongcheng River region. The sub-basins with more minor fluctuations were 1, 9, 11, and 18, corresponding to the upstream, downstream, and south of the Gongcheng River region (Fig. 8). The sub-basins with more significant changes in water yield between the third stage (2010-2015) and the fourth stage (2015-2018) include 5, 7, 15, and 17, which correspond to the midstream and the Gongcheng River region; while the sub-basins with more minor fluctuations were 4, 10, 11, and 12, which correspond to the midstream region and the downstream region.
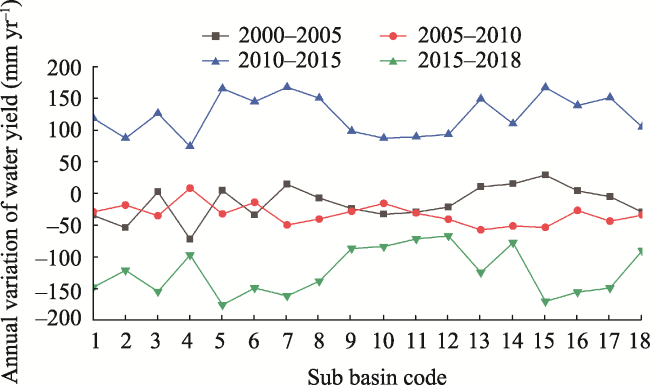
Fig. 8 Fluctuations of water yields in the sub-basins during the study period

4 Discussion

4.1 The focus on protection of the high supply region

The Li River Basin has always been a critical area of national concern. On the one hand, the Li River provides abundant water resources for the Xijiang River system. On the other hand, the basin has nurtured the world-class landscape Guilin landscape, which possesses high landscape aesthetic and cultural heritage value. As such, it provides numerous ecosystem services to human society, including but not limited to freshwater supply, food production, atmospheric regulation, hydrological regulation, recreational tourism, and landscape aesthetics (Scholte et al., 2015; Meng et al., 2020). Among them, the water supply services are the most basic but essential services. Water supply services are usually measured by average water yield and entire water supply, which are related to the average water yield and area of each land use type. Therefore, the contribution of each region to the entire water supply depends on the regional area and land use composition (Table 3). The area of each region and the entire water supply were calculated and showed that the regional areas decrease in the order of Gongcheng River, midstream, upstream, Lipu River, and downstream. The entire water supply decreases in the order of upstream, midstream, Gongcheng River, Lipu River, and downstream (Table 4). These results imply that the spatial variation of the water supply volume is largely due to the different areas of the regions.
Table 3 Land use composition in the five regions of Li River Basin during the study period
Region Area (km2) Land use code The proportion of land use area (%)
2000 2005 2010 2015 2018
Upstream region 3296.8 1 16.42 16.42 16.34 16.16 16.09
2 73.73 73.7 73.68 73.47 73.3
3 6.4 6.4 6.38 6.3 6.33
4 1.77 1.77 1.8 1.86 2.02
5 1.68 1.71 1.79 2.17 2.25
6 - - 0.01 0.04 0.01
Midstream region 3308.7 1 25.59 25.4 25.32 25.06 24.49
2 57.69 57.66 57.69 57.61 57.36
3 11.09 11.08 11.02 10.95 10.9
4 1.1 1.11 1.18 1.2 1.21
5 4.53 4.75 4.79 5.18 6.04
6 - - - - -
Downstream region 578.3 1 32.81 32.77 32.69 32.71 32.42
2 42.76 42.75 42.75 42.72 42.62
3 19.81 19.83 19.82 19.83 19.83
4 2.17 2.2 2.29 2.29 2.28
5 2.45 2.45 2.45 2.45 2.85
6 - - - - -
Lipu River region 1877.5 1 19.82 19.83 19.79 19.76 19.5
2 68.15 68.16 68.19 68.1 68.04
3 9.94 9.91 9.9 9.96 9.82
4 0.34 0.34 0.36 0.36 0.43
5 1.75 1.76 1.76 1.78 2.17
6 - - - 0.04 0.04
Gongcheng River region 3940.7 1 24.04 24.01 24.01 16.16 23.91
2 65.72 65.76 65.98 73.47 65.88
3 7.96 7.93 7.68 6.3 7.63
4 0.68 0.68 0.72 1.86 0.79
5 1.59 1.61 1.6 2.17 1.78
6 0.01 0.01 0.01 0.04 0.01

Note: Land use code values of 1-6 represent cropland, forest land, grassland, wetland, artificial surface, and unused land, respectively.

However, the differences in water supply volume due to area differences are not a good representation of the actual water supply of the region. Therefore, we attempted to quantify the areas and entire water supply in other regions, using the downstream region as the smallest unit, to analyze and compare their water supply capacities. Firstly, using the downstream region as 1 area unit, and upstream, midstream, downstream, Lipu River, and Gongcheng River regions correspond to 5.70, 5.72, 1, 3.25, and 6.81 area units, respectively. Secondly, using the entire downstream water supply as 1 supply unit, the upstream, midstream, downstream, Lipu River, and Gongcheng River regions correspond to 8.66, 7.76, 1, 3.58, and 7.63 water supply units, respectively. Finally, the difference between the above two numbers was used to characterize the water supply capacity, with a larger difference implying a higher water supply capacity. These results show that the regional water supply decreased for the same area scenario: Upstream, midstream, Gongcheng River, Lipu River, and downstream. The area difference between the upstream and the midstream was small, but the water supply capacity in the midstream was lower than that in the upstream. This difference may be due to the sum of the shares of cropland and forest land in the upstream region being slightly higher than that in the midstream. In addition, the water supply capacity of the midstream was significantly higher than that of the Gongcheng River region, even though the Gongcheng River region has a large area. This probably due to the aggregate of the shares of grassland and industrial and mining land in the Gongcheng River region was much lower than that in the midstream. In summary, the water supply services in the upstream and midstream regions play an indispensable role in the water supply service function of the whole Li River Basin, so the utilization and management of water resources in these two regions should be strengthened. In addition, emphasis should be placed on enhancing the Gongcheng River and Lipu River region water supply service capacities.
Table 4 Water supply in the five regions of Li River Basin during the study period (Unit: 108 m3)
Region Water supply
2000 2005 2010 2015 2018
Upstream region 44.91 40.43 35.95 54.80 31.24
Midstream region 37.01 34.95 30.53 54.91 30.03
Downstream region 5.21 4.54 3.69 6.43 4.17
Lipu River region 16.18 17.57 12.64 24.24 15.58
Gongcheng River region 35.67 35.75 29.03 56.24 28.34

4.2 Study limitations and future work

There may be some shortcomings in our analysis. For example, the study area is a typical karst landscape, implying that part of the water loss is groundwater rather than surface water. However, the InVEST model does not consider the loss of groundwater, which leads to some bias in the simulation results of water yield. In addition, the precipitation and evapotranspiration required for the model operation are spatial data obtained by interpolation, and the number and distribution of meteorological stations affect the interpolation accuracy of precipitation and evapotranspiration. In particular, the Li River Basin is strongly influenced by the climate, which further increases the uncertainty of meteorological interpolation.
Meanwhile, some parameters such as those in the biophysical parameter table, root restricting layer depth, plant available water content, and seasonal factor are derived from empirical data in the literature or the distribution of example parameters, which may also lead to lower simulation accuracy. Therefore, subsequent studies should optimize these parameters, increase the amount of measured data, and validate the yield results in situ by field sampling to improve the accuracy of the water supply service calculations. In addition, the flow paths and flows of water should be identified (Bagstad et al., 2013; Comberti et al., 2015), which will help to accurately quantify the physical and value flows of water supply services and provide a scientific reference basis for the reverse construction of ecological compensation mechanisms.

5 Conclusions

Based on the InVEST model, this study analyzed the spatial and temporal patterns of water supply services in the Li River Basin at multiple scales, including the raster, sub-basin and regional scales. The results showed that the spatial distribution pattern of water yield within the Li River Basin was generally high in the north and low in the south, and showed a gradient of gradual change from north to south. For the land cover types in the Li River Basin, the average water yield capacity decreased in the following order: artificial surface, bare land, grassland, woodland, cropland and wetland. The average water yields vary widely among the sub-basins in the Li River Basin, with four sub-basins in the high value area, eight in the middle value area, and six in the low value area. For the five major regions, the average multi-year water yield was from the upstream region, midstream region, Gongcheng River region, Lipu River region and downstream region. The descending order of water supply for the same areas are: midstream, upstream, Gongcheng River, Lipu River and downstream. Among them, upstream and midstream play an indispensable role in the water supply service function of the whole Li River Basin. In terms of phase changes, the water supply services fluctuated greatly in the midstream region, the Lipu River region and the northern part of the Gongcheng River from 2000 to 2010, and they also fluctuated greatly in the midstream region and the Gongcheng River region from 2010 to 2018.
[1]
Bagstad K J, Johnson G W, Voigt B, et al. 2013. Spatial dynamics of ecosystem service flows: A comprehensive approach to quantifying actual services. Ecosystem Services, 4: 117-125.

DOI

[2]
Boithias L, Acuña V, Vergoñós L, et al. 2014. Assessment of the water supply: Demand ratios in a Mediterranean basin under different global change scenarios and mitigation alternatives. Science of the Total Environment, 470-471: 567-577.

[3]
Brauman K A, Daily G C, Duarte T K E, et al. 2007. The nature and value of ecosystem services: An overview highlighting hydrologic services. Annual Review of Environment and Resources, 32(1): 67-98.

[4]
Chen D S, Li J, Yang X N, et al. 2020. Quantifying water provision service supply, demand and spatial flow for land use optimization: A case study in the Yanhe Watershed. Ecosystem Services, 43: 101117. DOI: 10.1016/j.ecoser.2020.101117.

DOI

[5]
Comberti C, Thornton T F, Wyllie De Echeverria V, et al. 2015. Ecosystem services or services to ecosystems? Valuing cultivation and reciprocal relationships between humans and ecosystems. Global Environmental Change, 34: 247-262.

DOI

[6]
Costanza R, de Groot R, Braat L, et al. 2017. Twenty years of ecosystem services: How far have we come and how far do we still need to go? Ecosystem Services, 28: 1-16. DOI: 10.1016/j.ecoser.2017.09.008.

DOI

[7]
Costanza R, d’Arge R, de Groot R, et al. 1997. The value of the world’s ecosystem services and natural capital. Nature, 387(6630): 253-260.

DOI

[8]
Duan W J, Wang J Y, Zhang L J, et al. 2014. Characteristics of precipitation in Lijiang River Basin during 1960-2010. Journal of China Hydrology, 34(5): 88-93. (in Chinese)

[9]
Fan M, Shibata H. 2015. Simulation of watershed hydrology and stream water quality under land use and climate change scenarios in Teshio River Watershed, northern Japan. Ecological Indicators, 50: 79-89.

DOI

[10]
Fu B J, Wang S, Su C H, et al. 2013. Linking ecosystem processes and ecosystem services. Current Opinion in Environmental Sustainability, 5(1): 4-10.

DOI

[11]
Huang D, Guo C Q, Xu N T. 2014. Research on ecological water requirement in Lijiang River Basin. South-to-North Water Transfers and Water Science & Technology, 12(6): 26-30. (in Chinese)

[12]
Li D L, Wu S Y, Liu L B, et al. 2017. Evaluating regional water security through a freshwater ecosystem service flow model: A case study in Beijing-Tianjian-Hebei region, China. Ecological Indicators, 81: 159-170.

DOI

[13]
Li Z, Zhang Y F. 2021. Spatiotemporal evolution of ecosystem services in the main and tributaries of Weihe River Basin based on InVEST Model. Journal of Soil and Water Conservation, 35(4): 178-185. (in Chinese)

[14]
Lin J Y, Huang J L, Prell C, et al. 2021. Changes in supply and demand mediate the effects of land-use change on freshwater ecosystem services flows. Science of the Total Environment, 763: 143012. DOI: 10.1016/j.scitotenv.2020.143012.

DOI

[15]
Meijer K S, van der Krogt W N M, van Beek E. 2012. A new approach to incorporating environmental flow requirements in water allocation modeling. Water Resources Management, 26(5): 1271-1286.

DOI

[16]
Meng S, Huang Q X, Zhang L, et al. 2020. Matches and mismatches between the supply of and demand for cultural ecosystem services in rapidly urbanizing watersheds: A case study in the Guanting Reservoir Basin, China. Ecosystem Services, 45: 101156. DOI: 10.1016/j.ecoser.2020.101156.

DOI

[17]
Milly P C D, Dunne K A, Vecchia A V. 2005. Global pattern of trends in streamflow and water availability in a changing climate. Nature, 438(7066): 347-350.

DOI

[18]
Ou W X, Liu C, Tao Y. 2020. An analysis of spatio-temporal evolution of water supply and demand in Taihu Basin. Resources and Enviroment in the Yangtze Basin, 29(3): 623-633. (in Chinese)

[19]
Pan T, Wu S H, Dai E F, et al. 2013. Spatiotemporal variation of water source supply service in Three Rivers Source Area of China based on InVEST model. Chinese Journal of Applied Ecology, 24(1): 183-189. (in Chinese)

[20]
Peng J, Wang X Y, Liu Y X, et al. 2020. Urbanization impact on the supply-demand budget of ecosystem services: Decoupling analysis. Ecosystem Services, 44: 101139. DOI: 10.1016/j.ecoser.2020.101139.

DOI

[21]
Qin K Y, Liu J Y, Yan L W, et al. 2019. Integrating ecosystem services flows into water security simulations in water scarce areas: Present and future. Science of the Total Environment, 670: 1037-1048.

DOI

[22]
Scholte S S K, van Teeffelen A J A, Verburg P H. 2015. Integrating socio-cultural perspectives into ecosystem service valuation: A review of concepts and methods. Ecological Economics, 114: 67-78.

DOI

[23]
Sun S, Shi Q. 2020. Global spatio-temporal assessment of changes in multiple ecosystem services under four IPCC SRES land-use scenarios. Earths Future, 8(10): e2020EF001668. DOI: 10.1029/2020EF001668.

DOI

[24]
Thevs N, Beckmann V, Akimalieva A, et al. 2017. Assessment of ecosystem services of the wetlands in the Ili River Delta, Kazakhstan. Environmental Earth Sciences, 76(1): 30. DOI: 10.1007/s10661-022-09836-6.

DOI

[25]
Wang X F, Fu X X, Chu B Y, et al. 2021. Spatio-temporal variation of water yield and its driving factors in Qinling Mountains Barrier Region. Journal of Natural Resources, 36(10): 2507-2521. (in Chinese)

DOI

[26]
Wei X M, Huang F, Cao J H, et al. 2021. The trends and characteristics of runoff and sediment in different geological background regions in the middle and upper reaches of Guijiang River. Journal of China Hydrology. DOI: 10.19797/j.cnki.1000-0852.20210235. (in Chinese)

DOI

[27]
Xiao Y, Xiao Q, Ouyang Z Y, et al. 2015. Assessing changes in water flow regulation in Chongqing region, China. Environmental Monitoring and Assessment, 187(6): 362. DOI: 10.1007/s10661-015-4370-4.

DOI PMID

[28]
Xu J, Xiao Y, Li N, et al. 2015. Spatial and temporal patterns of supply and demand balance of water supply services in the Dongjiang Lake Basin and its beneficiary areas. Journal of Resources and Ecology, 6(6): 386-396.

DOI

[29]
Xu J, Xiao Y, Xie G D, et al. 2016. Spatiotemporal analysis of water supply service in the Dongjiang. Acta Ecologica Sinica, 36(15): 4892-4906. (in Chinese)

[30]
Xu X B, Yang G S, Tan Y, et al. 2018. Ecosystem services trade-offs and determinants in China’s Yangtze River Economic Belt from 2000 to 2015. Science of the Total Environment, 634: 1601-1614.

DOI

[31]
Xu Y P, Zhang X J, Ran Q H, et al. 2013. Impact of climate change on hydrology of upper reaches of Qiantang River Basin, East China. Journal of Hydrology, 483: 51-60.

DOI

[32]
Yang J, Xie B P, Zhang D G. 2020. Spatio-temporal variation of water yield and its response to precipitation and land use change in the Yellow River Basin based on InVEST model. Chinese Journal of Applied Ecology, 31(8): 2731-2739. (in Chinese)

DOI

[33]
Yang Y D, Wei M C. 2004. Discussion on water resource crisis in Lijiang River Catchment. Forest Research, 17(6): 782-786. (in Chinese)

[34]
Zhang C Q, Li W H, Zhang B, et al. 2012. Water yield of Xitiaoxi River Basin based on InVEST modeling. Journal of Resources and Ecology, 3(1): 50-54.

DOI

[35]
Zhang J, Lei G, Qi L H. 2020. Temporal and spatial dynamics and scenario simulation of water yield in Danjiangkou Reservoir Area. Scientia Silvae Sinicae, 56(11): 12-20. (in Chinese)

[36]
Zhou W Z, Liu G H, Pan J J. 2005. Distribution of available soil water capacity in China. Journal of Geographical Sciences, 15(1): 3-12.

DOI

Outlines

/