Ecosystem Assessment

Research on Ecosystem Service Consumption in Guilin City

  • ZHANG Changshun , 1, 2, * ,
  • XIE Gaodi 1, 2 ,
  • ZHEN Lin 1, 2
Expand
  • 1. Institute of Geographic Sciences and Natural Resources Research, Chinese Academy of Sciences, Beijing 100101, China
  • 2. University of Chinese Academy of Sciences, Beijing 100049, China
*ZHANG Changshun, E-mail:

Received date: 2021-10-24

  Accepted date: 2022-03-02

  Online published: 2023-01-31

Supported by

The Strategic Priority Research Program of Chinese Academy of Sciences(XDA20010202)

The Science and Technology Major Project of Guangxi(AA20161002-3)

Abstract

Research on ecosystem service consumption not only helps to reveal the utilization intensity and management level of the ecosystem in Guilin, but it also provides a scientific basis for ecosystem investment, trade, subsidies and taxation by the Guilin government departments. Based on household survey data of urban and rural ecological consumption, the physical quantity accounting method is adopted for multivariate statistical analyses, such as analysis of variance and multiple comparison. This analysis reveals the differences and changes in the consumption level, consumption structure and consumption pattern of the main ecological products in Guilin among the various counties. The results fit into four main themes. (1) The annual per capita consumption of the main ecological products in Guilin varies either extremely significantly or significantly among the counties, but the consumption level of ecological products varies according to the type of products. There are significant or extremely significant differences in the annual per capita consumption of cereals, melons and fruits, pork, poultry, beef and mutton, fresh eggs and milk between urban and rural residents. (2) There are extremely significant differences in the annual per capita consumption of fruits, pork, poultry, beef and mutton, fish, fresh milk and vegetable oil among urban residents in different counties. There are also extremely significant differences in the annual per capita consumption of cereals, pork, poultry and alcohol among rural residents in different counties, and significant differences in the annual per capita consumption of fresh eggs and milk. The consumption level of ecological products by urban and rural resident varies with the type of products. (3) The ecological consumption patterns of all counties in Guilin mainly follow the “cereal + vegetable + fruit + meat” pattern for urban residents and the “cereal + vegetable + meat” pattern for rural residents (except for the rural residents in Pingle, which show the “cereal + vegetable” pattern). The consumption structure of urban residents is better than that of rural residents. (4) There is a large gap between the ecological consumption of urban and rural residents in Guilin and China's recommended standards, except for cereals and meat. The main problems are excessive meat intake, and insufficient intake of dark vegetables, fruits, eggs, milk and fish. Therefore, we should make full use of forestland, grassland, water and other resources in the area, and vigorously develop fishery, fruit and vegetable production and herbivorous animal husbandry to meet people's ecological needs for dark fruits and vegetables, eggs, milk and fish in Guilin City.

Cite this article

ZHANG Changshun , XIE Gaodi , ZHEN Lin . Research on Ecosystem Service Consumption in Guilin City[J]. Journal of Resources and Ecology, 2023 , 14(1) : 186 -194 . DOI: 10.5814/j.issn.1674-764x.2023.01.018

1 Introduction

Ecosystem services are the material basis of human development, and the natural source of human survival that is formed and maintained in ecosystems and ecological processes (Xie et al., 2008). The consumption of ecosystem services refers to the consumption, utilization and occupation of the services provided by the ecosystem by the human society. It is the manifestation of the value of ecosystem services, and it can be measured by quantity or value indicators (Zhen et al., 2008). In a specific area, people prefer to consume the ecological services provided by the ecosystem in that area. In addition to the diverse and increasing consumption intensity of ecosystem services, the consumption intensity of natural ecosystems has far exceeded their carrying capacity. Therefore, human activities have become one of the main factors of global ecosystem degradation (World Wildlife Fund, 2004). High-intensity ecological consumption has caused the contradiction between sustainably maintaining the supply capacity of ecological services and the economic growth of society to becoming increasingly prominent (Vitousek et al., 1997). Thus, ecological service consumption has received much attention in the field of ecological service research (Zhen et al., 2012). The general office of the CPC Central Committee and the General Office of the State Council issued the “Opinions on Establishing and Improving the Mechanism for Realizing the Value of Ecological Products” on April 26, 2021, and they also issued a notice requiring all regions and departments to conscientiously implement this directive in light of their actual conditions (Zhang and Zhou, 2021). This action fully shows that the consumption of ecological services has become a new field of ecological research.
According to Zhen et al.’s research, the consumption pattern of ecosystem services refers to the main characteristics of consumption within a certain period of time, including the main characteristics of the consumption content, consumption fee level, consumption structure, consumption pattern, consumption trend and other aspects of consumption (Zhen et al., 2010). The consumption pattern of ecosystem services examined in this paper refers to the level and structure of regional agriculture, forestry, animal husbandry, fishery and other ecological products as food consumption under specific natural conditions, as well as the social and economic development level and ethnic customs in a specific region.
Guangxi is an autonomous region dominated by the Zhuang nationality and inhabited by many nationalities. It has a unique regional food culture, with more than 1500 kinds of famous dishes, basically forming a complete Guangxi Cuisine System. The Northern Guangxi Flavor is the leader in the Guangxi Cuisine System, and Guilin Cuisine is the primary representative of the Northern Guangxi Flavor, which is deeply loved by the majority of tourists. There are many reports on Guilin Cuisine, but such reports mainly focus on some specific type of cuisine (Wang et al., 2007; Suo, 2015; Huang et al., 2018), and lack systematic research on the consumption level, consumption structure and consumption pattern of ecological products. Until now, only one report has explored the regional human-food relationship and its coordinating countermeasures in Guilin based on the food consumption structure (Zhou et al., 2000), but there is especially a lack of research on the differences of ecological consumption between different regions in urban and rural areas. In addition, there is a lack of such research for Guangxi Autonomous Region in general. Therefore, this study on the ecological consumption level, consumption structure and consumption pattern of Guilin, which is an international tourism city and a sustainable development demonstration area, will provide a scientific basis for the future decision-making of Guilin government departments in the areas of production and investment, trade, subsidies and taxation of ecosystem services.

2 Overview and research method

2.1 Overview

Guilin is located in the southwest of the Nanling Mountain system and the northeast of Guangxi, between 109°45°‒ 110°40°E and 24°18°‒25°41°N. According to the data of “Guilin social and economic statistical yearbook 2020”, Guilin includes six districts (Xiufeng, Xiangshan, Qixing, Diecai, Yanshan and Lingui) and 11 surrounding counties (Lingchuan, Xing’an, Quanzhou, Yangshuo, Pingle, Lipu, Longsheng, Yongfu, Gongcheng, Ziyuan and Guanyang), and the spatial distribution of the administrative divisions is shown in Fig. 1. The total administrative area is 2.78×10⁴ km2, of which the urban area is 565 km2. By the end of 2019, the total population of Guilin City was 5.29 million, including 1.28 million in the urban area (Editorial Board of Guilin Social and Economic Statistics Yearbook, 2020). Guilin is a typical “Karst” landform, belonging to the type of mountainous and hills. Among the landforms, mountains and hills account for 76.56%, plains account for 17.45%, water surface accounts for 4.04% and tableland accounts for 1.95%. The climate of Guilin belongs to the mid-subtropical monsoon climate, with a superior climate, abundant heat, mild and humid conditions all year round, sufficient light and rainfall, a long summer and a short winter, and it also has four distinct seasons. The annual average temperature is 16.5-20.5 ℃. The average frost-free period is 309 days, and the annual average rainfall is 1395.1-2006.4 mm. The annual average evaporation is 1490-1905 mm. The annual average relative humidity is 73%-79% (Hou, 2006).
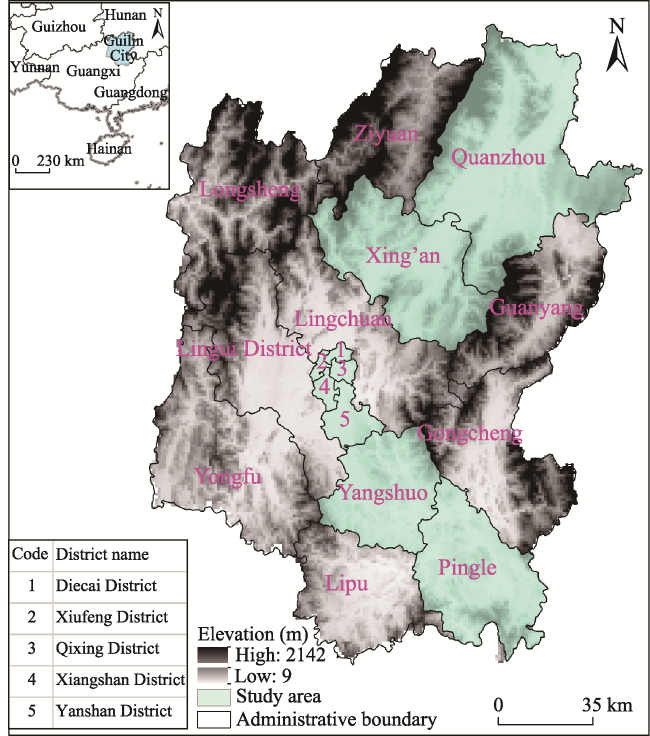
Fig. 1 Administrative divisions of the study area

2.2 Data source and data analysis

Food consumption data mainly came from “Guilin Survey Yearbook 2016” (Survey Office of the National Bureau of Statistics in Guilin, 2016), and the data were retrieved from the CNKI statistical yearbook database (https://data.cnki.net/yearbook/Single/N2019120486). In our study, the Guilin municipal district includes five districts (Xiufeng, Xiangshan, Qixing, Diecai and Yanshan) and the four surrounding counties (Quanzhou, Xing’an, Yangshuo and Pingle). Because there are no significant differences in ecological consumption between different municipal districts for urban or rural residents, we regarded the different Guilin municipal districts as a test site. This study uses the physical quantity method for accounting. The ecological consumption pattern was mainly determined by the composition of ecological products that accounted for more than 10% of the annual per capita ecological consumption. Firstly, the proportion of each type of the main ecological products in the annual per capita ecological consumption (APCEC) was calculated, and then the ecological products which accounted for more than 10% of the annual per capita ecological consumption were selected, and finally the types and names of the ecological consumption patterns were determined according to their proportions (Liang et al., 2019). The statistical analysis methods used in this study are mainly analysis of variance and multiple comparisons using SPSS 19.0. When the results of analysis of variance were significantly different at least at P<0.01 or P<0.05, the least significance difference method was used for multiple comparison (SPSS Version 19.0, 2015).

3 Results and discussion

3.1 Differences in food consumption between the different regions

The annual per capita consumption of melons and fruits, pork, poultry, beef and mutton, aquatic products, fresh eggs, fresh milk, vegetable oil and alcohol among counties are significantly different (P < 0.01), but not the annual per capita cereal and vegetable consumption (P < 0.05). The annual per capita consumption of fresh milk and vegetables are not significantly different among urban and rural areas, while the annual per capita consumption of fresh eggs varies significantly, and the differences in the annual per capita ecological consumption of cereals, melons and fruits, pork, poultry, beef and mutton, aquatic products and alcohol are extremely significant. These results are consistent with CNS’ research which found that the food consumption was unbalanced between urban and rural areas in China, and there is an urgent need to improve the dietary structure in rural areas (Chinese Nutrition Society, 2021).
The interaction between urban and rural areas among different counties has a significant impact on the annual per capita consumption of vegetables and alcohol. This interaction also has an extremely significant impact on the annual per capita consumption of pork, poultry, beef and mutton, aquatic products and fresh milk (Table 1).
Table 1 Analysis of variance and fisher value of annual per capita ecological consumption (APCEC) among districts, counties and urban and rural residents
Indicators Cereals Vegetables Fruits Pork Poultry Mutton and beef Fish Eggs Milk Oil crops Alcohol
Counties 3.40* 2.91* 6.78** 24.27** 24.05** 21.79** 17.19** 5.14** 13.67** 8.78** 17.38**
Rural-urban 29.12** 1.73 99.78** 97.23** 174.31** 404.58** 201.89** 5.14* 0.15 2.89 70.81**
Counties×Rural-urban 2.02 3.50* 2.40 7.26** 7.88** 18.62** 10.13** 1.89 6.38** 0.15 4.11*

Note: *, ** significant at P < 0.05 level and P < 0.01 level, respectively. The same notation applies to the tables below.

The annual per capita food consumption varies between districts and counties depending on the type of food. However, the annual per capita consumption of melons and fruits, pork, poultry, beef and mutton, aquatic products and alcohol in Quanzhou are very significantly or extremely significantly higher than in Guilin municipal district, Yangshuo, Xing’an, or Pingle which has the lowest level. The annual cereal consumption is the highest in Xing’an County and the lowest in Yangshuo, but there is no significant difference between Yangshuo and Pingle. There is also no significant difference among Guilin municipal district, Xing’an and Quanzhou. The annual per capita consumption of vegetables in Pingle is significantly higher than all the others except for Xing’an, and there is no significant difference among the other counties. The annual per capita vegetable oil consumption in Pingle is significantly higher than in the other counties, and there is no significant difference among the others. The annual per capita consumption of fresh eggs and milk in Xing’an are significantly higher than in Yangshuo and Pingle, but there is no significant difference with Guilin municipal district or Quanzhou (Table 2). The annual per capita food and alcohol consumption of rural residents are significantly higher than those of urban residents, while the annual per capita consumption of fruits, pork, poultry, beef and mutton, fish and eggs are less than those of urban residents (Table 3).
Table 2 Multiple comparisons of APCEC among different counties (Unit: kg p-1 yr-1)
Indicators Guilin municipal district Yangshuo Xing’an Quanzhou Pingle
Cereals 132.33Aa 102.23Ab 148.77Aa 130.83Aa 125.55Aab
Vegetables 84.77Ab 75.22Ab 92.93Aab 82.97Ab 106.37Aa
Fruits 38.62ABb 34.58Bbc 37.40Bb 51.70Aa 26.30Bc
Pork 28.77Bb 24.80Cc 29.37Bb 36.47Aa 25.27BCc
Poultry 12.97Aab 10.13Bc 12.55Ab 14.12Aa 7.87Cd
Mutton and beef 2.07Bb 1.37Cc 1.30Cc 2.65Aa 1.27Cc
Fish 8.33Bb 7.90Bb 5.42Cc 10.67Aa 5.55Cc
Eggs 4.90ABa 3.82Bb 5.37Aa 5.13ABa 3.68Bb
Milk 6.38Aa 2.15Cc 8.50Aa 5.28Ba 1.92Cc
Oil crops 5.40Bb 5.20Bb 3.42Bb 3.20Bb 11.52Aa
Alcohol 11.67Bb 9.42Bb 11.23Bb 15.88Aa 5.87Cc

Note: Different upper-case and lower-case letters represent significant differences at P<0.01 and P<0.05 levels, respectively, using LSD’s multiple comparative analysis.

Table 3 Comparison of APCEC between urban and rural areas (Unit: kg p-1 yr-1)
Indicators Urban Rural Indicators Urban Rural
Cereals 105.97B 149.92A Fish 10.91A 4.23B
Vegetables 92.54ns 84.36ns Eggs 4.91a 4.24b
Fruits 53.45A 21.99B Milk 4.71ns 4.98ns
Pork 33.12A 24.75B Oil crops 6.61ns 4.88ns
Poultry 14.55A 8.51B Alcohol 7.53B 14.10A
Mutton and beef 2.91A 0.55B

Note: Different upper-case and lower-case letters represent significant differences at P<0.01 and P<0.05 levels, respectively, using LSD’s multiple comparative analysis. ns indicates no significant difference.

3.2 Differences in food consumption for urban resident among different regions

The annual per capita consumption of cereals, vegetables, fresh eggs and alcohol of urban residents have no significant differences among the different counties, but the consumption of other ecological products varies significantly among urban residents. Moreover, the consumption levels of various ecological products by urban residents are not completely consistent among the different counties. The annual per capita consumption of melons and fruits, pork, mutton and beef, poultry and aquatic products in Quanzhou County are the highest, while those in Pingle, Yangshuo and Xing’an are relatively low. The annual per capita consumption of fresh milk is the highest in Xing’an and the lowest in Pingle, there are 8.50 and 1.92 kg p-1 yr-1 (kilograms per person per year), while that of oil crops is the highest in Pingle and the lowest in Xing’an (Table 4).
Table 4 Differences in the APCEC of urban residents between different regions (Unit: kg p-1 yr-1)
Indicators Guilin municipal district Yangshuo Xing’an Quanzhou Pingle F
Cereals 102.87 90.30 108.10 112.77 115.80 0.49ns
vegetables 94.30 78.17 81.63 105.73 102.87 1.59ns
Fruits 54.07Bb 48.67Bbc 47.50Bbc 76.50Aa 40.53Bc 17.36**
Pork 31.73Bb 27.30Bb 31.00Bb 43.83Aa 31.73Bb 19.48**
Poultry 15.67Bb 12.80BCc 13.80BCbc 19.33Aa 11.13Cd 17.03**
Mutton and beef 3.33Bb 2.33BCc 2.03Cc 4.77Aa 2.07Cc 24.67**
Fish 11.77Bb 10.73BCb 7.67Cc 16.83Aa 7.57Cc 19.82**
Eggs 5.50 4.40 5.10 5.07 4.50 0.96ns
Milk 8.07ABab 0.40Cc 10.73Aa 3.97BCbc 0.40Cc 11.69**
Oil crops 6.43Bb 5.43Bb 4.20Bb 4.67Bb 12.33Aa 19.86**
Alcohol 7.60 6.43 7.63 10.60 5.37 2.12ns

Note: Different upper-case and lower-case letters represent significant differences at P<0.01 and P<0.05 levels, respectively, using LSD’s multiple comparative analysis.

The APCEC values of many ecological products vary significantly between different regions, as well as between urban and rural areas, which may be mainly related to the supply capacity of the regional ecological products and the levels of regional social and economic development. The highest APCEC of most ecological products in Quanzhou County should be related to its most abundant arable lands. For example, the highest APCEC of milk in Xing’an county should be related to its most abundant grasslands, while the higher APCEC of most ecological products in Guilin municipal districts should be related to its highest level of social and economic development.

3.3 Differences in food consumption for rural residents between different regions

Besides melons and fruits, beef and mutton, aquatic products and oil crops, the annual per capita consumption of cereals, pork, poultry and alcohol in rural areas vary with extreme significance among the counties. The variations in the annual per capita consumption of rural residents for vegetables, fresh eggs and fresh milk are significant among
the different counties. The annual per capita consumption of pork, fresh milk and alcohol in Quanzhou are the highest. The annual per capita consumption of cereals, poultry and fresh eggs in Xing’an are the highest, and the annual per capita vegetable consumption in rural areas in Pingle is the highest. Yangshuo and Quanzhou are the lowest in cereal and vegetable consumption, whereas Pingle is the lowest in the rural consumption of other foods (Table 5).
Table 5 Differences of rural residents’ APCEC among different regions (Unit: kg p-1 yr-1)
Indicators Guilin municipal district Yangshuo Xing’an Quanzhou Pingle Fvalue
Cereals 161.80ABab 114.17Bc 189.43Aa 148.90ABbc 135.30Bbc 6.39**
Vegetables 75.23Aab 72.27Ab 104.23Aa 60.20Ab 109.87Aa 4.80*
Fruits 23.17 20.50 27.30 26.90 12.07 1.00ns
Pork 25.80ABa 22.30BCb 27.73ABa 29.10Aa 18.80Cb 11.05**
Poultry 10.27ABa 7.47Bbc 11.30Aa 8.90ABb 4.60Cd 14.64**
Mutton and beef 0.80 0.40 0.57 0.53 0.47 1.73ns
Fish 4.90 5.07 3.17 4.50 3.53 1.87ns
Eggs 4.30ab 3.23b 5.63a 5.20a 2.87b 5.72*
Milk 4.70ab 3.90b 6.27a 6.60a 3.43b 3.96*
Oil crops 4.37 4.97 2.63 1.73 10.70 2.64ns
Alcohol 15.73Bb 12.40Bb 14.83Bb 21.17Aa 6.37Cc 23.36**

Note: Different upper-case and lower-case letters represent significant differences at P<0.01 and P<0.05 levels, respectively, using LSD’s multiple comparative analysis. *, ** significant at P < 0.05 level and P < 0.01 level, respectively; ns indicates no significant difference at P < 0.05 level.

3.4 Differences in consumption patterns between urban and rural residents

The annual per capita consumption of cereals, milk and alcohol of rural residents are higher than those of urban residents, while the others are lower than those of urban residents. These results indicate that the annual per capita ecological consumption of rural residents is less than that of urban residents. Based on the consumption structure of ecological products, and the types of ecological products which account for ≥ 10% of the annual per capita ecological consumption (Fig. 2), the urban and rural ecological consumption patterns of Guilin city are “cereal + vegetable + fruit + meat” and “cereal + vegetable + meat”, respectively.
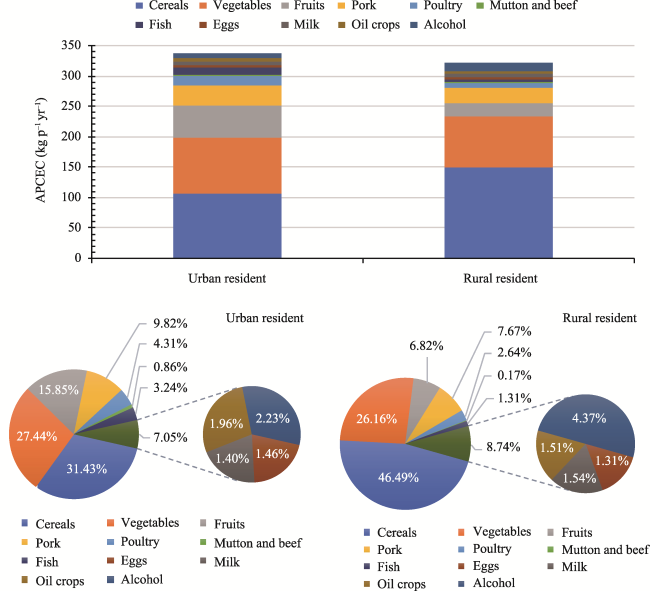
Fig. 2 Differences in ecological consumption patterns between urban and rural residents
In the “cereal + vegetable + fruit + meat” pattern of urban residents, the consumption proportions of cereals, milk and alcohol are lower than those of the pattern of “cereal + vegetable + meat” for rural residents, while the consumption proportions of other types of ecological products are higher than those of rural residents (Fig. 2).
The proportion of urban residents’ consumption of ecological products and rural residents' consumption of ecological products is the highest in beef and mutton, up to 5.1-fold; the second is fish, up to 2.5-fold; and the third is vegetables, up to 2.3-fold (Fig. 2). These patterns show that rural residents have high consumption potential for beef, mutton, fish and vegetables.
The results indicate that the total ecological consumption in urban areas is higher than that in rural areas. The total ecological consumption of urban and rural residents in each region ranked differently. Among them, the total consumption of urban residents is in the order of Quanzhou > Guilin municipal district > Pingle > Xing’an > Yangshuo, while the total ecological consumption of rural residents is ordered as Xing’an > Guilin municipal district > Quanzhou > Pingle > Yangshuo (Fig. 3).
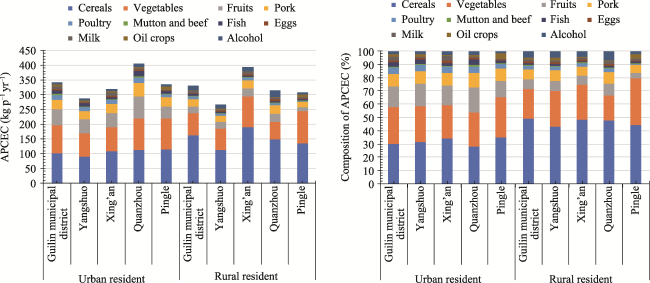
Fig. 3 Differences in ecological consumption patterns in urban and rural residents among regions
Although there are some differences in the proportions of ecological product consumption among counties, the ecological consumption levels of urban residents are all represented by the pattern of “cereal + vegetable + fruit + meat”. There are also some differences in the ecological consumption patterns of rural residents among different counties. The rural residents in Pingle are in the “cereal + vegetable” pattern (with the sum of pork, poultry, beef and mutton consumption accounting for about 7.75%), while that of the rural residents in other counties are in the “cereal + vegetable + meat” pattern (with the sum of pork, poultry, beef and mutton consumption accounting for more than 10%) (Fig. 3).

3.5 Differences in ecological consumption between actual and recommended values

There is still a wide gap between the daily per capita ecological consumption of major counties in Guilin city and the recommended consumption in China (Chinese Nutrition Society, 2021). Only cereal and meat consumption roughly reached the recommended levels in China (except the cereal consumption of urban residents in Yangshuo), while the consumption of other types of ecological products such as vegetables, fruits, fish, eggs and milk lag far behind the recommended consumption levels in China. The daily per capita consumption of vegetables by rural residents in Pingle and fruits and fish by urban residents in Quanzhou are slightly higher than the recommended consumption levels in China. These results are consistent with other studies, which revealed that the intake of dark vegetables, fruits, milk, fish and shrimp by Chinese residents were insufficient (Lu et al., 2015; Chinese Nutrition Society, 2021). Compared with the level of ecological consumption of China in 2014, the ecological consumption of urban residents in major counties in Guilin has improved considerably (Ma et al., 2016). The daily per capita consumption of vegetables, eggs and milk of urban residents in most counties are lower than the national average levels (Table 6). This shows that the ecological consumption structure of urban and rural residents in major counties in Guilin needs to be improved, and the potential for improvement is greater for rural residents than urban residents. The types of products to be promoted are vegetables, fruits, fish, eggs, milk, etc. The milk consumption is particularly low. The milk consumption of rural residents accounts for about 1.4% of the recommended amount, and that of urban residents accounts for about 3.8%. Although these are higher than the average level of Guangxi Province in 2009 (Fang et al., 2013), they are far lower than the recommended level. The meat consumption of urban and rural residents in most counties is more than 2.0 times as much as China’s recommended standard, which is consistent with the fact that the meat consumption in Guangxi is generally 2-3 times higher than the national standard (Fang et al., 2013).
Table 6 Differences between actual and recommended ecological consumption levels in Guilin (Unit: g p-1 d-1)
Indicators Cereals Vegetables Fruits Meat Fish Eggs Milk
Chinese recommended food consumption (Chinese Nutrition Society, 2021) 250-400 300-500 200-3500 40-75 40-75 40-50 300
China average in 2014 (Ma et al., 2016) 386.30 265.48 115.62 70.14 29.59 23.56 34.52
Urban residents Guilin municipal district 281.83 258.36 148.13 139.00 32.24 15.07 22.10
Yangshuo 247.40 214.16 133.33 116.26 29.41 12.05 1.10
Xing’an 296.16 223.65 130.14 128.31 21.00 13.97 29.41
Quanzhou 308.95 289.68 209.59 186.12 46.12 13.88 10.87
Pingle 317.26 281.83 111.05 123.11 20.73 12.33 1.10
Rural residents Guilin municipal district 443.288 206.12 63.47 101.00 13.42 11.78 12.88
Yangshuo 312.785 197.99 56.16 82.65 13.88 8.86 10.68
Xing’an 518.995 285.57 74.79 108.49 8.68 15.43 17.17
Quanzhou 407.945 164.93 73.70 105.57 12.33 14.25 18.08
Pingle 370.685 301.00 33.06 65.39 9.68 7.85 9.41
Therefore, Guilin should make full use of grassland, wetland and other resources, vigorously develop herbivorous animal husbandry and aquaculture, and improve the output of eggs, milk and aquatic products (Zhou et al., 2000). At the same time, Guilin should make full use of idle fields, crop straw and other resources, to reduce the competition with rations for water and land, and improve the utilization rates of resources. In addition, Guilin should make full use of cultivated land and forest land to establish large fruit and vegetable bases, develop intensive agriculture, and constantly meet the growing needs of people for fruits and vegetables, fish, eggs and milk (Ma et al., 2016).

4 Conclusions

Based on the household survey data of urban and rural food consumption in the “Annual survey of Guilin in 2016”, this study adopted the physical quantity accounting method and conducted multivariate statistical analyses such as analysis of variance and multiple comparisons to reveal the differences and changes in the consumption levels, structures and patterns among different counties in Guilin for the main ecological products such as cereals, vegetables and fruits. This analysis led to four main conclusions.
(1) The annual per capita consumption of the main ecological products in Guilin vary significantly or extremely significantly among counties, but the ranking of ecological consumption in the different counties vary according to product types. For example, the annual per capita fruit consumption is the highest in Quanzhou and the lowest in Pingle, while the cereal consumption is the highest in Xing’an and the lowest in Yangshuo. Only the annual per capita consumption levels of cereals and alcohol of rural residents are significantly higher than those of urban residents, while the consumption levels of fruits, pork, poultry, beef and mutton, fish and eggs are either significantly or extremely significantly lower than those of urban residents. Except for the consumption levels of cereals, melon and fruit, fresh eggs and vegetable oil, the influences of urban and rural×counties on the consumption of other ecological products were very significant or significant.
(2) There are extremely significant differences among different counties in the annual per capita consumption of fruits, pork, poultry, beef and mutton, fish, fresh milk and vegetable oil of urban residents. There are also extremely significant differences among different counties in the annual per capita consumption of cereals, pork, poultry and alcohol of rural residents, and the annual per capita consumption of vegetables, fresh eggs and fresh milk are significantly different. The consumption levels of the main ecological products of urban and rural residents vary among counties due to different product types.
(3) Based on the fact that the proportions of ecological products in the annual per capita consumption are > 10%, the ecological consumption patterns of urban and rural residents of Guilin can be mainly divided into the “cereal + vegetable + fruit + meat” pattern for urban residents and the “cereal + vegetable + meat” pattern for rural residents (except for rural residents in Pingle, which show a “cereal + vegetable” pattern). The consumption structure of urban residents is better than that of rural residents. The proportions of vegetables, fruits, fish, eggs and vegetable oil for urban residents are higher than those of rural residents, while the proportion of cereals and alcohol of rural residents are less than those of urban residents.
(4) The ecological consumption levels for most products by urban and rural residents in Guilin are far below the Chinese recommended standards, except for cereal and meat consumptions. The main problems are unbalanced diet, excessive meat intake, and insufficient intake of dark vegetables, fruits, eggs, milk and fish. Therefore, it is crucial to make full use of forest land, grassland, water and other resources, as well as to vigorously develop fishery, fruit and vegetable production and herbivorous animal husbandry, and to constantly meet people’s ecological needs for dark fruits and vegetables, eggs, milk and fish.
This research can not only provide guidance for the study of balanced diets and nutrition for urban and rural residents, but it can also provide a scientific basis for the ecosystem investment, trade, subsidies and taxation of Guilin municipal government departments.
[1]
Chinese Nutrition Society. 2021. Scientific research report of dietary guidelines for Chinese residents 2021. in Chinese)

[2]
Editorial Board of Guilin Economic and Social Statistics Yearbook. 2020. Guilin economic and social statistical yearbook 2020. Beijing, China: China Statistics Press. (in Chinese)

[3]
Fang Z, Tang Z, Yang H, et al. 2013. Trend analysis of the dietary structural changes in six cities (Counties) in Guangxi Province from 1989 to 2009. Food and Nutrition in China, 19(12): 68-73. (in Chinese)

[4]
Hou M. 2006. Study on mercury morphological characteristics and influencing factors of soil crop system in Guilin City. Doctoral dissertation, Chengdu, China: Chengdu University of Technology. (in Chinese)

[5]
Huang A, Lei Y, Zhou S. et al. 2018. A probe into the English translation of Guilin’s characteristic cuisine. Journal of Guilin University of Aeronautics and Astronautics, (1): 132-136. (in Chinese)

[6]
IBM Corp. 2015. IBM SPSS statistics for windows, Version 24.0. Armonk, USA: IBM Corp.

[7]
Liang Y, Zhen L, Jia M M, et al. 2019. Consumption of ecosystem services in Laos. Journal of Resources and Ecology, 10(6): 641-648.

DOI

[8]
Lu W, Yang H, Meng X, et al. 2015. Investigation on dietary pattern of urban and rural residents in Guangxi. Strait Journal of Preventive Medicine, 21(3): 3-4. (in Chinese)

[9]
Ma Y, Xu H, Guo Y. 2016. Development of Chinese residents’ food consumption structure and future development policy suggestions. Food and Nutrition in China, 23(11): 46-50. (in Chinese)

[10]
Millennium Ecosystem Assessment. 2005. Ecosystems and human well-being:Synthesis. Washington DC, USA: Island Press.

[11]
Suo W. 2015. Analysis of the development of local catering industry—A case study of Guilin rice noodles. Journal of Guangxi Vocational Staff Technical College, 18(1): 16-20. (in Chinese)

[12]
Survey Office of the National Bureau of Statistics in Guilin. 2016. Guilin survey yearbook 2016. Beijing, China: China Statistics Press. (in Chinese)

[13]
Vitousek P M, Mooney H A, Lubchenco J, et al. 1997. Human domination of earth’s ecosystems. Science, 277(5325): 494-499.

DOI

[14]
Wang X, Wu Z, Zhong Y. 2007. Market demand analysis of gourmet tourism—A case study of Guilin World Gourmet Expo Park. Journal of Leshan Teachers College, 22(5): 55-58. (in Chinese)

[15]
WWF (World Wildlife Fund). 2004. Living planet report 2004. Gland, Switzerland: WWF.

[16]
Xie G D, Zhen L, Lu C X, et al. 2008. Supply, consumption and valuation of ecosystem services in China. Resources Science, 30(1): 93-99. (in Chinese)

[17]
Zhang L J, Zhou Y. 2021. The path exploration of establishing and perfecting the value realization mechanism of ecological products. Acta Ecologica Sinica, 41(19): 7893-7899.. (in Chinese)

[18]
Zhen L, Liu X L, Li F, et al. 2010. Consumption of ecosystem services and eco-compensation mechanism in ecological sensitive regions: Progress and challenges. Resources Science, 32(5): 797-803. (in Chinese)

[19]
Zhen L, Liu X L, Wei Y J. 2008. Consumption of ecosystem services: Models, measurement and management framework. Resources Science, 30(1): 100-106. (in Chinese)

[20]
Zhen L, Yan H M, Hu Y F, et al. 2012. Consumption of ecosystem goods and services and its impact assessment. Resources Science, 34(6): 989-997. (in Chinese)

[21]
Zhou S, Zhu F, Peng B, et al. 2000. Study on regional man-grain relationship and its coordination in Guilin City. Scientia Geographica Sinica, 20(1): 79-83. (in Chinese)

Outlines

/