
Journal of Resources and Ecology >
Impacts of CO2 Enrichment on Water Use Efficiency in Terrestrial Ecosystems: A Meta-analysis of Experimental Manipulations
Received date: 2021-05-20
Accepted date: 2022-04-27
Online published: 2023-01-31
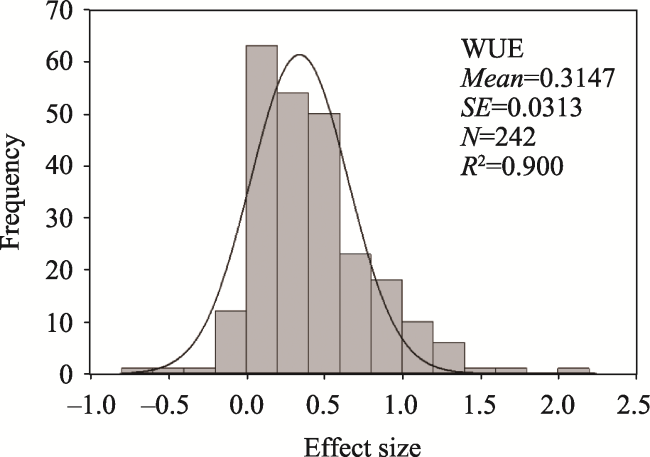
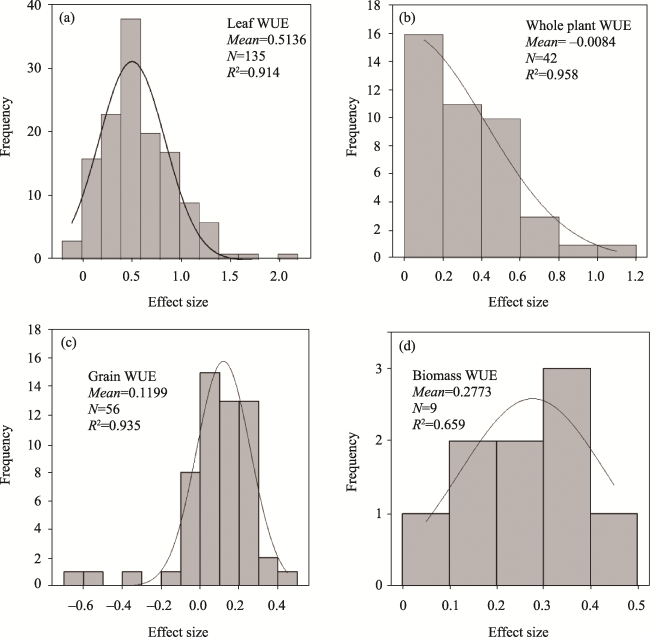
Elevated CO2 (eCO2) has important impacts on plants, especially on water use efficiency (WUE). A meta-analysis was performed to determine the responses of WUE to enriched CO2. We summarized 242 studies on WUE research under ambient and enriched CO2 conditions that were published between 1989 and 2019. Our results showed that WUE had positive responses to elevated CO2 with an increase of about 46% and high heterogeneity. Elevated CO2 increased leaf, grain, biomass and whole plant WUE by 76%, 9%, 30% and 37%, respectively. The effect size on leaf WUE was higher than the other three WUE types, and the effect size on whole plant WUE was higher than grain WUE (P<0.05). In another respect, the response of WUE in forests was higher than in cropland (P<0.05). Regarding different experimental methods, WUE had a stronger response to elevated CO2 by the method of climate-controlled chamber than by the methods of OTC (Open Top Chamber) or greenhouses (P<0.05). However, the effect size obtained by the method of greenhouse was higher than that obtained by the methods of either OTC or climate chamber for whole plant WUE (P<0.05). Furthermore, our results found WUE had a positive linear relationship with the magnitude of CO2 enrichment (P<0.05). Meanwhile, the effect size of elevated CO2 on grain WUE had a positive linear relationship with the duration of CO2 enrichment. This study found that the impacts of CO2 enrichment on WUE are unique and specific for different WUE types and the various experimental conditions.
Key words: elevated CO2; water use efficiency; forest; cropland; Open Top Chamber
ZOU Jingru , LI Shuai . Impacts of CO2 Enrichment on Water Use Efficiency in Terrestrial Ecosystems: A Meta-analysis of Experimental Manipulations[J]. Journal of Resources and Ecology, 2023 , 14(1) : 167 -176 . DOI: 10.5814/j.issn.1674-764x.2023.01.016
Table 1 Studies included in the meta-analysis |
| Ecosystem | Location | CO2 enrichment method | Reference |
|---|---|---|---|
| Cropland | Australia | Climate chamber | Shabbir et al., 2019 |
| Cropland | Australia | FACE | O’Leary et al., 2015 |
| Cropland | Brazil | FACE | Ghini et al., 2015 |
| Cropland | Canada | Climate chamber | Dahal et al., 2014 |
| Cropland | China | Climate chamber | Li et al., 2003 |
| Cropland | China | Climate chamber | Li et al., 2013 |
| Cropland | China | Climate chamber | Liu et al., 2020 |
| Cropland | China | Climate chamber | Pan et al., 2020 |
| Cropland | China | OTC | Li et al., 2019 |
| Cropland | China | OTC | Qiao et al., 2010 |
| Cropland | Denmark | Climate chamber | Kaminski et al., 2014 |
| Cropland | Hungary | Greenhouse | Varga et al., 2017 |
| Cropland | Portugal | OTC | Moutinho-Pereira et al., 2009 |
| Cropland | UK | Greenhouse | Centritto et al., 1999 |
| Cropland | USA | Climate chamber | Ephrath et al., 2011 |
| Cropland | USA | Climate chamber | Hui et al., 2001 |
| Cropland | USA | FACE | Conley et al., 2001 |
| Cropland | USA | FACE | Ruiz-Vera et al., 2013 |
| Forest | Brazil | Climate chamber | Oliveira and Marenco, 2019 |
| Forest | France | Greenhouse | Picon et al., 1996 |
| Forest | India | OTC | Hebbar et al., 2020 |
| Forest | Malaysia | Climate chamber | Ibrahim et al., 2010 |
| Forest | Panama | Greenhouse | Dalling et al., 2016 |
| Forest | Switzerland | OTC | Bucher-Wallin et al., 2000 |
| Forest | USA | Climate chamber | Norby and O’Neill, 1989 |
| Forest | USA | OTC | Leavitt et al., 2003 |
| Grassland | Czech Republic | Greenhouse | Holub et al., 2019 |
| Grassland | The Netherlands | Climate chamber | Schapendonk et al., 1997 |
| Wetland | Spain | Climate chamber | Mateos-Naranjo et al., 2010 |
Fig. 1 Frequency distribution of the effect size (lnR) on WUE with elevated CO2 for all studiesNote: The solid line is the fitted Gaussian (normal) distribution of the frequency data. |
Fig. 2 Frequency distributions of effect size (lnR) of elevated CO2 on (a) leaf WUE, (b) whole plant WUE, (c) grain WUE and (d) biomass WUENote: The solid lines are the fitted Gaussian (normal) distributions of the frequency data. |
Table 2 Rosenthal’s fail-safe numbers for assessing publication bias with three categorical grouping variables: WUE types, CO2 enrichment method and ecosystem types |
| Variable | Rosenthal’s fail-safe number | Variable | Rosenthal’s fail-safe number |
|---|---|---|---|
| Overall | 36114.6* | OTC | 136.5* |
| Leaf WUE | 13753.7* | Climate chamber | 350.8* |
| Forest | 589.3* | Grain WUE | 289.9 |
| Cropland | 8026.6* | Biomass WUE | 87.2* |
| Grassland | 35.2* | Forest | 2061.5* |
| Greenhouse | 536.5* | Cropland | 19150.6* |
| OTC | 98.6* | Grassland | 35.2* |
| Climate chamber | 8383.8* | Greenhouse | 2341.5* |
| Whole plant WUE | 1507.0* | OTC | 552.1* |
| Forest | 395.2* | Climate chamber | 11565.9* |
| Cropland | 339.6* | FACE | 269.8* |
| Greenhouse | 291.7* |
Note: * means the significant level is 0.05. |
Table 3 Results from the meta-analysis of the effects of elevated CO2 on WUE |
| Variable | Effect size | df | QT | P |
|---|---|---|---|---|
| WUE | 0.38±0.04 | 241 | 339.7 | 0.00003* |
Note: A random effects model was selected to carry out the meta-analysis, and assess whether QT is significant. * means the significant level is 0.05. |
Table 4 Results of the heterogeneity analysis among groups for WUE |
| Group | df | QM |
|---|---|---|
| WUE types | 3 | 1334.0* |
| Ecosystem types | 3 | 238.66* |
| eCO2 methods | 3 | 391.14* |
| Magnitude of treatment | 1 | 68.84* |
| Duration of treatment | 1 | 4.45* |
Note: * means the significant level is 0.05. |
Table 5 Relationships between the effect size of elevated CO2 on WUE and two continuous experimental variables |
| Variables | Range | Mean | Intercept | Slope | P |
|---|---|---|---|---|---|
| Magnitude of treatment (ppm) | 107-800 | 362.33 | 0.17 | 0.0006 | 0.00001* |
| Duration of treatment (yr) | 0.03-13 | 0.51 | 0.39 | -0.0150 | 0.39 |
Note: * means the significant level is 0.05. |
Table 6 Heterogeneity of leaf WUE, grain WUE, biomass WUE and whole plant WUE |
| WUE type | df | QT |
|---|---|---|
| Leaf WUE | 134 | 1802.26* |
| Grain WUE | 55 | 582.59* |
| Biomass WUE | 8 | 16.65* |
| Whole plant WUE | 41 | 492.29* |
Note: * means the significant level is 0.05. |
Table 7 Results of the heterogeneity analysis among groups for leaf WUE, grain WUE, biomass WUE and whole plant WUE |
| WUE type | Group | df | QM |
|---|---|---|---|
Leaf WUE | Ecosystem types | 3 | 187.1064* |
| eCO2 methods | 3 | 660.0788* | |
| Magnitude of treatment | 1 | 188.3747* | |
| Duration of treatment | 1 | 504.4072* | |
Grain WUE | Ecosystem types | - | - |
| eCO2 methods | 3 | 6.3199 | |
| Magnitude of treatment | 1 | 19.0557* | |
| Duration of treatment | 1 | 10.4979* | |
Biomass WUE | Ecosystem types | - | - |
| eCO2 methods | 1 | 1.4799 | |
| Magnitude of treatment | 1 | 0.9590 | |
| Duration of treatment | 1 | 1.0385 | |
Whole plant WUE | Ecosystem types | 1 | 58.7418* |
| eCO2 methods | 2 | 200.9703* | |
| Magnitude of treatment | 1 | 105.4783* | |
| Duration of treatment | 1 | 20.1892* |
Note: * means the significant level is 0.05. |
Table 8 Relationships between the effect sizes of elevated CO2 on WUE and the continuous experimental variables for the different WUE types |
| WUE type | Variable | Range | Mean | Intercept | Slope | P |
|---|---|---|---|---|---|---|
| Leaf WUE | Magnitude of treatment (ppm) | 120-800 | 374.35 | 0.25 | 0.0009 | 0.00007* |
| Duration of treatment (yr) | 0.03-13 | 0.44 | 0.58 | -0.03 | 0.22 | |
| Grain WUE | Magnitude of treatment (ppm) | 185-600 | 370.59 | 0.07 | 0.0000 | 0.78 |
| Duration of treatment (yr) | 0.2-3 | 0.54 | 0.05 | 0.07 | 0.03* | |
| Whole plant WUE | Magnitude of treatment (ppm) | 107-620 | 341.62 | 0.05 | 0.0007 | 0.0003* |
| Duration of treatment (yr) | 0.03-0.9 | 0.41 | 0.30 | 0.0090 | 0.93 |
Note: * means the significant level is 0.05. |
| [1] |
|
| [2] |
|
| [3] |
|
| [4] |
|
| [5] |
|
| [6] |
|
| [7] |
|
| [8] |
|
| [9] |
|
| [10] |
|
| [11] |
|
| [12] |
|
| [13] |
|
| [14] |
|
| [15] |
|
| [16] |
|
| [17] |
|
| [18] |
|
| [19] |
|
| [20] |
|
| [21] |
|
| [22] |
|
| [23] |
IPCC. 2007. Summary for policymakers. In: Solomon S, Qin D, Manning M, et al(Climate change 2007: The physical science basis, contribution of working group I to the fourth assessment report of the intergovernmental panel on climate change. Cambridge, eds.). UK: Cambridge University Press.
|
| [24] |
|
| [25] |
|
| [26] |
|
| [27] |
|
| [28] |
|
| [29] |
|
| [30] |
|
| [31] |
|
| [32] |
|
| [33] |
|
| [34] |
|
| [35] |
|
| [36] |
|
| [37] |
|
| [38] |
|
| [39] |
|
| [40] |
|
| [41] |
|
| [42] |
|
| [43] |
|
| [44] |
|
| [45] |
|
| [46] |
|
| [47] |
|
| [48] |
|
| [49] |
|
| [50] |
|
| [51] |
|
| [52] |
|
| [53] |
|
| [54] |
|
| [55] |
|
| [56] |
|
| [57] |
|
| [58] |
|
| [59] |
|
| [60] |
|
| [61] |
|
| [62] |
|
| [63] |
|
| [64] |
|
/
| 〈 |
|
〉 |