
Journal of Resources and Ecology >
The Landscape Pattern Characteristics and Spatial Distribution of the Rural Settlements in the Hejiang River Basin
|
YANG Baoqi, E-mail: ybaoqi66@163.com |
Received date: 2021-07-11
Accepted date: 2022-04-27
Online published: 2023-01-31
Supported by
The BaGui Scholars Program of Guangxi Zhuang Autonomous Region(2019BG04)
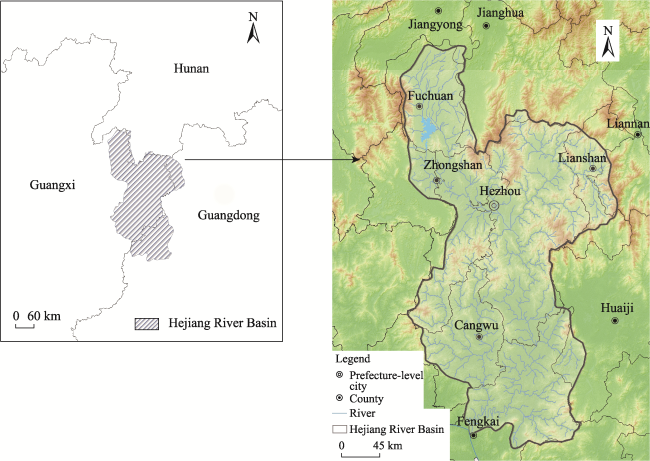
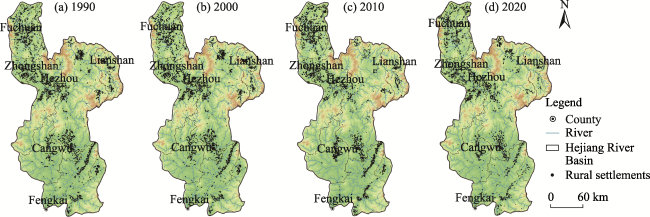
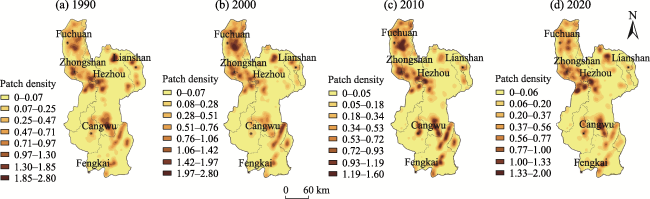
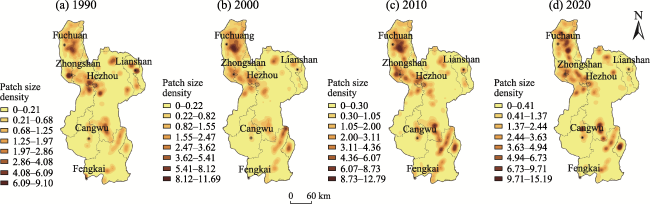
Analyzing the landscape pattern of rural settlements is an important way to reveal the relationships between landscape change and human activities. Based on Landsat TM/ETM/OLI satellite remote sensing images as data sources and Hejiang River Basin as the research area, this paper expounds the information on the spatial distribution of rural settlements at four time points in 1990, 2000, 2010 and 2020. Using the methods of landscape pattern analysis, GIS spatial analysis and spatial statistics, this paper analyzes the spatial characteristics of the rural settlements, such as scale, distribution and shape, and then discusses the influences of terrain, rivers, location and policy factors on the spatial characteristics of the rural settlements. The results show that with the advance of time, the number of rural settlement patches in Hejiang River Basin is decreasing, the patch area and average patch area are increasing, the patch density is decreasing, and the settlement pattern tends toward cluster development. In addition, the shapes of settlement patches tend to be complicated and irregular, so it is necessary to strengthen planning and guidance in order to promote the regular layout of the settlements. The overall distribution of settlements is dense in the Northwest and Southeast, but sparse in the Middle and West, with a high density in the plains and a low density in hills and mountains. This study found that the terrain, river and location factors have significant influences on the spatial pattern of settlements.
YANG Baoqi , SONG Shuqiao , QIN Jing . The Landscape Pattern Characteristics and Spatial Distribution of the Rural Settlements in the Hejiang River Basin[J]. Journal of Resources and Ecology, 2023 , 14(1) : 137 -146 . DOI: 10.5814/j.issn.1674-764x.2023.01.013
Fig. 1 Geographical location of Hejiang River Basin |
Fig. 2 Spatial distribution of rural settlements in Hejiang River Basin |
Table 1 Descriptions of the landscape pattern indexes |
| Type | Index name | Meaning | Unit |
|---|---|---|---|
| Size characteristics | NP, number of patches | Represents the total number of rural settlement patches | - |
| CA, total class area | Represents the total area of a patch of rural settlements | ha | |
| MPS, mean patch size | Represents the average size of a rural settlement patch | ha | |
| Distribution characteristics | PD, patch density | Represents the number of rural settlement patches per unit area | n km-2 |
| Shape features | LSI, landscape shape index | Reflects the degree of irregularity and fragmentation of rural settlement patches | - |
| PAFRAC, perimeter-area fractal dimension | Reflects the complexity of rural settlement patches | - |
Table 2 Landscape pattern index of rural settlements in Hejiang River Basin |
| Index | 1990 | 2000 | 2010 | 2020 |
|---|---|---|---|---|
| NP | 3066 | 3414 | 2778 | 2433 |
| CA (ha) | 6045.12 | 7354.80 | 9666.27 | 12021.21 |
| MPS (ha) | 1.97 | 2.15 | 3.48 | 4.94 |
| PD (n km-2) | 50.85 | 46.42 | 28.74 | 20.24 |
| LSI | 71.39 | 89.98 | 73.61 | 73.10 |
| PAFRAC | 1.36 | 1.55 | 1.40 | 1.43 |
Fig. 3 Patch density distribution of rural settlements in Hejiang River Basin |
Fig. 4 Patch size density distribution of rural settlements in Hejiang River Basin |
Table 3 Distribution characteristics of rural settlements at different elevations in Hejiang River Basin |
| Year | Elevation | |||||||||
|---|---|---|---|---|---|---|---|---|---|---|
| <100 m | 100-200 m | 200-300 m | 300-400 m | >400 m | ||||||
| CA (ha) | NP | CA (ha) | NP | CA (ha) | NP | CA (ha) | NP | CA (ha) | NP | |
| 1990 | 1324.80 | 829 | 2677.58 | 1248 | 1336.91 | 600 | 629.85 | 328 | 75.98 | 61 |
| 2000 | 1518.76 | 834 | 3644.14 | 1449 | 1471.87 | 702 | 649.20 | 370 | 71.03 | 59 |
| 2010 | 2578.64 | 826 | 4553.01 | 1053 | 1749.01 | 503 | 613.81 | 300 | 171.80 | 96 |
| 2020 | 3052.95 | 629 | 5564.34 | 1075 | 2287.59 | 430 | 865.14 | 234 | 251.19 | 65 |
Table 4 Distribution characteristics of rural settlements in different slope ranges in Hejiang River Basin |
| Year | Slope | |||||||||
|---|---|---|---|---|---|---|---|---|---|---|
| 0°-0.5° | 0.5°-2° | 2°-5° | 5°-15° | 15°-35° | ||||||
| CA (ha) | NP | CA (ha) | NP | CA (ha) | NP | CA (ha) | NP | CA (ha) | NP | |
| 1990 | 2699.51 | 1406 | 1128.83 | 485 | 1445.41 | 677 | 700.42 | 439 | 70.95 | 59 |
| 2000 | 3433.36 | 1531 | 1531.94 | 591 | 1353.37 | 736 | 936.94 | 484 | 99.19 | 72 |
| 2010 | 4434.67 | 1208 | 1844.31 | 413 | 2247.40 | 652 | 1027.21 | 420 | 112.68 | 85 |
| 2020 | 6001.43 | 1086 | 2572.48 | 432 | 2732.25 | 573 | 659.99 | 299 | 55.06 | 43 |
Table 5 Distribution characteristics of rural settlements in different areas of influence of the rivers |
| Year | Distance from main river | |||||||||
|---|---|---|---|---|---|---|---|---|---|---|
| <1 km | 1-2 km | 2-3 km | 3-4 km | >4 km | ||||||
| CA (ha) | NP | CA (ha) | NP | CA (ha) | NP | CA (ha) | NP | CA (ha) | NP | |
| 1990 | 2009.16 | 908 | 887.3 | 516 | 756.52 | 373 | 683.83 | 326 | 1708.31 | 943 |
| 2000 | 2360.74 | 963 | 1264.17 | 597 | 973.89 | 434 | 752.79 | 406 | 2003.21 | 1014 |
| 2010 | 3063.98 | 818 | 1859.39 | 539 | 1404.12 | 349 | 938.69 | 267 | 2400.09 | 805 |
| 2020 | 4245.76 | 845 | 2198.11 | 448 | 1442.41 | 302 | 1349.38 | 279 | 2785.55 | 559 |
Table 6 Distribution characteristics of rural settlements in the areas affected by different road buffers |
| Year | Distance from main road | |||||||||
|---|---|---|---|---|---|---|---|---|---|---|
| <1 km | 1-2 km | 2-3 km | 3-4 km | >4 km | ||||||
| CA (ha) | NP | CA (ha) | NP | CA (ha) | NP | CA (ha) | NP | CA (ha) | NP | |
| 1990 | 1114.26 | 599 | 693.41 | 361 | 492.13 | 260 | 354.51 | 175 | 3390.80 | 1671 |
| 2000 | 2067.39 | 869 | 1331.58 | 516 | 736.90 | 322 | 499.65 | 258 | 2719.28 | 1449 |
| 2010 | 3413.46 | 880 | 1656.89 | 486 | 800.66 | 263 | 699.45 | 262 | 3095.82 | 887 |
| 2020 | 5565.26 | 969 | 1934.25 | 428 | 796.75 | 118 | 592.38 | 121 | 3132.57 | 797 |
Table 7 Distribution characteristics of rural settlements in different areas of influence of urban centers |
| Year | Distance from urban center | |||||||||
|---|---|---|---|---|---|---|---|---|---|---|
| <2 km | 2-4 km | 4-6 km | 6-8 km | >8 km | ||||||
| CA (ha) | NP | CA (ha) | NP | CA (ha) | NP | CA (ha) | NP | CA (ha) | NP | |
| 1990 | 1737.16 | 724 | 2138.01 | 1136 | 1329.65 | 728 | 626.48 | 354 | 213.81 | 124 |
| 2000 | 1941.14 | 720 | 2785.86 | 1257 | 1672.77 | 837 | 672.82 | 405 | 282.21 | 195 |
| 2010 | 2510.88 | 670 | 3826.48 | 997 | 2161.37 | 632 | 792.41 | 276 | 375.13 | 203 |
| 2020 | 3250.35 | 505 | 4328.54 | 841 | 2870.42 | 614 | 1016.39 | 262 | 555.49 | 211 |
Table 8 Distribution characteristics of rural settlements in the different influence area buffers of industrial parks |
| Year | Distance from industrial park | |||||||||
|---|---|---|---|---|---|---|---|---|---|---|
| <1 km | 1-2 km | 2-3 km | 3-4 km | >4 km | ||||||
| CA (ha) | NP | CA (ha) | NP | CA (ha) | NP | CA (ha) | NP | CA (ha) | NP | |
| 2000 | 3.00 | 4 | 27.28 | 16 | 17.67 | 11 | 55.27 | 15 | 7251.58 | 3368 |
| 2010 | 80.60 | 19 | 238.35 | 45 | 307.42 | 65 | 723.76 | 100 | 8316.14 | 2549 |
| 2020 | 135.86 | 14 | 426.21 | 38 | 421.59 | 64 | 867.01 | 98 | 10170.54 | 2219 |
| [1] |
|
| [2] |
|
| [3] |
|
| [4] |
|
| [5] |
|
| [6] |
|
| [7] |
|
| [8] |
|
| [9] |
|
| [10] |
|
| [11] |
|
| [12] |
|
| [13] |
|
| [14] |
|
| [15] |
|
| [16] |
|
| [17] |
|
| [18] |
|
| [19] |
|
| [20] |
|
| [21] |
|
| [22] |
|
| [23] |
|
| [24] |
|
| [25] |
|
| [26] |
|
| [27] |
|
/
| 〈 |
|
〉 |