Agriculture and Landscape Ecology

The Dominant Livelihood Types of Farm Households and Their Determinants in Key Ecological Function Areas

  • WANG Xin ,
  • LIN Dayi ,
  • HAO Haiguang , *
Expand
  • Chinese Research Academy of Environmental Sciences, Beijing 100012, China
*HAO Haiguang, E-mail:

WANG Xin, E-mail:

Received date: 2021-11-11

  Accepted date: 2022-04-22

  Online published: 2023-01-31

Supported by

The National Natural Science Foundation of China(41871196)

Abstract

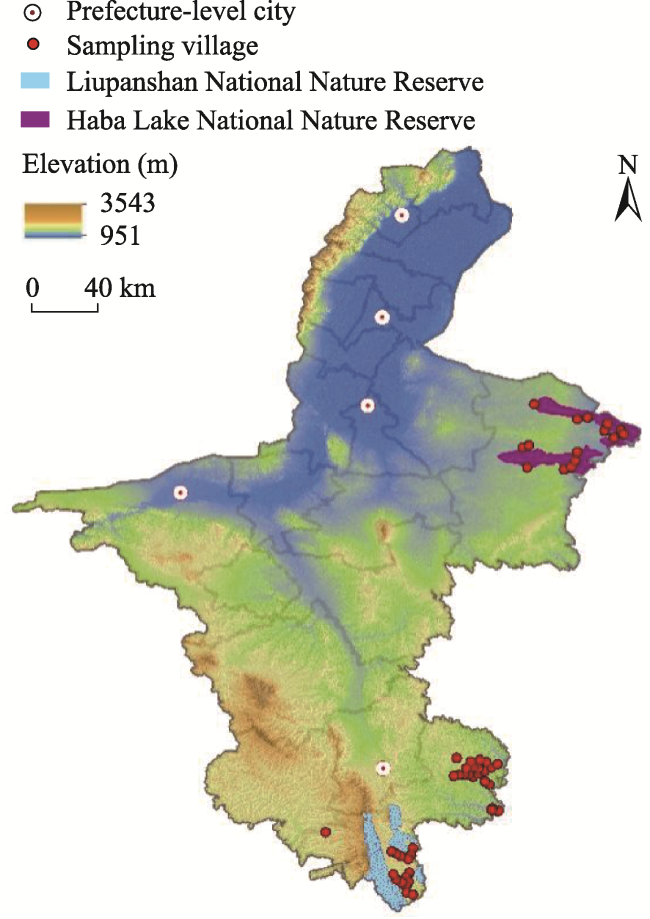
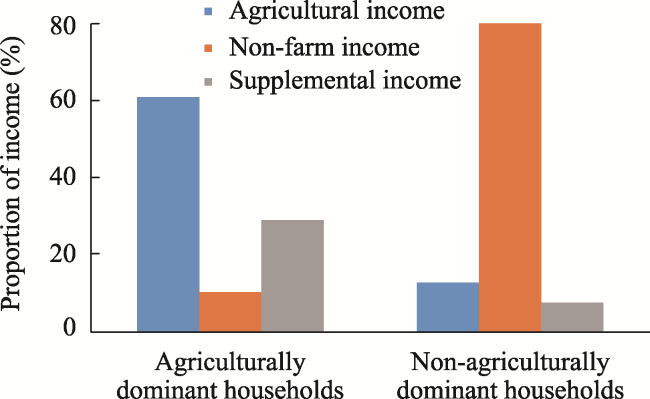
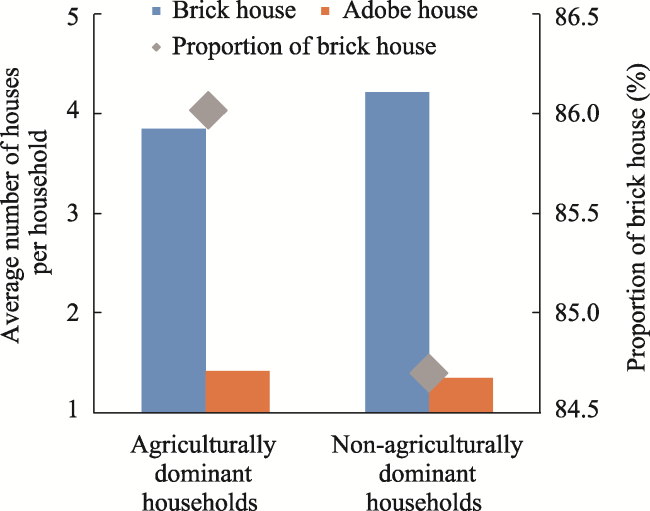
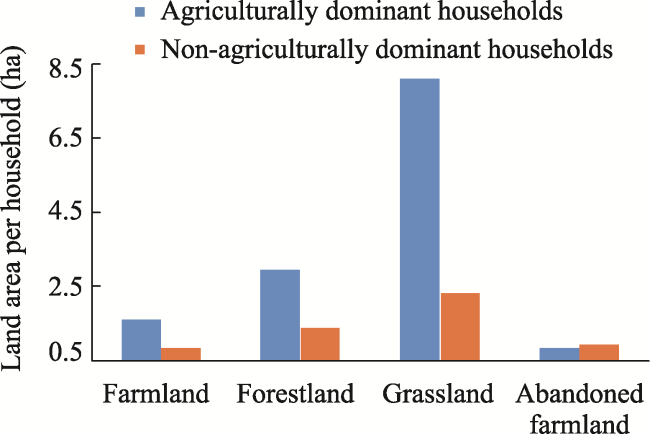
The dominant livelihood types of farm households have become increasingly differentiated in recent years, which has attracted the attention of researchers. Identifying the characteristics and driving factors of household livelihood differentiation is of great significance for revealing man-land relationship and policy making. Based on the interview data of farm households in typical villages in key ecological function areas of Ningxia Hui Autonomous Region in China, we analyzed the pattern of the dominant diversified livelihood types and the livelihood characteristics among different farm households. Then we assessed the driving forces of livelihood diversification by optimal scaling regression. The results indicated that: (1) In the study area, the dominant livelihood types show two trends of agriculturally dominant livelihood (accounting for 53.07%) and non-agriculturally dominant livelihood (accounting for 46.93%). Moreover, farm households in the agro-pastoral areas are mainly agriculturally dominated (accounting for 75.68%), while farm households in the mountainous areas are mainly non-agriculturally dominated (accounting for 66.93%). (2) The labor allocation and income source of different types of farm households are consistent with their dominant livelihood types. The farm households with agriculturally dominant livelihoods have more natural resources than those with non-agriculturally dominant livelihoods. In terms of housing conditions, farm households with agriculturally dominant livelihoods are inferior to those with non-agriculturally dominant livelihoods. (3) The farm labor, dependency ratio, agricultural income, supplemental income and locational conditions have negative impacts on the non-agricultural trend of farm household livelihood decisions, while off-farm labor, non-farm income, education level and the per capita amount of compensation have significant positive impacts on it.

Cite this article

WANG Xin , LIN Dayi , HAO Haiguang . The Dominant Livelihood Types of Farm Households and Their Determinants in Key Ecological Function Areas[J]. Journal of Resources and Ecology, 2023 , 14(1) : 114 -123 . DOI: 10.5814/j.issn.1674-764x.2023.01.011

1 Introduction

Farm households are the basic unit of natural resources utilization in rural areas, and their livelihood have a profound impact on the ecological environment (Hao et al., 2010; Zhang and Zhao, 2015). At the same time, the government has implemented a series of policies related to environmental protection or ecological compensation, which leads to the reallocation of rural resources, and ultimately affects the livelihood capital and livelihood strategy of farm households. However, the impact of those policies on farm household livelihood is uncertain. Some researchers have found that the project of returning cropland to forestland and returning husbandry to grassland did not significantly improve the incomes of farmers and herdsmen (Xu et al., 2004; Jiang et al., 2007). However, some studies found that it has improved the total welfare, subjective welfare and objective welfare of farmers, but the improvement of subjective welfare is far less than the objective welfare (Gao and Jin, 2021; Zhang and Gao, 2021). It was also found that the project of returning cropland to forestland adjusted the farm household income structure and increased farm income (Wang and Wang, 2009; Pan et al., 2020). Other studies found that the overall income of most farm households decreased after returning cropland to forestland or banning grazing (Hou et al., 2012; Fan et al., 2013). Some researchers have pointed out that the implementation of subsidy or compensation policies helps farm households diversify their livelihoods. Farmers tends to have a variety of employment options, that are not just limited to agriculture (Pagiola et al., 2005; Xu et al., 2007; Wang and Wang, 2009; Liu, 2012; Liu and Li, 2020), which further promotes the implementation of subsidy projects or ecological compensation projects (Xu et al., 2004), and eventually leads to a non-agricultural trend of farm household livelihoods as farmers gradually choose other ways of working in addition to agriculture (Liu and Zheng, 2020).
In addition, rural areas are in a stage of non-agricultural transformation of their farm livelihoods (Liu, 2007; Long et al., 2010). This transformation is also in the process of reducing the ecological pressure in vulnerable areas and promoting the development of new urbanization. During a sampling survey of key ecological functional areas, the research group found that the livelihood modes, livelihood decision-making and livelihood sources of some farm households mainly come from agricultural production and non-agricultural employment. The dominant livelihood decision-making of different farm households in rural areas has indeed shown a phenomenon of binary differentiation. At present, the research on farm livelihood mainly focuses on the impacts of compensation or subsidies on farm household livelihood (Zhao et al., 2013), livelihood capital (Zhang et al., 2012) and livelihood strategy (Li and Cai, 2014), as well as the responses of diversified livelihoods to compensation or subsidy (Xu et al., 2004; Li et al., 2012) and the ecological effects of livelihood transformation (Yan et al., 2010; Wang et al., 2012; Zhao, 2013).
The division of farm household livelihood types is a basic step in livelihood research, which divides farm livelihoods from the aspects of natural endowment (Wang et al., 2012), labor employment (Ouyang et al., 2004), labor input and the main source of income (Zhang et al., 2008). Different countries have different standards. Some countries classify farm household livelihoods according to the amount or proportion of non-farm income (such as Germany), while some countries classify it according to the time distribution of household labor (such as Japan). The quantitative division of farm household types developed by the Institute of Rural Development of the Chinese Academy of Social Sciences and the rural socio-economic survey team of the National Bureau of Statistics is an authoritative method of division for farm household types in China (2001), which adopts the income standard. In fact, a farm household’s choice of livelihood types is a comprehensive decision based on many factors, and so the research needs to be further deepened.
In this paper, we selected the key ecological function areas as study areas, which integrates multiple sensitive issues such as a fragile ecological environment, an underdeveloped economy, and prominent problems regarding agriculture, rural areas and peasantry. Starting from the differentiation of farm dominant livelihood types, this paper analyzes the current status and regional differences of farm dominant livelihood types in the sample areas. We then explore the driving factors and policy implications suggested for the differentiation of the dominant livelihood types. The results are expected to provide targeted decision-making support for guiding the non-agricultural transformation of farm livelihoods, alleviating regional ecological pressure, and targeted poverty reduction in the process of new urbanization.

2 Materials and methods

2.1 Study area

The sample areas are located in the east and southeast of Ningxia Hui Autonomous Region in China, and belong to the key ecological function areas in agro-pastoral areas and mountainous areas, namely Yanchi County (agro-pastoral area), Jingyuan County and Pengyang County (mountainous area). The sample sites are mainly distributed in the Haba Lake National Nature Reserve and Liupan Mountain National Nature Reserve and their surrounding areas (Fig. 1).
Fig. 1 Distribution of the sample villages in Ningxia Hui Autonomous Region
The terrain of Yanchi County is high in the south and low in the north, and bordered by the Mu Us Desert in the north and the Loess Plateau in the south. It is a typical agro-pastoral area, which belongs to the typical continental monsoon climate, with temperatures that are cold in winter and hot in summer with significant seasonal changes. It has a low annual average precipitation of about 300 mm with large inter-annual variability. In 2002, Yanchi County completely implemented the policy of closing the mountains for grazing prohibition and returning cropland to forestland, which has significantly improved the environment of Yanchi County. In Yanchi County, corn and rhizome crops are the main food crops, and the economic crops include oil crops, vegetables, and fruits. Livestock and poultry farming is dominated by sheep and pigs.
Jingyuan County is located at the foot of Liupan Mountain, at the source of Jing River. It belongs to the temperate semi-humid climate where the spring is cold without a summer, autumn is short and winter is long. The annual average temperature is 5.7 ℃ and the annual average precipitation is about 641.5 mm. The main ecological compensation projects implemented by the government of Jingyuan County are closing mountains for grazing prohibition and returning cropland to forestland. Pengyang County is located on the southern edge of Ningxia, at the eastern foot of Liupan Mountain, adjacent to Jingyuan County, with an altitude of 1248-2418 m. From north to south, it is divided into three types of natural areas: loess hills, residual river valley and mountainous earth-rock. The climate type is a typical temperate semi-arid continental monsoon climate, with an annual average temperature of 7.4-8.5 ℃, a frost-free period of 140-170 days, and an annual average precipitation of 350-550 mm. Pengyang County has implemented ecological compensation projects earlier and they have achieved fruitful results with many honorary titles such as advanced county for maintaining soil and water and advanced county for returning cropland to forestland.

2.2 Data

The data in this article were obtained from PRA (Participatory Rural Appraisal) interviews. The research team conducted field investigations in two groups in the surrounding counties of the Haba Lake National Nature Reserve and Liupanshan National Nature Reserve.
Regarding the basic characteristics of the survey sample, the questionnaire survey involved three counties and 15 townships. A total of 473 valid questionnaires were obtained by random sampling, of which 222 were in the agro-pastoral areas and 251 were in the mountainous areas. The questionnaire involved four parts: 1) Basic information of the farm households, including the age of the head of the household, education level, number of family members (population), number of labor force workers, number of migrant workers, family income and expenditure; 2) Farm household livelihood information, including the area of ​​land leased, the area of ​​returning cropland and forestland, the situation of livestock breeding, and the areas of ​​animal husbandry and planting; 3) The awareness of farm households regarding ecological compensation and ecosystem services, including the cognition of environmental protection in natural reserve, whether they have participated in ecological compensation projects, and the form of government subsidies; and 4) The actual situation and willingness of farm households to participate in ecological compensation projects, including the status of ecological compensation funds, willingness of farm households to be compensated, and satisfaction of farm households for ecological protection policies.
Additional data sources included China Statistical Yearbook (http://data.stats.gov.cn/index.htm), and regional administrative division data and digital elevation model (http://www.gscloud.cn/). The spatial data of the samples were collected by GPS during the survey.

2.3 Methods

2.3.1 Classification of farm household livelihood types

First, the labor force is an important human capital for farm household livelihood, and the income structure represents the current situation and main source of farm household income. Moreover, the supplemental income obtained by farm households has accounted for a high proportion in their income structure, and there are significant differences in the attitudes and responses of different farm households to the supplemental income. Based on the survey data, this paper took three types of indicators about farm households into consideration, namely labor allocation, income structure, and supplemental income. Using the hierarchical cluster analysis of SPSS, two types of farm dominant livelihood were analyzed by selecting indicators such as farm labor, migrant labor, agricultural income, non-farm income and supplemental income, namely agriculturally dominant livelihood and non-agriculturally dominant livelihood. Agriculturally dominant livelihood means that the labor force engaged in agricultural production accounts for a high proportion, the sources of income mainly come from agricultural production, and supplemental income is an important part of their income. Non-agriculturally dominant livelihood means that the labor allocation has obvious non-agricultural characteristics, the sources of income mainly come from non-agricultural production, and supplemental income has little impact on their total income.

2.3.2 Model of the impact factors

Based on the data obtained, we selected 11 indicators from five aspects: ecological compensation policy, labor force, income, household head characteristics, and location. Due to the implementation of ecological compensation, various resources will be redistributed. This will lead to changes in labor allocation, income structure and regional heterogeneity, which are important factors affecting farm household livelihood, and finally drive the differentiation of farm household dominant livelihoods in the implementation areas of ecological compensation. Indicators were selected to explore the main factors affecting the differentiation of farm dominant livelihoods in the sample area. The meaning of each indicator and its expected effect on driving the non-agricultural nature of farm household livelihoods are shown in Table 1. This article aims to explore the factors impacting the differentiation of farm dominant livelihood, so the dependent variables are the two types of farm dominant livelihood, namely agriculturally dominant livelihood and non-agriculturally dominant livelihood, which are categorical variables. The selected independent variables include both categorical variables and continuous variables. Therefore, it is appropriate to use the scale regression analysis, which can convert variables through multiple nonlinear iterations, standardize various variables, and solve the problem of quantifying categorical variables in the modeling process (Zhang, 2004). The formula is:
$Y=b1X1+b2X2+···+bnXn+L+ε$
Where Y is the dependent variable; Xn is the independent variable; bn is the parameters to be estimated; L is a constant; and ε is the residual.
Table 1 Factors impacting the variation of dominant livelihood types
Indicator Definition Off-farm driving expectations
for farm household livelihoods
Per capita amount of compensation Total compensation income per capita within farm households +
Number of subsidized projects Total number of farm households participating in subsidized projects +
Farm labor Ratio of agricultural labor force to total number of farm households -
Migrant labor Ratio of migrant labor force to the total number of farm households +
Dependency ratio Ratio of non-working age population to working age population -
Agricultural income Proportion of agricultural income in total household income -
Non-farm income Proportion of migrant income in total household income +
Supplemental income Proportion of total subsidy received by farm households in total household income +
Education level Education level of head of farmer household +
Age Age of head of farmer household -
Locational conditions Location of the sample (agro-pastoral ecotone or mountainous area) -

3 Results

3.1 Types of farm household dominant livelihood

The types of farm household dominant livelihood in the sample area show a trend of differentiation. According to the results, the households are divided into two types of dominant livelihood: agriculturally dominant livelihood and non-agriculturally dominant livelihood, as shown in Table 2. Among them, the number of farm households with agriculturally dominant livelihood is 251, accounting for 53.07% of the total sample, and the number of farm households with non-agriculturally dominant livelihood is 222, accounting for 46.93% of the total sample.
The regional differences in the types of dominant livelihood are very significant (Table 2). In agro-pastoral areas, farm livelihood is dominated by agriculture, and the number of farm households with agriculturally dominant livelihood is 168, accounting for 75.68% of the sample number in the agro-pastoral areas. In mountainous areas, farm household livelihood is dominated by non-agricultural characteristics, and there are 168 farm households with non-agriculturally dominant livelihood, accounting for 66.93% of the sample number in mountainous areas.
Table 2 The numbers and proportions of the dominant livelihood types in the study area
Dominant livelihood type Sample area Agro-pastoral area Mountainous area
Number Proportion (%) Number Proportion (%) Number Proportion (%)
Agriculturally dominant 251 53.07 168 75.68 83 33.07
Non-agriculturally dominant 222 46.93 54 24.32 168 66.93

3.2 Characteristics of farm households with different dominant livelihood types

The livelihood characteristics of different types of farm households in the sample area are significantly discriminative. We analyzed the livelihood characteristics of different types of farm households in terms of labor allocation, main sources of income, living conditions and natural resources.
(1) Main sources of income
In the sample area, the labor capital of farm households with non-agriculturally dominant livelihood is greater than those with agriculturally dominant livelihood, in which the average number of the labor force and total number of people for the non-agriculturally dominant livelihood are greater than those for the agriculturally dominant livelihood (Table 3). The allocation of the labor force in the sample area has significant directivity characteristics. The labor allocation of farm households with agriculturally dominant livelihood tends to be agricultural.
Table 3 Allocation of the labor force between different livelihood types
Dominant livelihood type Average size of labor force Average total number of people (person) Proportion of agricultural labor force (%) Proportion of migrant labor force (%)
Agriculturally dominant 2.04 4.15 37.63 13.90
Non-agriculturally dominant 2.22 5.10 17.23 28.51
An agriculturally dominant livelihood means that the labor force engaged in agricultural production accounts for a high proportion, the source of income mainly comes from agricultural production, and supplemental income is an important part of the income (Fig. 2). The average agricultural labor force of farm households with agriculturally dominant livelihood accounts for 37.63%, while the average migrant labor force of farm households with agriculturally dominant livelihood accounts for only 13.90%. The main income of farm households with agriculturally dominant livelihood comes from agriculture, which accounts for 60.81% of their income, with non-farm income accounting for 10.25% of their income. On the contrary, the labor allocation of farm households with non-agriculturally dominant livelihood tends to be non-agricultural, and the proportion of the migrant labor force (28.51%) is greater than the proportion of the agricultural labor force (17.23%).
Fig. 2 Income structures of the two different livelihood types
(2) Differences among farmers with different livelihood types
Non-agricultural households have better human resource endowments, more per capita labor force resources, and better living conditions. However, agricultural households have better natural resources.
The living conditions of farm households with non-agriculturally dominant livelihood in the sample area are better than those with agriculturally dominant livelihood (Fig. 3). The average number of brick houses owned by farm households with non-agriculturally dominant is about 0.6 more than those with agriculturally dominant livelihood, and the average number of adobe houses is about the same. However, the proportion of farm households with agriculturally dominant livelihood which have brick houses is higher than those with non-agriculturally dominant livelihood.
Fig. 3 Housing conditions of the two different livelihood types
The natural resources of the sample area have an obvious tendency among the different types of farm households (Fig. 4). The average area of contracted forest is 2.98 ha among farm households with agriculturally dominant livelihood, while it is 1.40 ha among farm households with non-agriculturally dominant livelihood. The average contracted grassland area of the agriculturally dominant (8.11 ha) is larger than that of the non-agriculturally dominant (2.36 ha). In addition, the average farmland of the agriculturally dominant (1.62 ha) is greater than that of the non-agriculturally dominant (0.88 ha). However, the average area of abandoned farmland shows the opposite pattern. The abandoned farmland of the non-agriculturally dominant (0.95 ha) is greater than that of the agriculturally dominant (0.87 ha), although the difference between the two types is only 0.08 ha.
Fig. 4 Land resources of the two different livelihood types

3.3 Analysis of factors impacting the decision-making of farm household livelihood

Table 4 shows that migrant labor, non-farm income, education level and per capita amount of compensation have positive effects on the non-agricultural decision-making of farm household livelihood. Farm labor, dependency ratio, agricultural income, supplemental income, and locational conditions have negative effects on the non-agricultural decision-making of farm household livelihood. Among them, only education level, per capita amount of compensation and locational conditions pass the 10% significance test. The number of subsidized projects and age failed the significance test.
Table 4 Regression analysis results of influencing factors of farmers' livelihood decision-making
Impact factor Standardized coefficients df F Sig.
Beta Std. Error
Farm labor -0.123 0.042 2 8.443 0.000
Migrant labor 0.068 0.039 2 3.131 0.045
Dependency ratio -0.037 0.018 2 4.130 0.017
Agricultural income -0.373 0.174 2 4.584 0.011
Non-farm income 0.544 0.176 2 9.549 0.000
Supplemental income -0.237 0.140 3 2.870 0.036
Education level 0.151 0.104 4 2.110 0.079
Number of subsidized projects 0.056 0.051 3 1.176 0.319
Per capita amount of compensation 0.069 0.041 1 2.834 0.093
Age -0.133 0.109 2 1.489 0.227
Locational conditions -0.103 0.060 1 2.970 0.086
We also analyzed the influencing factors from five aspects: ecological compensation policy, labor force, income, household head characteristics and location.
The ecological policy compensation includes the number of subsidized projects and the amount of compensation per capita. The impact of the number of subsidized projects is not significant, while the per capita compensation amount is positively driving farm livelihood non-agricultural decision-making. The labor force includes the proportion of agricultural labor force and the proportion of industrial labor force. The effect of the proportion of agricultural labor on farm livelihood and non-agricultural decision-making is negative, while the impact of the proportion of working labor on farm livelihood and non-agricultural decision-making is positive. Income includes the proportion of agricultural income, the proportion of non-agricultural income and the proportion of subsidized income. The proportion of agricultural income drives farm livelihood decisions toward an agricultural trend, while the proportion of non-agricultural income drives farm livelihood decisions to be non-agricultural. The effect of subsidized income ratio on farm livelihood decision-making is negative. The characteristics of the head of household include the education level of the head of the household, the dependency coefficient and the age of the head of the household. The dependency coefficient has a significant negative effect on farm livelihood decision-making. The age of the head of household has no significant effect. Location includes various location conditions, which adversely affect the farmers’ choices of non-agricultural livelihoods.

4 Discussion

4.1 Farmers with different livelihoods

Under the influence of regional heterogeneity, farm livelihood differentiation shows the choices of livelihood decisions made by farmers on the premise of measuring the difference between agricultural and non-agricultural incomes. There is little regional difference in non-agricultural income, with per capita annual income around 12000 yuan, while regional differences in agricultural income are large. Due to poor land conditions in the mountainous areas, non-agricultural income is greater than agricultural income, so the proportion of farm non-agricultural livelihoods is high. In agricultural and pastoral areas, land resources are better, agricultural income is greater than industrial income, so the proportion of agricultural livelihood is relatively high.
There are obvious differences in labor allocation between farm households with different types of livelihoods. Non-agriculturally dominant livelihood means that the labor allocation has obvious non-agricultural characteristics, the source of income mainly comes from non-agricultural production, and supplemental income has little impact on the total income. The main income of farm households with non-agriculturally dominant livelihood is biased towards non-agricultural income, accounting for nearly 80%, and agricultural income accounting for 12.79% of their income, with supplemental income accounting for 7.59% of their income.
The living conditions of farm households with non-agriculturally dominant livelihood in the sample area are better than those with an agriculture-dominated livelihood. This shows that the living conditions of farm households with non-agriculturally dominant livelihood are better and they have the ability to create a better living condition.
The natural resources of the sample area have an obvious tendency among the different types of farm households. Non-agricultural households have better human resource endowments, more per capita labor force resources, and better living conditions. Agricultural households have better natural resources.

4.2 Different factors impacting the decision-making of farm livelihood

The ecological policy compensation includes the number of subsidized projects and the amount of compensation per capita. The per capita amount of compensation is a positive driver for the decision-making of non-agriculturalization of the farm household livelihood. The average amount of cultivated land owned by a single household or individual is limited. Under the premise of the same regional compensation standard, the larger the amount of ecological compensation, the larger the area of cultivated land returned to forest (grass), and the higher the proportion of returned cultivated land. As a result, the area and proportion of cultivated land that farmers depend on for their survival are reduced, thus positively promoting farmers’ non-agricultural decision-making. At the same time, the amount of land ecological compensation exceeds the agricultural income on this land, which will also positively drive non-agricultural employment. However, in the process of implementing policies such as ecological compensation, farmer households should be prevented from weakening their natural capital due to their low livelihood capital and the impact of returning farmland, otherwise they may fall into “subsidized poverty”. On the premise of considering spatial heterogeneity, the government should change the existing compensation methods and implement targeted policies to motivate farmer households to change their dominant livelihood to non-agricultural options.
The labor force includes the proportion of agricultural labor force and the proportion of industrial labor force. The agricultural labor force has a negative effect on the non-agricultural decision-making of farm household livelihood, and the industrial labor force has a positive effect on the non-agricultural decision-making of farm household livelihood. This indicates that the allocation of labor will affect the employment choices of farm households. Therefore, in the process of new urbanization, the agricultural labor force needs to be guided to transfer it into non-agricultural fields, especially the labor force in ecologically vulnerable areas. So as to help the farm households make livelihood choices and eliminate their dependence on natural resources, which will alleviate the ecological pressure in vulnerable areas.
Income includes the proportion of agricultural income, the proportion of non-agricultural income and the proportion of subsidized income. The proportion of agricultural income and the proportion of non-agricultural income have opposing effects on the decision-making of farm household livelihood, which is as expected. The proportion of supplemental income has a negative effect on decision-making of farm household livelihood, which deviates from the expected direction of the effect. Although the two dominant livelihood types of farmer households have a high level of satisfaction with supplemental income (satisfaction is about 60%), it has failed to achieve the goal of promoting non-agriculturalization of farm household dominant livelihoods. This shows that direct compensation (cash or material) cannot change the agriculturally dominant livelihood strategy of farmer households. However, the choice of the compensation method for ecological compensation by farmer households in the sample area is mainly cash, accounting for 91.98%. In addition, 33.06%, 24.12% and 14.55% of the farmers tend to receive material compensation, employment compensation and technical training, respectively. Therefore, if the project is further promoted, the existing ecological compensation mode should be changed to guide the non-agricultural transformation of farm household livelihoods, which will reduce the intensity of human disturbance in vulnerable areas, and achieve a win-win situation of improving the regional environment while also improving the well-being of farmers.
The characteristics of the head of household include the education level of the head of the household, the dependency coefficient and the age of the head of the household. The age of the head of household has no significant effect, while the educational level has a positive effect on the livelihood decision-making of farmer households. The higher the educational level, the more farmer households will develop their livelihoods towards non-agriculturalization, which indicates the importance of the education level of farmers for the transformation of farm household livelihoods. The higher the education level of farmers, the deeper their understanding of farm household livelihood diversification. The dependency ratio has a significant negative effect on the non-agricultural decision-making of farm household livelihoods, indicating that a heavier burden of the labor force will restrict non-agricultural decision-making in their livelihoods. One of the reasons for the excessive dependency ratio is the insufficient construction of public service facilities, and the other main reason is that the income of rural residents is not sufficient to support the consumption of such public services. The income of urban residents is higher than that of rural residents, the concept of fertility is advanced, the educational resources, medical facilities and pension facilities are relatively complete, and the supporting facilities are sufficient, which makes the dependency coefficient of urban residents lower. In rural areas, due to the remote location, inconvenient transportation, relatively low income, and insufficient educational resources, pension facilities and insufficient income to support the use of such services, the dependency coefficient is relatively high. By improving basic public services, raising the level of basic security for farmer households and reducing the burden of farmer households, these measures will promote the non-agricultural preference of farm household livelihoods in the process of new urbanization, and ultimately promote the further restoration of the ecological environment in mountainous areas.
Location conditions have a negative effect on non-agricultural decisions of farm household livelihood, which is driven by the opportunity cost of livelihood decision-making under different location conditions. The location conditions that affect this place include natural location and social location. Among natural location conditions, water sources and soil conditions have a negative impact on non-agricultural choices. Areas with sufficient water sources and fertile soil have superior planting conditions and are suitable for farming, which will attract more laborers to work in agriculture. Regarding social location, transportation and market have a negative impact on non-agricultural choices. Convenient transportation and a broad market are conducive to the export and sales of agricultural products, which will attract more laborers to work in agriculture. The regions receiving ecological compensation have a close relationship with economically underdeveloped regions, so it is necessary to consider regional differences when further promoting ecological compensation policies. Such considerations can change the current situation of poverty in areas receiving ecological compensation, in order to achieve targeted poverty reduction.
The regression fitting results for the number of subsidized projects and the age of the head of farm household show that they do not have a significant impact on the livelihood decision-making of farm households. In addition, farm households pay more attention to the compensation strengths of various subsidy policies, rather than the number of participating subsidized projects. Therefore, the number of subsidized projects will not have a significant impact on livelihood decision-making.
For different farmers, the factors affecting their livelihood decisions are heterogeneous. Basupi et al. (2019) found that farmers living in areas with a high income and well-established infrastructure are more adaptable than those living in areas with a lower income, inconvenient transportation and singular access to information (Basupi et al., 2019). We found that the dependency coefficient had a negative impact on farmers’ off-farm livelihood decisions. The underdeveloped areas have imperfect infrastructure, low income, a high dependency coefficient, and a high cost to support farmers’ non-agricultural livelihoods, which are not conducive to farmers’ non-agricultural livelihood decision-making. At the same time, these factors also led to differences in the proportion of farmers' non-agricultural livelihood choices in the mountainous area and the agro-pastoral area.
Antwi-Agyei et al. (2018) found that inappropriate livelihood decisions often have undesired consequences, thereby increasing the livelihood vulnerability of farmers. Zhao et al. (2020) confirmed that the increases of natural capital, physical capital, human capital and social capital have significant impacts on farmers’ livelihood decision-making, and the area and quality of arable land (grassland) determine the family income level of farmers to a certain extent. We found that the per capita compensation amount will positively drive the non-agricultural livelihood decision-making of farmers. The per capita compensation amount affects farmers’ non-agricultural livelihood decisions to a certain extent. The better the land quality and larger the area, the higher the per capita compensation amount. However, farmers may increase their reliance on subsidies which could reduce their motivation for work, resulting in “subsidized poverty” and further increasing the vulnerability of farmers’ livelihood income. Therefore, it is necessary to formulate targeted compensation policies to guide farmers to make the correct livelihood decisions.

5 Conclusions

(1) The labor force allocation and income sources of non-agriculturally dominant farm households are mainly non-agricultural. The migrant labor force of non-agriculturally dominant farm households is 64.47% greater than that of agricultural labor, and about 80% of family income comes from non-agricultural labor. At the same time, the supplemental income has little impact on non-agriculturally dominant farm households. The agricultural labor force of agriculturally dominant farm households is nearly three times that of the migrant labor force. More than 60% of the income of agriculturally dominant farm households mainly comes from agricultural production, and the proportion of supplemental income is high. Agriculture-dominated households have better natural resource endowments, while non-agriculture-dominated households have better overall living conditions.
(2) In the study area, the dominant livelihood types have two opposite trends, which were agriculturally dominant livelihood (53.07%) and non-agriculturally dominant livelihood (46.93%). Moreover, the diverse characteristics of the dominant livelihood types have significant spatial heterogeneity. Livelihood decision-making of farm households in the agro-pastoral areas is dominated by agriculture, accounting for 75.68% of the number of sampled households in the agro-pastoral areas. Meanwhile, livelihood decision-making of farm households in the mountainous area is dominated by non-agriculture, which accounts for 66.93% of the number of sampled households in the mountainous areas.
(3) The farm labor, dependency ratio, agricultural income, supplemental income and geographic conditions have negative impacts on the non-agricultural trend of the farm household livelihood decisions, but non-agricultural labor, non-farm income, education level and the per capital amount of compensation have significant positive impacts on it.
Based on the above conclusions, the following policy recommendations are put forward for the Ningxia sample area. In the process of formulating and implementing ecological compensation policies, spatial heterogeneity and farm household labor allocation should be considered. By strengthening the ecological compensation in important regions, farm households can eliminate their dependence on natural resources and guide farm household livelihood transfer to non-agricultural livelihood. This would achieve a win-win situation of protecting the environment while improving the well-being of farm households.
[1]
Antwi-Agyei P, Dougill A J, Stringer L C, et al. 2018. Adaptation opportunities and maladaptive outcomes in climate vulnerability hotspots of northern Ghana. Climate Risk Management, 19: 83-93.

DOI

[2]
Basupi L V, Quinn C, Quinn C H, et al. 2019. Adaptation strategies to environmental and policy change in semi-arid pastoral landscapes: Evidence from Ngamiland, Botswana. Journal of Arid Environments, 166(7): 17-27.

DOI

[3]
Fan S Y, Lan J, Xu J, et al. 2013. A comparison between transaction cost and structure of ecological construction policies. Journal of Glaciology and Geocryology, 35(5): 1283-1291. (in Chinese)

[4]
Gao Q, Jin L S. 2021. Research on the impact mechanism of the new round of sloping land conversion program on rural household income: Based on rural household surveys in south Jiangxi and north Hubei Province. China Land Science, 35(5): 57-66. (in Chinese)

[5]
Hao H G, Li X B, Xin L J. 2010. Analysis on farm households’ part-time behavior and its causes. Journal of Agrotechnical Economics, (3): 14-21. (in Chinese)

[6]
Hou C C, Zhao X Y, Zhang L, et al. 2012. The impacts of ecological compensation on regional development: A case of the Yellow River water supply areas of Gannan. Journal of Natural Resources, 27(1): 50-61. (in Chinese)

[7]
Jiang D M, Zhang W, Wang Y M. 2007. The response about implementing of “returning grazing-growing” project in herdsman. Forestry Economics, (4): 67-70. (in Chinese)

[8]
Li G D, Qiu D C, Wang L P, et al. 2012. Impacts of difference among livelihood assets on the choice of economic compensation pattern for farm households farmland protection in Chongqing City. Acta Geographica Sinica, 67(4): 504-515. (in Chinese)

[9]
Li H Y, Cai Y Y. 2014. Livelihood diversity and farmer participate in farmland ecological compensation policy response: The case study of Minhang District, Shanghai and Zhangjiagang District, Suzhou. Journal of Natural Resources, 29(10): 1696-1708. (in Chinese)

[10]
Liu G. 2012. The program “paddy fields convert to dry farm” on the influence of the peasant household’s livelihood—An empirical exploration based on the analytical framework of sustainable livelihoods. Diss., Beijing, China: China University of Geosciences. (in Chinese)

[11]
Liu L L, Li F R. 2020. Impact of rural households’ livelihood capital on livelihood strategy in the Loess Plateau: A case study of Huining County, Gansu Province, China. Journal of Dessert Research, 40(1): 233-244. (in Chinese)

[12]
Liu T, Zheng Y M. 2020. Analysis of ecological compensation for returning farmland to forests in China. Issues of Forestry Economics, 40(1): 21-28. (in Chinese)

[13]
Liu Y S. 2007. Rural transformation and development and new rural construction in eastern coastal area of China. Acta Geographica Sinica, 62(6): 563-570.. (in Chinese)

[14]
Long D P, Li T S, Miao Y Y, et al. 2014. Spatio-temporal characteristics and impacting factors of non-agriculturalization of China’s rural population. Progress in Geography, 33(4): 517-530. (in Chinese)

DOI

[15]
Long H L, Liu Y S, Li X B. 2010. Building new countryside in China: A geographical perspective. Land Use Policy, 27: 457-470.

DOI

[16]
Ouyang J L, Song C M, Yu Z R, et al. 2004. The farm household’s choice of land use type and its effectiveness on land quality and environment in Huang-Huai-Hai Plain. Journal of Natural Resources, 19(1): 1-11. (in Chinese)

[17]
Pagiola S, Arcenas A, Platais G. 2005. Can payments for environmental services help reduce poverty? An exploration of the issues and the evidence to date from Latin America. World Development, 33(2): 237-253.

DOI

[18]
Pan D, Lu Y, Kong F B. 2020. Effects of Grain for Green Project on the income of households at different poverty levels. Scientia Silvae Sinicae, 56(8): 148-161. (in Chinese)

[19]
Rural Development Research Institute, Chinese Academy of Social Sciences, Rural Social and Economic Survey Team of the National Bureau of Statistics. 2001. Analysis and forecast of China’s rural economic situation. Beijing, China: Social Science Literature Press. (in Chinese)

[20]
Wang C S, Zhu S S, Sun G Y, et al. 2012. The spatial evolution of slope villages and their peasant household livelihood change in the mountainous area of western China. Journal of Natural Resources, 27(7): 1089-1100.. (in Chinese)

[21]
Wang L P, Wang C, Li X Q. 2012. Research on rural household differentiation based on the quanlification of livelihood assets: Evidence from 471 rural households in Bailin Village, Shapingba, Chongqing City. Geographical Research, 31(5): 945-954. (in Chinese)

[22]
Wang Q J, Wang L Q. 2009. Economical impact of Grain for Green Project on farmers: A case study in Pingquan County of Hebei Province. Journal of Beijing Forestry University (Social Science), 8(1): 88-92.. (in Chinese)

[23]
Xu J T, Tao R, Xu Z G. 2004. Sloping land conversion program: Cost-effectiveness, structural effect and economic sustainability. China Economic Quarterly, (4): 139-162. (in Chinese)

[24]
Xu J Y, Chen L D, Lu Y H, et al. 2007. Sustainability evaluation of the Grain for Green Project: From local people’s responses to ecological effectiveness in Wolong Nature Reserve. Environmental Management, 40(1): 113-122.

DOI

[25]
Yan J Z, Zhuo R G, Xie D T, et al. 2010. Land use characters of farmers of different livelihood strategies: Cases in Three Gorges Reservoir Area. Acta Geographica Sinica, 65(11): 1401-1410.. (in Chinese)

DOI

[26]
Zhang F F, Zhao X Y. 2015. A review of ecological effect of peasant’s livelihood transformation in China. Acta Ecologica Sinica, 35(10): 3157-3164.. (in Chinese)

[27]
Zhang L, Zhao X Y, Hou C C, et al. 2012. Effect of ecological compensation on farmer household livelihood capital—A case study in the Yellow River water supply area in Gannan. Journal of Glaciology and Geocryology, 34(1): 186-195. (in Chinese)

[28]
Zhang L P, Zhang Y L, Yan J Z, et al. 2008. Livelihood diversification and cropland use pattern in agro-pastoral mountainous region of the eastern Tibetan Plateau. Acta Geographica Sinica, 63(4): 377-385.. (in Chinese)

[29]
Zhang W T. 2004. SPSS statistical analysis advanced course. Beijing, China: Higher Education Press. (in Chinese)

[30]
Zhang X R, Gao J Z. 2021. A study on the welfare effect of new round of returning farmland to forest in southern Shaanxi. Journal of Arid Land Resources and Environment, 35(2): 14-20.

[31]
Zhao X Y. 2013. Environmental impact of different livelihood strategies of farmers: A case of the Gannan Plateau. Scientia Geographica Sinica, 33(5): 545-552.. (in Chinese)

[32]
Zhao X Y, Jie Y Q, He X F, et al. 2020. Livelihood adaptability of farmers in key ecological functional areas under multiple pressures: A case study of Yellow River water source areas of Gannan. China Population, Resources and Environment, 30(1): 140-149. (in Chinese)

[33]
Zhao X Y, Zhang L, Jiang J D, et al. 2013. The impact of ecological compensation on the farmers’ livelihood: A case study of Huanghe Rver water supply areas of Gannan. Geographical Research, 32(3): 531-542.. (in Chinese)

Outlines

/