Agriculture and Landscape Ecology

Spatial Differentiation Patterns of Agricultural Industry Demonstration Towns in China

  • JIANG Difei , 1 ,
  • ZHENG Guanghui , 1, * ,
  • LUAN Yongfei 2
Expand
  • 1. Architecture and Art School, Central South University, Changsha 410083, China
  • 2. Ministry of Education of China Key Laboratory of Regional Energy and Environmental Systems Optimization, Environmental Research Academy, North China Electric Power University, Beijing 102206, China
*ZHENG Guanghui, E-mail:

JIANG Difei, E-mail:

Received date: 2021-08-17

  Accepted date: 2022-03-16

  Online published: 2023-01-31

Supported by

The Guizhou Province 2019 Philosophy and Social Science Planning Project(19GZQN11)

Abstract

Industrial prosperity is the foundation of rural revitalization. Taking the 552 agricultural industry demonstration towns (AIDTs) as the research object, this paper explores the spatial layout and influence mechanism of AIDTs in China. The research is of great significance to the layout of China’s agricultural industry and the revitalization of the rural agricultural industry. This paper adopts the ArcGIS 10.3 spatial analysis method to reveal the spatial distribution characteristics, density characteristics, spatial complexity, and spatial correlation of AIDTs in China. (1) The spatial distribution of AIDTs tends to be condensed distribution with remarkable spatial differentiation. (2) The kernel density of China’s AIDTs is characterized by multiple independent mononuclear centers, secondary centered bands, and sporadic distribution. (3) The AIDTs system is characterized by scaleless areas, significant fractal features, and complexity of spatial structure. (4) The AIDTs belong to positive spatial correlation present different patterns of cold and hot spots with the more concentrated spatial distribution. The research indicates that the spatial distribution pattern of China’s AIDTs is highly consistent with the distribution of major grain-producing areas. It is mainly determined by factors such as good natural conditions, convenient water resources, and good regional advantages and continuously implemented agricultural industry reform. With the “three changes” reform (i.e. change resources into assets, funds into shares, and farmers into shareholders) proposed by Liupanshui City in Guizhou Province in March 2015 as a strategy, take the agricultural industry scale development model and adheres to the guidance of the agricultural industry to contribute to rural revitalization. The research results are of essential guiding significance for China’s agricultural industry reform, agricultural economic development, rural revitalization, and the characteristics of agricultural industry layout.

Cite this article

JIANG Difei , ZHENG Guanghui , LUAN Yongfei . Spatial Differentiation Patterns of Agricultural Industry Demonstration Towns in China[J]. Journal of Resources and Ecology, 2023 , 14(1) : 92 -101 . DOI: 10.5814/j.issn.1674-764x.2023.01.009

1 Introduction

The construction of agricultural industry demonstration towns (AIDTs) aims to develop and strengthen the rural industry and tackle the “Three Rural Issues—Agriculture, Farmers, and Rural Areas”. Industrial prosperity is the core task of “increasing income and promoting safe housing” to realize the sustainable development of the agricultural industry. Therefore, an integrated development approach of “village industry environment economy” should be built to activate rural production vitality, carry out a rural industrial revolution, and revitalize the agricultural industry. The core purpose of the construction of AIDTs in China is to accelerate the implementation of the Rural Revitalization Strategy and develop the rural industry. The “urban-rural dual structure” mode should be changed into the “urban-rural integration” mode. It is an essential strategic measure to carry out the demonstration construction of industrial towns and promote the integration of rural industries (Liu et al., 2018). The relative policies should be fully comprehended and grasped to well implement the Rural Revitalization Strategy, thereby accelerating the pace of agricultural and rural modernization and building a modern agricultural industrial system and production and management system (Brown et al., 2021), With the demonstration construction of industrial towns as the core of the Rural Revitalization Strategy, agricultural industry planning should be well formulated to promote the synchronous development of agricultural industry scale, efficiency, and modernization. We should expand and strengthen the collective industry, promote the transformation of agricultural industry (Natsuda et al., 2012), integrate urban and rural economic development with the “three changes” reform mode, and cultivate several models for rural revitalization to create unique local industry and local economy and stimulate rural vitality (Zheng et al., 2020). Urban and rural areas are an organism, and the two support each other to promote the integrated development of urban and rural areas. The prosperity of the agricultural industry strongly supports rural revitalization, and villages and towns are essential carriers for implementing the Rural Revitalization Strategy, cultivating leading agricultural industries, and creating high-quality agriculture (Lin et al., 2021). The Ministry of Agriculture and Rural Affairs of the People’s Republic of China has launched the declaration and appraisal of industrial towns to promote rural revitalization and ensure the prosperity of the agricultural industry (Porter, 1990). Therefore, it is of great practical significance to study the construction of AIDTs in China.
Rural revitalization, agricultural industrial structure adjustment, and the “three changes” policy research have raised continuous attention from academia, and the research results are becoming increasingly mature. In recent years, researchers have focused on the reconstruction of rural regional space (Long et al., 2016; Xie et al., 2017; Long and Tu, 2018), rural sustainable development and transformation (Long et al., 2010; Long, 2012; Liu et al., 2016; Li et al., 2018), rural spatial agglomeration (Liu et al., 2014; Lu, 2021), rural tourism (Zhang et al., 2012; Hu and Bao, 2016), and other fields. The research results focus on rural development, rural environment improvement, hollow village improvement, and rural revitalization, promoting the harmonious life of farmers, and optimizing the rural development model. After the development of urbanization to a certain stage, some countries begin to adopt corresponding measures to promote rural revitalization and urban-rural integration development. For example, “Rural Revitalization Plan” in France, rural central village construction in Britain, rural revitalization through the formulation of agricultural subsidies, rural modernization and other measures in France, and corresponding policies and regulations using market means to promote rural economic development in Britain (Long et al., 2010; Tang, 2012). In France, Britain, and other countries, great importance is attached to the basic status of agriculture, emphasizing agricultural industry planning and ecological environment protection and supporting the construction of agricultural modernization infrastructure. In Japan and South Korea, emphasis has been placed on the extension of the agricultural industry chain, integration of industry and research, and the utilization of financial policies and industrial subsidies to promote the return of added value generated by agriculture to rural areas (Li et al., 2016). In the 1970s, the “demonstration project of comprehensive construction of villages and towns” in Japan and the “New Rural Movement” in South Korea (Thompson, 2004) could also serve as a reference, thus resulting in the Chinese version of “new rural construction”. Given the objective facts of a large population in China, for example, poor rural foundation, weak foundation, and the large gap between cities, the report of the 19th National Congress of the Communist Party of China proposed to implement the Rural Revitalization Strategy to tackle the main contradictions facing China. The core of the contradiction between people’s growing needs for a better-off life and the unbalanced and inadequate development is to address the problem of unbalanced and inadequate urban and rural development, make up for the setbacks of rural development, and narrow the gap between urban and rural areas. With the serious tendency of urbanization and the substantial economic decline of rural areas, the implementation of the Rural Revitalization Strategy is an inevitable requirement for the development of socialism with Chinese characteristics. Therefore, China’s rural revitalization must be based on the national conditions to grasp the main problems, objectively analyze the rural practical problems, and tackle the contradiction between people and the land. From the perspective of rural revitalization and the research results of the main functional areas of China’s agricultural industry, this paper studies China's rural transformation and rural settlement spatial reconstruction (Li et al., 2015; Zhang and Cao, 2015; He et al., 
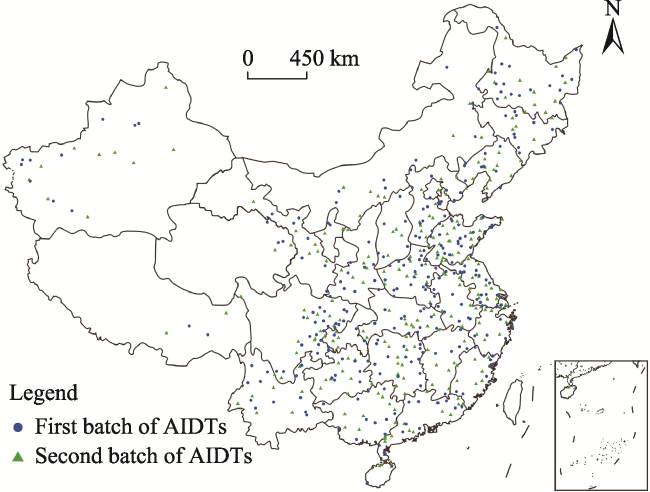
2018). By analyzing the spatial distribution and influencing factors of 254 AIDTs in 2018 and 298 AIDTs in 2019, this paper identifies the spatial influencing factors and spatial change trend of AIDTs in China. The characteristics of the geographical spatial distribution pattern of AIDTs in China are discussed, specific measures are proposed to tackle the problems that affect industrial development, and the problems of spatial influence and geographical factors are analyzed to provide theoretical support for future research on China’s agricultural industry development and a reference for realizing the goal of rural revitalization and urban-rural integration development.

2 Materials and methods

2.1 Data sources

This study dataset was obtained from the website of the Ministry of Agriculture and Rural Affairs of the People’s Republic of China (http://www.moa.gov.cn). The AIDTs announced in the notice on the construction of strong agricultural industrial towns approved by the General Office of the Ministry of Agriculture and Rural Affairs and the General Office of the Ministry of Finance (552 in total in two batches), there were 254 industrial towns in the first batch of 2018 and 298 in the second batch of 2019 (excluding Hong Kong, Macao and Taiwan). The basic base map comes from the standard base map service website of the National Administration of Surveying, Mapping and Geographic Information (http://bzdt.ch.mnr.gov.cn/). According to the location information of the “list of strong agricultural towns in China”, the geographic coordinates of 552 AIDTs in China were obtained by using Baidu coordinate picker. The coordinate data were imported into ArcGIS 10.3 software for coordinate projection transformation and the establishment of a spatial attribute database. The spatial distribution pattern of AIDTs in China was obtained (Fig. 1).
Fig. 1 Spatial distribution of AIDTs in China

2.2 Methods

In the present study, a series of spatial statistics and analysis techniques were applied to conduct quantitative analyses on AIDTs in China. According to the regional theory of the man-land relationship, this paper investigates the spatial distribution pattern of AIDTs in China via ArcGIS 10.3 software and related technical methods. Among them, the nearest neighbor index method was applied to distinguish the spatial distribution type and agglomeration degree of AIDTs in China (Zhu et al., 2017); Kernel density was employed to analyze the spatial distribution density characteristics of AIDTs (Zhu et al., 2016; Wang et al., 2017); The grid dimension method of fractal theory was adopted to analyze the geometric fractal characteristics of the multi-level spatial structure of AIDTs (Miao et al., 2017; Xiao and Huang, 2017); With the help of spatial autocorrelation correlation degree and spatial cold hot spot method, the spatial connection of AIDTs was analyzed (Chen et al., 2018).

2.2.1 Nearest neighbor index

The nearest neighbor distance index method is to calculate the mean distance of any point in the study area, which represents the degree of mutual proximity between points. There are three types of point elements: completely random pattern, spatial agglomeration pattern and uniform distribution (Tang and Ma, 2021). The nearest neighbor index method is applied to judge the spatial proximity of industrial towns (Table 1). The formula is expressed as follows:
$R=\frac{\bar{r_{1}}}{\bar{r_{E}}}=2\sqrt{D}$
Herein, R denotes the nearest neighbor index, $\bar{r}_{1}$ represents the mean value of the actual nearest distance of any point, $\bar{r}_{E}$ signifies the mean value of the theoretical expected nearest neighbor distance, and D is the point density.
When R = 1, the point is completely random; when R > 1, the distribution pattern is uniform; when R < 1, the distribution pattern of point tends to be spatial agglomeration.

2.2.2 Kernel density estimation

The kernel density estimation method is to estimate the event density of any point in the region. The probability of occurrence in the area with dense points is higher than that in the area with sparse points. It represents the spatial density analysis of the point pattern. When the distance between the point and the center reaches a certain threshold value, the range density value is 0 (Wang et al., 2021). The formula is expressed as follows:
$\overset{\frown}{f} (x) =\frac{1}{nh^{d}}\sum^{n}_{i=1}K(\frac{x-x_{i}}{h})$
Herein, $\overset{\frown}{f} (x) $ denotes the kernel density, xi represents the coordinate position of the point to be calculated, x signifies the average, h is the bandwidth threshold distance, K denotes the spatial weight, n is the number of calculated points, and d represents the point dimension value.

2.2.3 Grid dimension analysis

The grid dimension analysis is an index of spatial distribution structure and complexity of judgment point set (Chen et al., 2018). When the gridding measure is conducted in the range of point set space, the grid dimension N(r) will change with the change of the network scale x (Zheng et al., 2020). If the spatial distribution possesses the scale-free property of agricultural industry demonstration towns in China, the following formula can be obtained:
$N(r) \varpropto r^{-T}$
Herein, T=D0, D0 is the capacity dimension and r is the grid scale. Assuming that the statistical number of grid points is Nij and the number of points in the whole region is N, the probability could be defined as Pij=Nij/N. The information dimension formula is as follows:
$I(r)=-\sum^{k}_{i}\sum^{k}_{i}P_{ij}(r)InP(ij)(r)$
Herein, k=1/X is the number of segments of each edge in the region, Pij denotes the ratio of the number of grid points to that of points in the whole region, and ij represents the grid in row i and column j. If the point set is fractal, the following formula is obtained:
$I(r)=I_{0}-D_{1}Inr$
Herein, D1 denotes the information dimension. I0 is constant, which reflects the equilibrium of points in spatial distribution. Generally, the value of grid dimension D is between 0 and 2. D=2 indicates that the points are evenly distributed; when the D value approaches 1, the points tend to be concentrated in a geographical belt; when D1 = D0, the points form a simple fractal.

2.2.4 Spatial correlation analysis

The spatial autocorrelation analysis aims to compare the similarity degree of spatial observations near the location and analyze the clustering degree of high and low values of cold and hot spots (Sridharan et al., 2007). Moran’s I index and Getis-Ord $Z(G^{*}_{i})$ correlation value, Moran’s I index measurement formula:
$I=\frac{n\sum^{n}_{i=1}\sum^{n}_{j=1}W_{ij}(X_{i}-\bar{X})(X_{j}-\bar{X})}{\sum^{n}_{i=1}\sum^{n}_{j=1}W_{ij}\sum^{n}_{i=1}(X_{i}-\bar{X})^{2}}$
Herein, Xi and Xj represent the observation values of spatial positions i and j respectively and n denotes the number of samples. If i and j are neighbors, Wij = 1; if not, Wij = 0. If the statistical value of global Moran’s index I is between [–1,1] and the Moran’s index is a significantly positive correlation, there is spatial autocorrelation and spatial agglomeration; if not, the points are scattered; if Moran’s index approaches zero, the observation points are independent and random distribution. Getis-Ord$Z(G^{*}_{i})$ the standardized formula is as follows:
$Z(G^{*}_{i})=G^{8}_{i}-E(G^{*}_{i})/ \sqrt{Var(G^{*}_{i})}$
Herein, $E(G^{*}_{i})$ and $Var(G^{*}_{i})$ represent the theoretical expectation value and the theoretical variance of $G^{*}_{i}$ respectively. If $Z(G^{*}_{i})$ is positive and significant, it indicates the high-value spatial agglomeration of i point and the existence of “hot spot area”; if $Z(G^{*}_{i})$ is negative and remarkable, point i belongs to “cold spot area” and low-value spatial agglomeration.

3 Results

3.1 Spatial distribution characteristics

Using ArcGIS 10.3 spatial statistical tools, according to the calculation results (Table 1), the average observation distance $\bar{r_{1}}$ is calculated as 54.07 km, the expected average distance $\bar{r_{E}}$ is 88.16 km, the nearest neighbor ratio is 0.61 < 1, and the Z score is –17.39. Through the test of 99% confidence, the results indicate that the strong industrial towns display the characteristics of condensed matter distribution, and the first and second batch of AIDTs also exhibit the characteristics of the condensed matter distribution in space. According to the statistics of the list of AIDTs in China (excluding Hong Kong, Macao, and Taiwan), the most distributed area in terms of quantity is the central and eastern region with Shandong, Henan, and Jiangsu accounting for 7.7%, 6.5%, and 5.6% respectively and Sichuan in southwest China accounting for 6.5%. The number of AIDTs occupies the top four places in China. From the perspective of different batches, Tibet, Qinghai, Ningxia and other provinces in northwest China occupy a relatively small proportion with two batches taking up 0.72%, 0.9%, and 0.72% respectively. Notably, there are remarkable differences in geographical distributions, which display a condensed distribution on the whole. The calculation results indicate that the list of industrial towns is consistent with the main grain-producing areas in China.
Table 1 Nearest neighbor index of AIDTs in China
Type Number $\bar{r_{1}}(km)$ $\bar{r_{E}}(km)$ R Z P
All 552 54.04 88.16 0.61 -17.39 <0.01
First batch 254 88.37 125.24 0.70 -8.97 <0.01
Second batch 298 75.60 118.44 0.64 -11.94 <0.01

3.2 Spatial type characteristics

Observed from the analysis of the spatial core density map (Fig. 2), the core density of all industrial towns is characterized by the formation of multiple single-core centers, independent secondary centers, and sporadic distribution. The overall multi-core centers are Shandong, Henan, Jiangsu, and other single-core centers and Sichuan Basin sub-single- core accumulation areas. The sub-centers are mainly the Northeast Plain and east China, central China, and most parts of south China, and the centers gradually spread around to form multi-point agglomeration, which is more in line with the state of equal distribution. Observed from the comparison of the two batches, the core area of the kernel density of the second batch of AIDTs shifts to the central and southern part based on the first batch and the spatial distribution pattern of the two batches has barely changed, implying no significant impact on the overall spatial distribution trend but some changes in the quantitative value. Meanwhile, due to geographical and other natural factors, the kernel density of industrial towns in Tibet, Qinghai, and Ningxia are at the lowest level. The distribution density of AIDTs in China is 0.58 towns (104 km2)-1, among which the top five are Shanghai, Jiangsu, Shandong, Tianjin and Hainan, with 4.55 towns (104 km2)-1, 2.96 towns (104 km2)-1, 2.70 towns (104 km2)-1, 2.51 towns (104 km2)-1 and 2.09 towns (104 km2)-1, respectively. The distribution density of Jiangxi, Guizhou, Guangxi and Ningxia is less than 1 town (104 km2)-1.
Fig. 2 Kernel density of AIDTs in China

3.3 Complexity of spatial distribution

According to the grid dimension analysis method, arcgis10.3 was employed to calculate and calculate the construction space complexity of China’s AIDTs. The grid K (2 ≤ K ≤ 10) was made according to the change of the number of sides in the rectangular area, the grid dimension N(r). The information value I(r) (Table 2) was calculated and the two logarithm coordinate scatter map is drawn, The capacity dimension and information dimension of “building a strong town in China’s agricultural industry” are calculated by fitting regression (Fig. 3). The results indicate that the overall and the first and second sub-systems of AIDTs have significant scale-free zone measurement coefficients (0.9903, 0.9938, and 0.9841 respectively) and the AIDTs system belongs to the fractal structure. The difference between capacity dimension D0 (1.4604, 1.4206, 1.3689) and information dimension D1 (0.7495, 0.7451, and 0.7376) and D1<D0 is significant, implying that the AIDTs have an unequal probability distribution and the system classification is more complex. The information dimension value and capacity dimension value are close to 1, suggesting that the spatial distribution of AIDTs is relatively concentrated. Through the comparative analysis, the spatial distribution of AIDTs is found, which is mainly distributed in the central, eastern, and northeast plains of China. The reason lies in that the distribution is along the main grain-producing areas in China with fertile soil and good geographical conditions.
Table 2 The calculating date of grid dimension of the AIDTs in China
Type K 2 3 4 5 6 7 8 9 10
All N(r) 4 8 14 18 24 26 32 39 45
I(r) 0.9076 1.6525 2.0176 2.3183 2.5092 2.7609 3.0023 3.1968 3.3932
First batch N1(r) 4 8 12 17 23 25 30 35 42
I1(r) 0.9032 1.6622 2.0352 2.3213 2.5080 2.7693 2.9777 3.1840 3.3686
Second batch N2(r) 4 7 13 17 19 21 28 32 40
I2(r) 0.9112 1.6391 1.9867 2.2994 2.4524 2.7098 2.9544 3.1208 3.3562

Note: K denotes the number of grids segmented in the rectangular area (2 ≤ K ≤ 10).

Fig. 3 Double logarithm scatter plot for grid dimension of AIDTs in China

3.4 Spatial correlation characteristics

Spatial Statistics Tool in ArcToolBox was selected to calculate the global Moran of the spatial distribution of China’s AIDTs construction, the estimated value of Moran’s I being 0.08591>0 and the Z value of the normal distribution statistic being 1.073. The results indicate that the spatial distribution of the construction of AIDTs has a significant positive correlation and the distribution of AIDTs does not show a completely random distribution. In a certain regional spatial distribution, the number and scale of AIDTs display significant agglomeration (Table 3). Afterward, the local correlation index Getis-Ord $G^{*}_{i}$ statistical value was calculated and the cold and hot spot map of China’s AIDTs construction space was drawn and presented useing ArcGIS 10.3 software tools and through the natural fracture method and other methods (Fig. 4). The results demonstrate that the industrial towns comprise four parts, namely the hot spot area, sub-hot spot area, cold spot area, and sub cold spot area. The layout of the industrial towns displays a gradient distribution pattern from east China to central China and most of south China to west China. Shandong, Henan, and Jiangsu are hot spots, jointly accounting for 26% of the total; the sub hot spots are Heilongjiang, Liaoning, Hunan, Hubei, Guangdong, and Guangxi, accounting for 32.06% of the total; the cold spot area and sub cold spot area are Tibet, Qinghai, Ningxia, Inner Mongolia, and 15 other provinces, accounting for 40.53% of the total. The data demonstrate that the distribution points of AIDTs are mainly concentrated in hot spots with significant spatial and regional distribution differences.
Table 3 Global Moran’s I index of the China’s AIDTs
Indicators Value
Global Moran’s I 0.0859
Expectation -0.0303
Variance 0.0117
Z 1.0730
P 0.2832
Fig. 4 Hot spot areas of spatial distribution of the China’s AIDTs

4 Influencing factors of spatial distribution

4.1 Natural factors

(1) Natural terrain foundation. Through the research on the terrain and climate conditions of the spatial distribution of strong industrial towns and the overlay analysis of China's land topographic elevation map, it is found that the construction of AIDTs in China is spatially distributed in the Jianghuai Plain, Jianghan Plain, Sanjiang Plain, Songnen Plain, Chengdu Plain, and Pearl River Delta Plain with good irrigation conditions and other natural advantages. In addition, the natural advantages, a good foundation of agricultural cultivation, and convenient implementation of the mechanized operation could help implement large-scale planting. The range of Jianghuai Plain lies at 28°N to 34°N, the longitude range being 114°E to 121°E. The terrain is low and flat and the water network is dense. It belongs to the rice production area and the freshwater aquaculture area. Sanjiang Plain and Songnen Plain are endowed with excellent geological conditions, flat terrain, and fertile soil; moreover, the difference in terrain structure is significant, which causes the difference in climate; the heat deficient areas are the Northeast Plain and the Qinghai Tibet Plateau. The areas with sufficient light are Qinghai Tibet Plateau and northwest inland and the area with insufficient light is Sichuan Basin. Due to China’s vast area and complex and diverse natural environment, there are regional differences in the type and structure of the agricultural industry. Therefore, the series of differences in geographical space like region, season, sunshine, and precipitation also differ in the type of agricultural production due to different terrains. The plain area has flat terrain, fertile soil, good farming conditions, and a high degree of mechanization. Due to the poor soil, soil erosion, inconvenient transportation, and other factors, mountainous areas are more suitable for the development of forestry and animal husbandry. Guizhou, Yunnan, and other provinces belong to acidic soil, which is suitable for tea planting according to the type of agricultural industry. Therefore, due to the impact of natural factors, there are regional differences like vegetation, landscape, and temperature.
(2) Water resources impact. Agricultural production is a resource-based industry. People use the natural productivity of land to carry out planting and breeding activities. Limited by natural resources like climate, soil, water, landform, and sunshine, different types of planting and breeding appear, thus forming different agricultural industrial structures. Water is an essential natural resource that affects human production and life. The hot spot area of AIDTs is located in the south of Huaihe River and the north of Yangtze River with flat terrain, interwoven water network, and numerous lakes. The main crops are rice and winter wheat with an average annual precipitation of 1100-1500 mm. The region is rich in water resources and perfect water conservancy facilities. The other hot spot is located in Chengdu Plain and Sanjiang Plain of Sichuan Basin with flat terrain and good irrigation conditions. Strong industrial towns are mainly distributed around water systems and rivers and areas with good natural conditions in an irregular spatial distribution. There are numerous AIDTs in areas with abundant water resources and precipitation and better development of the agricultural industry. In east China, south China, and northeast China, 58.06% of the agricultural hot spots and sub hot spots are distributed. Notably, the spatial distribution pattern and industrial development of AIDTs are affected by natural factors.

4.2 Human factors

(1) Location basis is the driving force of development. According to Du Neng’s agricultural location theory, it is found that most of the AIDTs are located in areas with good natural conditions, convenient transportation, good market foundation, and a certain scale of the agricultural industry which form an agglomeration effect. According to the location development foundation, characteristic agriculture and rural tourism industry should be developed in line with local conditions and the development of the green agriculture industry and the sustainable development of agriculture should be encouraged.
(2) Policy support, science, and technology support. “The country is based on the people and the people live on food”. Food production security is not only related to national economic security and people’s livelihood but also an essential strategic resource. The construction of AIDTs is an agricultural industry supporting policy proposed from the perspective of national strategy. It aims to support the development of agricultural industry construction, ensure food security, as well as social harmony and stability, develop the agricultural economic industry, encourage more people to invest in agriculture, increase scientific and technological support, and develop efficient agriculture by improving irrigation technology conditions, cultivating fine varieties, reforming farming methods, professional pest control, and planting technologies. Most of the demonstration sites for the construction of strong agricultural towns are located in the main national grain-producing areas with good geographical basis and convenient production conditions.
(3) Reform is the strategy and talents are the key. We should actively explore the “three changes” reform mode and, change the inherent thinking mode of farmers to promote the transformation of land resources into assets, funds into shares, farmers into shareholders, and the cooperation mode of companies, cooperatives, and farmers. A collective economy and scale economy should be developed to make the agricultural industry larger and stronger. Talents are the key to the development of science and technology agriculture whose development needs a group of professional leaders who excels in technology, operation, and management. They should make full use of the unique resources and funds to develop the agricultural economy and encourage college students and migrant workers to return home to participate in agricultural production. The primary task of the Rural Revitalization Strategy is industrial prosperity, for which the agricultural industry is the root. Only by vigorously developing the agricultural industry could the foundation of rural development be laid.
In conclusion, the spatial structure characteristics of the construction of AIDTs in China are the result of the combined action of natural and human factors. Based on the results of the factors that affect the construction of the agricultural industry, natural geological conditions and climate environment are the natural basis of agricultural production; science and technology, labor force, and transportation are the primary support for agricultural production. Humans and the natural environment are the foundation of development while science and technology are the guarantees. Only by seizing the opportunity of agricultural development could the agricultural economy be developed and the farmers increase their income and become rich. The “urban-rural dual structure” development model should be changed by developing rural cultural heritage, ecological agriculture, and characteristic agriculture and training new farmers to implement the Rural Revitalization Strategy.

5 Discussion

The effective connection between the development of the agricultural industry and rural revitalization has raised close attention from the Chinese government and academia. With the implementation of the Rural Revitalization Strategy, the prosperity of the agricultural industry has imposed an essential impact on its development. Investigating the geographical constraints and influences of agricultural industry development could provide technical support for the development of the rural agricultural industry. The difference between this paper and the previous research lies in that the latter aimed to analyze the impact of agricultural industry development in a specific region from panel data to examine the problem of industrial prosperity. Based on the data of China’s AIDTs layout, this paper interprets the geographical spatial distribution and influencing factors of 552 AIDTs in China, hoping to provide decision-making references for the development of agricultural industry layout.

5.1 Political implications

With the spatial distribution of AIDTs as the mainline, the spatial distribution pattern of the AIDTs in China has been drawn systematically. Industrial prosperity is the primary task of the implementation of the Rural Revitalization Strategy (Li et al., 2016; Long et al., 2016). How to achieve rural revitalization is specifically interpreted from a strategic perspective at the national level and discussed from three aspects as follows:
First, institutional guarantees and strict implementation of the land and space control plan should be ensured. In particular, regarding the management of permanent basic farmland, we should strictly implement the balance between occupation and compensation and eliminate the phenomenon of good occupation and poor compensation. With strengthening the prosperity of the agricultural industry as the carrier and starting point, rural revitalization must strengthen the planning control and establish the management system and accountability system of agricultural industry construction, focusing on the implementation of agricultural industry planning and construction.
Second, we should fully comprehend the geographical and spatial differences of AIDTs, take corresponding adjustment measures according to local conditions, and implement them by classification to strengthen the industrial layout. Observed from the spatial distribution structure and type characteristics of the construction of AIDTs, we should carry out the agricultural industry planning, promote the spatial layout of AIDTs and the linkage between towns and villages, and make adjustments to the industrial structure to develop efficient agriculture and stimulate the vitality of villages.
Third, we should emphasize the spatial distribution characteristics of AIDTs and increase the investment in agricultural infrastructure. Apart from the need to improve system support, institutional support should be guaranteed in terms of the agricultural industrial structure, agricultural science and technology, and talent introduction for rural revitalization. This paper focuses on the problems of “man-land relationship, ecological environment, soil erosion, environmental protection and management, and resource shortage”. Regarding the issue of industrial development, we should adhere to the market orientation to establish the investment, financing, production, and marketing system and promote the market-oriented allocation of resources.

5.2 Limitations

Industrial prosperity is the foundation of rural revitalization. The research on the layout of China’s AIDTs will help analyze the constraints on the agricultural industry and provide a reference for its development. The present study applies the spatial analysis method to examine the spatial pattern of AIDTs in China without considering other factors. The research only analyzes the spatial distribution of China’s AIDTs from the macro perspective but does not differentiate and refine the different regional land types from the micro perspective. Therefore, the research methods remain to be further improved.

6 Conclusions

Taking 552 the geospatial distribution of AIDTs in China as the research object, this study conducted the spatial analysis via ArcGIS10.3 software, examined and discussed the spatial distribution characteristics and technical methods of demonstration sites of AIDTs in China, analyzed them from the perspective of regional differences, and utilized the spatial research data for the statistical analysis. The conclusions are drawn as follows:
First, there are remarkable differences in the spatial distribution structure of “the construction of strong agricultural towns”. The geographical distribution of the agricultural industry in different batches of areas present significant differences. Most of the agricultural industries in east China, central China, and south China are distributed more in the east and less in the west, and more in the south and less in the north. The agricultural distribution is relatively concentrated.
Second, the spatial track of AIDTs is moving to “central and southern China”, showing the trend of agglomerative distribution with different batch spaces significantly concentrated. The center of all the two batches shifts to the central and southern part, displaying a “one shape” development trend from the Sanjiang Plain, the Jianghuai Plain, and the Pearl River Delta.
Third, the kernel density space of AIDTs is highly consistent with the pattern of national agricultural main functional areas. The spatial distribution of kernel density in “Shandong, Henan, and Hebei”, the Sichuan Basin, and “Jiangsu, Anhui, and Zhejiang” shows high-density areas and decreases from these areas to central and northeast ones. The overall kernel density distribution of the construction of AIDTs is consistent with the spatial distribution of national agricultural strategies.
Fourth, the fractal structure of the construction of AIDTs is complex with unequal spatial distribution probabilities. Affected by natural factors and location factors, it has a significant scale-free range in space. The cold and hot areas are distributed from the middle east to the central south and northeast of China. The construction of AIDTs in China is mainly concentrated in the hot areas and there are significant regional differences in the spatial distribution of each region.
[1]
Brown C, Zhang J, Zhuoga D Q, et al. 2021. Market integration and agricultural development: The case of Tibet’s ruminant livestock industries. Agribusiness, 37(4): 1-20.

DOI

[2]
Chen G L, Luo J, Zhang C Y, et al. 2018. Characteristics and influencing factors of spatial differentiation of urban black and odorous waters in China. Sustainability, 10(12): 4747. DOI: 10.3390/su10124747.

DOI

[3]
He Y H, Fan S G, Zhou G H, et al. 2018. Evaluation of rural transformation development in Hunan Province based on major function oriented zoning. Progress in Geography, 37(5): 667-676. (in Chinese)

DOI

[4]
Hu X Y, Bao J G. 2016. Evolution of rural tourism landscape character network: The case of Jiangxiang Village. Geographical Research, 35(8): 1561-1575. (in Chinese)

DOI

[5]
Li C W, Liang S B, Che Q J. 2015. Spatial reconstruction of the rural settlements in Wuhu City based on the function oriented zoning. Resources and Environment in the Yangtze Basin, 24(10): 1736-1743. (in Chinese)

[6]
Li E L, Xu Y N, Yong Y J, et al. 2018. Agricultural structure adjustment and rural transformation development in China: Taking Gongyi City and Yanling County as examples. Progress in Geography, 37(5): 698-709. (in Chinese)

[7]
Li Y L, Li H, Xiao H B. 2016. Research on the integration development of primary, secondary and tertiary industries in foreign rural areas. World Agriculture, (6): 20-24. (in Chinese)

[8]
Lin Y Y, Shui W, Li Z P, et al. 2021. Green space optimization for rural vitality: Insights for planning and policy. Land Use Policy, 108(8): 105545. DOI: 10.1016/j.landusepol.2021.105545

DOI

[9]
Liu Y S. 2018. Research on the urban-rural integration and rural revitalization in the new era in China. Acta Geographica Sinica, 73(4): 637-650. (in Chinese)

DOI

[10]
Liu Y S, Chen C, Li Y H. 2014. The town-villages construction pattern under new-type urbanization in China. Areal Research and Development, 33(6): 1-6. (in Chinese)

[11]
Liu Y S, Yan B, Wang Y F. 2016. Urban-rural development problems and transformation countermeasures in the new period in China. Economic Geography, 36(7): 1-8. (in Chinese)

DOI

[12]
Long H L. 2012. Land use transition and rural transformation development. Progress in Geography, 31(2): 131-138. (in Chinese)

DOI

[13]
Long H L, Hu Z H, Zou J. 2010. The evolution of rural policy in Britain and its policy implications for rural development in China. Geographical Research, 29(8): 1369-1378. (in Chinese)

[14]
Long H L, Liu Y S. 2016. Rural restructuring in China. Journal of Rural Studies, 47: 387-391.

DOI

[15]
Long H L, Liu Y S, Li X B, et al. 2010. Building new countryside in China: A geographical perspective. Land Use Policy, 27(2): 457-470.

DOI

[16]
Long H L, Tu S S. 2018. Theoretical thinking of rural restructuring. Progress in Geography, 37(5): 581-590. (in Chinese)

DOI

[17]
Long H L, Tu S S, Ge D Z, et al. 2016. The allocation and management of critical resources in rural China under restructuring: Problems and prospects. Journal of Rural Studies, 47: 392-412.

DOI

[18]
Lu D D. 2021. Review on “China urbanization and agricultural and rural development”. Acta Geographica Sinica, 76(6): 1-12. (in Chinese)

[19]
Miao Y, Wang C X, Wu Y, et al. 2017. The spatio-temporal evolution characteristics of China’s civil airports structure and its optimization. Economic Geography, 37(11): 37-45. (in Chinese)

[20]
Natsuda K, Igusa K, Wiboonpongse A, et al. 2012. One village one productrural development strategy in Asia: The case of OTOP in Thailand. Canadian Journal of Development Studies, 33(3): 369-385.

DOI

[21]
Porter M E. 1990. The competitive advantage of nations. Harvard Business Review, 68(2): 73-93.

[22]
Sridharan S, Tunstall H, Lawder R, et al. 2007. An exploratory spatial data analysis approach to understanding the relationship between deprivation and mortality in Scotland. Social Science & Medicine, 65(9): 1942-1952.

DOI

[23]
Tang J X, Ma M Y. 2021. Spatial layout and linkage mode of industrial tourism in Changsha-Zhuzhou-Xiangtan urban agglomeration from a multi-scale perspective. Scientia Geographica Sinica, 41(8): 1428-1436. (in Chinese)

DOI

[24]
Tang S S. 2012. Rural policy and enlightenment in the process of rapid urbanization in france. Issues in Agricultural Economy, 33(6): 104-109. (in Chinese)

[25]
Thompson C S. 2004. Host produced rural tourism: Towa’s Tokyo antenna shop. Annals of Tourism Research, 31(3): 580-600.

DOI

[26]
Wang H Q, Yuan J D, Meng X J. 2017. Spatial distribution and its influencing factors of level—A scenic spots in northeast China. Scientia Geographica Sinica, 37(6): 895-903. (in Chinese)

[27]
Wang Z Y, Cheng F. 2021. Spatio-temporal differentiation and influencing factors of China’s marine environmental regulation efficiency. Geographical Research, 40(10): 2885-2896. (in Chinese)

[28]
Xiao Z, Huang X J. 2017. Spatial characteristics of tea production in the Yangtze River Economic Zone. Economic Geography, 37(5): 110-115. (in Chinese)

[29]
Xie J Y, Jin X B, Lin Y N, et al. 2017. Quantitative estimation and spatial reconstruction of urban and rural construction land in Jiangsu Province, 1820-1985. Journal of Geographical Sciences, 27(10): 1185-1208.

DOI

[30]
Yang R, Xu Q, Long H L. 2016. Spatial distribution characteristics and optimized reconstruction analysis of China’s rural settlements during the process of rapid urbanization. Journal of Rural Studies, 47: 413-424.

DOI

[31]
Zhang S M, Zhong L S, Wang L. 2012. Research on development model of China’s rural tourism based on tourism system theory. Geographical Research, 31(11): 2094-2103. (in Chinese)

[32]
Zhang Y J, Cao H. 2015. Optimal models of new rural construction and settlements system reconstruction based on regional major function: An exploration with the aid of figure-ground theory. Human Geography, 30(6): 83-88. (in Chinese)

[33]
Zheng G H, Jiang D F, Chen G L, et al. 2020. Spatial distribution pattern and influence mechanism of key rural tourism villages in China. Journal of Arid Land Resources and Environment, 34(9): 194-201. (in Chinese)

[34]
Zhu L, Hu J, Xu X T, et al. 2016. Spatial distribution pattern and formation of pro-poor tourism pilot villages in China. China Population, Resources and Environment, 26(11): 130-138. (in Chinese)

[35]
Zhu L Y, Xu S, Lan S R. 2017. Spatial distribution characteristics of national protected areas and the inspirations to national parks in China. Geographical Research, 36(2): 307-320. (in Chinese)

Outlines

/