Soil Ecosystem

Spatial Differentiation of the Coupling Characteristics of Soil Carbon and Nitrogen on Mulberry Plantations in China

  • WANG Xie , 1, 2, * ,
  • HU Yang 1, 3 ,
  • GUO Haixia 3 ,
  • ZHANG Jianhua 1, 2 ,
  • TANG Tian 1 ,
  • ZENG Qiguo 3
Expand
  • 1. Sichuan Academy of Agricultural Sciences Institute of Agricultural Resources and Environment, Chengdu 610066, China
  • 2. Southwest Mountain Agricultural Environment Key Laboratory, Ministry of Agriculture and Rural Areas, Chengdu 610066, China
  • 3. Chengdu Normal University, Chengdu 611130, China
*WANG Xie, E-mail:

Received date: 2021-10-05

  Accepted date: 2022-03-20

  Online published: 2023-01-31

Supported by

The China Agriculture Research System of MOF and MARA(CARS-18)

The Project of Sichuan Province Key Lab for Bamboo Pest Control and Resource Development(17ZZ013)

Abstract

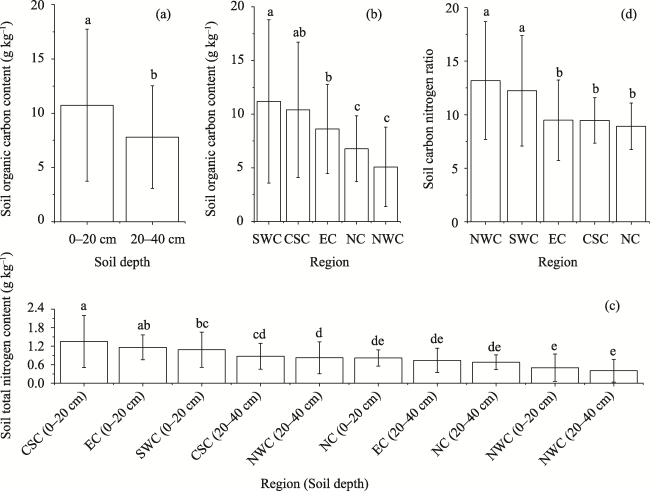
Soil is the most important carbon pool of the mulberry plantation ecosystem, so understanding the characteristics of the soil carbon pool in mulberry plantations provides an important basis for the research of carbon sinks in economic forest ecosystems and farmland ecosystems. In order to explore the spatial differentiation pattern of the relationship between carbon and nitrogen in mulberry plantation soil, this study analyzed the organic carbon content and total nitrogen content of the surface soil layer (0-20 cm) and the subsurface soil layer (20-40 cm) of 475 mulberry plantations in five major regions of China, Southwest China (SWC), Central South China (CSC), East China (EC), North China (NC), and Northwest China (NWC). The research showed seven key aspects of this system. (1) The soil organic carbon of mulberry plantations was significantly different at the two soil depths. The average content of organic carbon in the surface layer of mulberry plantation soil was 10.71±7.01g kg‒1, which was 37.13% higher than that of the subsurface layer. (2) The soil organic carbon of mulberry plantations had significant differences in spatial differentiation, which was manifested as SWC>CSC>EC>NC>NWC. (3) The total nitrogen content in mulberry plantation soil had significant responses to the region, the soil layer depth, and the interaction between the region and soil layer depth. Among the regions, NWC had no significant difference between the surface layer and subsurface layer of the soil. EC had the maximum difference in total nitrogen content, with the total nitrogen content in the surface soil layer being 56.68% higher than that of the subsurface soil layer. The total nitrogen contents of the surface soil layers in the SWC and NC were 34.27% and 20.79% higher than those of the respective subsurface soil layers. (4) The mulberry plantation soil C/N ratios had a significant response to regional differences, as NWC>SWC> EC>CSC>NC, but this ratio had no significant response to soil depth. (5) Soil pH had significant spatial differentiation in relation to soil organic carbon and total nitrogen content in mulberry plantations. NWC had no significant correlation between pH and organic carbon or total nitrogen content, while CSC had a significant positive correlation between pH and both soil organic carbon and total nitrogen content. Other regions showed significant negative correlations between pH and both organic carbon and total nitrogen content. (6) There was a significant negative correlation between the C/N ratio of the surface soil layer and pH in mulberry plantations, which was mainly contributed by SWC, while the other regions’ surface soil layers had no significant correlations between C/N ratio and pH. (7) There was no significant correlation between the C/N ratio and pH in the subsurface soil layer in mulberry plantations. These results reveal that in either the research on mulberry plantation carbon pools or the innovation of green and low-carbon planting technology in mulberry plantations, the spatial differentiation characteristics of soil must be considered. Furthermore, the spatial differentiation of soil organic carbon can be used as the basic foundation for the planning and design of mulberry afforestation or ecological restoration projects.

Cite this article

WANG Xie , HU Yang , GUO Haixia , ZHANG Jianhua , TANG Tian , ZENG Qiguo . Spatial Differentiation of the Coupling Characteristics of Soil Carbon and Nitrogen on Mulberry Plantations in China[J]. Journal of Resources and Ecology, 2023 , 14(1) : 84 -91 . DOI: 10.5814/j.issn.1674-764x.2023.01.008

1 Introduction

Terrestrial ecosystem carbon and nitrogen cycles are important parts of the earth's carbon and nitrogen cycles, and soil is the foundation and the most important component of the terrestrial ecosystem (Schmidt et al., 2011). In recent years, global warming has been growing more intensive. Countries around the world are increasingly demanding the reduction of greenhouse gas emissions, especially carbon emissions. In 2020, China proposed to reach the peak of carbon emissions by 2030 and to achieve carbon neutrality by 2060 (Wang et al., 2021). Every industry has the responsibility and obligation to reduce its carbon emissions. Soil is the largest carbon pool in the terrestrial ecosystem, which can store carbon twice as much as the atmosphere and three times as much as plants (Scharlemann et al., 2014). Soil carbon and nitrogen emissions play a very important role in the global climate, and small changes in soil carbon and nitrogen pools will affect the global atmosphere.
Agricultural land is the main land utilization type in the world, and agricultural soils play a very important role in the global carbon cycle. In China, the annual average carbon sequestration of agricultural soil has been about 20-25 Tg (Lal, 2004). The carbon and nitrogen properties of farmland soil are jointly affected by crops (Chai et al., 2014), farming systems (Johnson et al., 2007), and water and fertilizer management systems (Liu et al., 2018). Chai (2009) found that compared with growing maize alone, the maize-wheat, maize-rape, and maize-pea intercropping systems showed 42%, 52%, and 45% less soil carbon emissions, respectively. Johnson et al. (2007) compared the differences in soil properties of 35 farms over the past 20 years, and founded that the farm soil organic carbon content increased by an average of 19% by growing low-carbon crops and conducting organic management, while the soil organic carbon content of traditional farms only increased by 9%. Liu et al. (2018) found that using proper management and fertilization, the average carbon emissions of agricultural soil and the average carbon emissions of crops decreased by 9.7% and 30.4%, respectively. In general, developing low-carbon agriculture can also reduce nitrogen emissions by 1.8 Tg per year on average (Saikawa et al., 2014). Therefore, research on agricultural soil carbon sequestration and the carbon and nitrogen cycles cannot ignore the impacts of crops and farmland management systems (Tao et al., 2019).
China is a large agricultural country which has become an important node of modernization and low-carbon in agriculture (Zhang and Huisingh, 2008). The development method adopted by agriculture is not only related to agriculture itself, but also closely interrelated with the goals of reducing carbon emissions and achieving carbon neutrality in China (Mi et al., 2017). Therefore, research on the carbon sequestration capacity of agricultural land under the background of planting a single crop has great significance for revealing the role of crops in the soil carbon and nitrogen cycles and accurately assessing the soil carbon sequestration function of planted crops (Poeplau and Don, 2015). Mulberry is a traditional woody crop in China that has economic value, medicinal value, feed value and ecological value (Srivastava et al., 2003). Mulberry has strong vitality and environmental adaptability, and it can provide rich economic products, which is very important in poverty alleviation and rural revitalization. Mulberry trees are planted widely in China, from the southeastern coast to the western Xinjiang desert oasis, from Hainan Island to the Songhua River in the northeast, and even the Tibetan Plateau has planted mulberry (Li et al., 2020). At present, the carbon sequestration ability of mulberry plantations has also received a great deal of attention from experts and scholars (Kar et al., 2018), although the current research mainly focuses on the carbon sequestration capacity of mulberry itself (Rohela et al., 2020), and few studies have examined the soil carbon pool of mulberry soil. This lack of knowledge is very unfavorable for fully grasping the carbon sink capacity of mulberry soil in China. Therefore, this paper explores the carbon and nitrogen coupling characteristics of mulberry soil in various regions and the differences between regions, and obtains the characteristics of soil carbon and nitrogen coupling in mulberry soil in China, thus providing a research reference for carbon sequestration in other economic forest ecosystems and agricultural ecosystems.

2 Study region and research methods

2.1 Study region

The area of China’s mulberry plantations in 2020 was 764333 ha, mainly distributed in 20 provinces including Guangxi, Sichuan, Yunnan, Jiangsu, Zhejiang, Anhui, Shandong, Hainan, Gansu and Xinjiang. This paper divided the provinces into six research areas: North China (NC), East China (EC), Central South China (CSC), Southwest China (SWC), Northwest China (NWC) and Northeast China (NEC) (Table 1).

2.2 Sample collection

From 2015 to 2020, the research team successively collected 950 soil samples from surface soil (0-20 cm) and subsurface soil (20-40 cm) in 475 mulberry plantations in China (Table 1). Sample collection and preparation followed the Methods of Soil Analysis Standard. Nine sampling points were designated in each plantation according to an S-shape, and a 6 cm diameter soil drill was used to collect surface soil (0-20 cm) and subsurface soil (20-40 cm). The surface and subsurface soil samples of each mulberry garden were obtained by the quartering method. Finally, a sample weighing 500 g was obtained. The soil samples were sent to the laboratory for the next step of analysis and testing. The collection times of the samples were between October and December, and they were required to be 30 days after the most recent fertilization.
Table 1 Sample mulberry plantation number in different areas in China
Region Abbreviation of region Province Number of sampled
mulberry plantations
North China NC Shanxi, Hebei, Beijing*, Tianjin*, Inner Mongolia* 101
East China EC Jiangsu, Zhejiang, Fujian, Anhui, Shandong, Jiangxi, Taiwan*, Shanghai* 103
Central South China CSC Hubei, Hunan, Henan, Guangdong, Guangxi, Hainan, Macao*, Hong Kong* 58
Southwest China SWC Sichuan, Guizhou, Yunnan, Chongqing, Tibet* 191
Northwest China NWC Shaanxi, Gansu, Qinghai*, Ningxia*, Xinjiang 22
Northeast China NEC Heilongjiang*, Jilin*, Liaoning* 0

Note: * The area of mulberry plantations in this area was very small, so it was ignored in the sampling design in this paper.

The analysis of soil pH, organic carbon content and total nitrogen followed the Handbook of Soil Analysis Standard. The soil organic carbon content was analyzed by the potassium dichromate oxidation-external heating method. Soil total nitrogen content was analyzed by the Kjeldahl method. Soil pH was measured using a pH meter. The ratio of water to soil in the leach liquor was 2.5:1.

2.3 Data analysis

The soil carbon to nitrogen ratio was obtained by dividing the soil organic carbon content by the soil total nitrogen content. This study used variance analysis and Tukey’s multiple analysis to analyze the responses of soil organic carbon content, total nitrogen content, and carbon to nitrogen ratio to soil depth and region. The correlations between soil carbon and nitrogen in mulberry plantations across the country were determined by bivariate correlation analysis. Data processing used Microsoft Excel 2016, data analysis used R-project 3.6.2, and the data display used Origin 9.0.

3 Results and analysis

3.1 The responses of soil organic carbon content to soil depth and region

Table 2 shows that the soil organic carbon content of mulberry plantations had a significant response to soil depth and region (P<0.01) but did not have a significant response to the interaction between soil depth and region (P=0.12). Regarding the depth of the soil layer, the average organic carbon content of the soil surface layer of the mulberry plantations was 10.71±7.01 g kg‒1, which was 1.37 times that of the soil subsurface layer (Fig. 1a). Regarding the regional differences, the sequence of average soil organic carbon contents of mulberry plantations was SWC>CSC>EC> NC>NWC (Fig. 1b). The organic carbon content of mulberry plantations in southwestern China was the highest, at 11.19±7.61 g kg‒1, which was not significantly different from Central Southern China. The level in SWC was 1.23 times that of EC, 1.72 times that of NC, and 2.31 times that of NWC (Fig. 1b). There was no significant difference between CSC and EC in soil organic carbon content. Meanwhile, there was no significant difference between NC and NWC in soil organic carbon content (Fig. 1b).

3.2 The responses of soil total nitrogen content to soil depth and region

Table 2 shows that the soil total nitrogen content of mulberry plantations had significant responses to both soil depth and region (P<0.01). For the depth of the soil layer, the average total nitrogen of the soil surface layer of the mulberry plantations was 1.04±0.56 g kg‒1, which was 1.36 times that of the soil subsurface layer (Fig. 1c). For the regional differences, the sequence of average soil surface layer total nitrogen contents of mulberry plantations was CSC>EC> SWC>NC>NWC, and for the average soil subsurface layer total nitrogen content of mulberry plantations the sequence was CSC>SWC>EC>NC>NWC (Fig. 1c). Among the regions, the Central Southern region (CSC) had the highest average total nitrogen content in the soil surface layer of 1.35±0.84 g kg‒1, which was 1.6 times that of the soil subsurface layer. The average total nitrogen content of the soil surface layer in EC was 1.16±0.4 g kg‒1, which was 1.56 times that of the soil subsurface layer. The average total nitrogen content of the soil surface layer in SWC was 1.09±0.57 g kg‒1, which was 1.32 times that of the soil subsurface layer. The average total nitrogen content of the soil surface layer in NC was 0.82±0.26 g kg‒1, which was 1.2 times that of the soil subsurface layer. The average total nitrogen content of the soil surface layer in NWC was 0.50±0.44 g kg‒1, and there was no significant difference between the soil surface layer and the subsurface layer in NWC (Fig. 1c).
Table 2 Responses of soil carbon and nitrogen characteristics of mulberry plantations to soil depth and region
Variables Soil layer Region Soil layer × region interaction
F value P value F value P value F value P value
SOC 63.56 <0.01** 29.50 <0.01** 1.82 0.12ns.
STN 79.80 <0.01** 23.54 <0.01** 3.74 <0.01**
C/N 0.12 0.72ns. 34.35 <0.01** 0.80 0.53ns.

Note: **: Marked response (P value ≤ 0.01); ns.: No response (P value > 0.05); SOC: Soil organic carbon content; STN: Soil total nitrogen content; C/N: Carbon-nitrogen ratios of soil. The same below.

Fig. 1 SOC, STN and C/T in various regions in China

Note: All data are shown as mean ± (standard deviation). Different lowercase letters indicate a statistically significant difference (P< 0.05).

3.3 The responses of the ratio of soil organic carbon content and soil total nitrogen content to soil depth and region

Table 2 shows that carbon-nitrogen ratios of mulberry plantations soil had a significant response only to the region (P<0.01), but not to the soil depth (P=0.72). NWC had the highest soil carbon to nitrogen ratio of 13.69±5.94, which was not significantly different from the ratio in SWC. The soil carbon to nitrogen ratio in SWC was 12.48±5.21. The carbon to nitrogen ratio in EC was 9.75±4.32, which was not significantly different from those in NC and CSC. The carbon to nitrogen ratios in CSC and NC were 9.6±2.08 and 8.98±2.21, respectively (Fig. 1d).

3.4 The correlations between soil carbon, total nitrogen content, carbon-nitrogen ratios and soil pH

The soil surface and subsurface organic carbon and total nitrogen of mulberry plantations had a positive and extremely significant correlation in all regions (Table 3, P<0.01), which indicated that the evolution of the soil surface and subsurface layers of mulberry plantations in all regions was closely related and the trend of change was convergent. This study used soil pH as a regulatory factor to conduct the relationship analysis (Table 4). The results showed that there was a significant relationship between surface and subsurface organic carbon and total nitrogen of mulberry plantations in all regions and pH (P<0.01). However, there was no significant relationship between carbon-nitrogen ratios and pH in subsurface soil (P>0.05).
Table 3 Correlation coefficients of soil carbon and nitrogen in mulberry plantations in each region
Soil depth Average NC EC CSC SWC NWC
Surface 0.76** 0.88** 0.79** 0.90** 0.73** 0.94**
Subsurface 0.84** 0.87** 0.87** 0.94** 0.81** 0.95**

Note: **: Marked response (P-value ≤ 0.01).

Table 4 Correlation coefficients of soil parameters and pH in mulberry plantations in each region
Type Soil depth Average NC EC CSC SWC NWC
SOC Soil surface ‒0.26**
(P<0.01)
‒0.41**
(P<0.01)
‒0.19ns.
(P=0.06)
0.63**
(P<0.01)
‒0.38**
(P<0.01)
‒0.27ns.
(P=0.17)
Subsurface ‒0.26**
(P<0.01)
‒0.46**
(P<0.01)
‒0.29**
(P<0.01)
0.35**
(P<0.01)
‒0.40**
(P<0.01)
‒0.41ns.
(P=0.13)
STN Soil surface ‒0.26**
(P<0.01)
‒0.42**
(P<0.01)
‒0.20**
(P<0.01)
0.66**
(P<0.01)
‒0.37**
(P<0.01)
‒0.22ns.
(P=0.26)
Subsurface ‒0.27**
(P<0.01)
‒0.51**
(P<0.01)
‒0.43**
(P<0.01)
0.50**
(P<0.01)
‒0.36**
(P<0.01)
‒0.44ns.
(P=0.09)
C/N Soil surface ‒0.10*
(P=0.02)
‒0.18ns.
(P=0.08)
0.15ns.
(P=0.13)
‒0.14ns.
(P=0.27)
‒0.27**
(P<0.01)
‒0.30ns.
(P=0.11)
Subsurface ‒0.01ns.
(P=0.76)
‒0.09ns.
(P=0.37)
0.28ns.
(P<0.01)
‒0.26ns.
(P=0.05)
‒0.11ns.
(P=0.14)
0.10ns.
(P=0.71)

Note: * response is significant at the 95% of confidence interval level; ** response is significant at the 99% of confidence interval level; ns. response is not significant.

In the correlation between organic carbon and pH, the soil surface organic carbon and pH showed no significant response in NWC and EC, but the other regions had significant responses (P<0.01). Among them, only the Central South region showed a positive correlation between soil organic carbon and pH, while the other regions showed negative correlations between soil organic carbon and pH (Table 4).
In the correlation between total nitrogen and pH, there was no significant response between total nitrogen and pH in NWC, but there were significant responses in other regions (P<0.01). Among them, CSC had a positive correlation between total nitrogen and pH, but the other regions had negative correlations between total nitrogen and pH (Table 4).
In the correlation between carbon-nitrogen ratios and pH, only carbon-nitrogen ratios of the surface soil in the Southwest region was significantly correlated with pH, while carbon-nitrogen ratios of the soil surface and subsurface in the remaining regions had no significant correlations with pH (Table 4).

4 Discussion

4.1 Spatial differences in soil carbon and nitrogen contents in mulberry plantations in China

This study found that the organic carbon and total nitrogen contents of mulberry plantation soils in SWC and CSC were higher than those in EC, NC, and NWC. NWC had the lowest organic carbon and total nitrogen contents. These findings were basically in accord with the basic characteristics of carbon and nitrogen in farmland soils in China (Shangguan et al., 2013). The average soil carbon to nitrogen ratios in the surface (0-30 cm) soil cultivated layer for China and the world are 10.84 (Tian et al., 2010) and 13.58 (Batjes, 1996), respectively. The average carbon-nitrogen ratios of mulberry soil in this study was 10.63, which was markedly lower than the global average but basically the same as the average soil carbon-nitrogen ratios in China. However, the carbon to nitrogen ratios of the soil surface and subsurface in the NWC and SWC regions were all higher than 10, and the carbon to nitrogen ratios of the soil surface and subsurface in NC, EC, and CSC were all less than 10. The carbon to nitrogen ratio of the soil reflected differences in the nature of the soil and the quality of fertilization (Sarrantonio, 2003). The significant response of the soil carbon to nitrogen ratio of mulberry plantations in China to the different regions suggests that there are big differences in the fertilization systems in mulberry plantations in various regions. This is also a reminder that the study of carbon sinks and carbon pools in mulberry plantations needs to consider differences in soil fertility management.

4.2 Vertical distribution characteristics of soil carbon and nitrogen in mulberry plantations in China

This study found that with the deepening of the cultivated soil layer, the average contents of organic carbon and total nitrogen in the soil decreased simultaneously, and the range of vertical variation in the soil organic carbon and total nitrogen content in mulberry plantations was the same, but there were differences in the amplitude of the reduction among the different regions in the sequence of CSC> EC> SWC> NWC> NC. In the typical farmland soil profile in China, organic carbon content decreases by 13% per 20 cm without fertilization, and the total nitrogen content decreases by 19% (Xu, 2017). However, this study found that the organic carbon content of mulberry plantation soil decreased by 36% on average from the soil surface layer to the subsurface layer, and the total nitrogen content decreased by 38% on average from the soil surface layer to the subsurface layer. Those values were all higher than the average decreases in China. Among the regions, the lowest average difference between the soil surface and subsurface was in NC, where the organic carbon and total nitrogen levels of the soil surface were 23% and 20% higher than those of the subsurface, respectively. The decreases in SWC and NWC were 20%-40%, and the decreases in EC and the CSC were 50%-60%. These levels implied that the mulberry plantations in CSC and EC had the largest amount of fertilization, while those in the NC had the least amount of fertilization. These observations are consistent with the soil fertility management levels and management methods of mulberry plantations in the various regions.
It is common knowledge that when carbon-nitrogen ratios is large, the accumulation of organic carbon in the soil can increase; and when carbon-nitrogen ratios is small, the microorganisms in the soil can decompose more nutrients while participating in the decomposition of organic matter and increase the soil total nitrogen content (Hungate et al., 2003). Nitrogen increase is a common method of fertilization. The application of nitrogen fertilizer can increase the activity of microorganisms in the soil, accelerate the decomposition rate of organic matter in the soil, and provide more nitrogen to the soil (Neff et al., 2002). Comparing the soil carbon to nitrogen ratios of mulberry plantations in various regions, the carbon to nitrogen ratios in the SWC and NWC regions are both between 10 and 14. This shows that the accumulation of soil organic carbon in these two regions was relatively high, and it also implies that organic fertilizers may be used in the management of mulberry plantations. In contrast, carbon-nitrogen ratios in CSC, NC, and EC were all less than 10, which may indicate that these three regions mainly used nitrogen fertilizer.

4.3 Soil carbon and nitrogen characteristics of mulberry plantation in CSC

The soil type in the CSC was red soil, and paddy soil which developed on the red soil. The pH values of those soils were between 4 and 7 (Shen et al., 2021). In the hot and rainy climate conditions in this region, even if the soil depth did not change much, the soil organic carbon and total nitrogen contents were also significantly different (Zhang et al., 2009). In those kinds of soils under strong leaching action, the soil desilication and iron-rich aluminization processes are violent, the soil is gradually acidified and the mineralization of organic carbon is intensified, resulting in a low carbon to nitrogen ratio in this region. Furthermore, the soil organic carbon content and total nitrogen content were significantly positively correlated with pH. Therefore, it is necessary to comprehensively consider the degree of soil acidification in the measurement of soil carbon pools in mulberry plantations in Central Southern China. The technology for adjusting acidity and controlling fertilizer is the foundation of agricultural development in this region and the key to stabilizing the soil carbon sequestration ability.

4.4 Soil carbon and nitrogen characteristics of mulberry plantations in NWC

The soil in NWC is mainly brown soil, gray desert soil and desert soil. Relevant studies have shown that the average soil organic carbon content in NWC was 8.38 g kg‒1 (Yang, 2019). This study found that the soil organic carbon content of mulberry plantations in NWC was 4.19-5.55 g kg‒1, which was consistent with the background in which mulberry plantations in the NWC are mainly planted on desert soil and used for wind prevention and sand control. The soil organic carbon and total nitrogen contents in the arid area of NWC varied less than 20% at the depth of the 0-40 cm soil layer, and the soil pH in the arid area of NWC was about 8 with a variation range of less than 10% (Cheng et al., 2018). These findings are consistent with the conclusion that the soil organic carbon and total nitrogen contents of mulberry plantations in NWC were the lowest, and that there were no response relationships between either soil organic carbon, total nitrogen or carbon-nitrogen ratios and the soil depth, region, or soil pH. Although mulberry produces a certain amount of agricultural products, it has also played an important role in preventing desertification and improving the ecological environment in NWC (Zhang and Huisingh, 2018). This study found that the carbon to nitrogen ratio in NWC reached 13.6, which implies that the planting of mulberry trees in NWC had a certain effect on increasing the soil carbon sequestration capacity.
These findings also further prove that mulberry has a very important application value in controlling desertification, improving ecology and developing the economy in NWC (Qin et al., 2012). However, the soil nutrient base in the NWC is too poor, and the ability to retain water and fertilize is too weak. In the future, more organic fertilizers should be used to improve and enhance the soil fertility retention ability in order to steadily improve the carbon sequestration ability of the mulberry plantation soils.

5 Conclusions

The organic carbon content in the surface layer of mulberry plantation soil was higher than that in the subsurface, and was generally the highest in Southwest China and the lowest in Northwest China. The total nitrogen content in mulberry plantation soil was the highest in Central southern China and the lowest in Northwest China. The C/N ratios of mulberry plantation soil in Northwest and Southwest China were 12-13, while they were 8-10 in Central southern, East China and North China. The organic carbon and total nitrogen contents of the mulberry plantation soil were well coupled with the region and the soil depth. Moreover, there were different reasons for the formation of carbon and nitrogen coupling characteristics in different regions. In either the research on carbon pools of mulberry plantations or the innovation of green and low-carbon planting technology in mulberry plantations, the spatial differentiation characteristics of soil must be considered. The spatial differentiation of soil organic carbon can be used as the basic foundation for the planning and design of mulberry afforestation or ecological restoration projects.
[1]
Batjes H N. 1996. Total carbon and nitrogen in the soils of the world. European Journal of Soil Science, 65(1): 10-21.

DOI

[2]
Chai Q, Qin A Z, Gan Y T, et al. 2014. Higher yield and lower carbon emission by intercropping maize with rape, pea, and wheat in arid irrigation areas. Agronomy for Sustainable Development, 34(2): 535-543.

DOI

[3]
Cheng Z B, Chen Y, Zhang F H. 2018. Effect of reclamation of abandoned salinized farmland on soil bacterial communities in arid NWC. Science of the Total Environment, 187(1): 204-213.

[4]
Hungate B A, Dukes J S, Shaw M R, et al. 2003. Nitrogen and climate change. Science, 302(5650): 1512-1513.

PMID

[5]
Johnson J M, Franzluebbers A J, Weyers S L, et al. 2007. Agricultural opportunities to mitigate greenhouse gas emissions. Environmental Pollution, 150(1): 107-124.

PMID

[6]
Kar R, Vijay V, Trivedy K, et al. 2018. Comparative performance of farming practices in terms of carbon sequestration potential of mulberry and soil organic carbon stock. Journal of Soil Science and Environmental Management, 9(10): 147-153.

DOI

[7]
Lal R. 2014. Soil carbon sequestration impacts on global climate change and food security. Science, 304(5677): 1623-1627.

DOI

[8]
Li Y, Wang Y, He Q, et al. 2020. Calculation and evaluation of carbon footprint in mulberry production: A case of Haining in China. International Journal of Environmental Research and Public Health, 17(4): 1339-1355.

DOI

[9]
Liu W W, Zhang G, Wang X K, et al. 2018. Carbon footprint of main crop production in China: Magnitude, spatial-temporal pattern and attribution. Science of the Total Environment, 645: 1296-1308.

DOI

[10]
Mi Z F, Meng J, Guan D B, et al. 2017. Chinese CO2 emission flows have reversed since the global financial crisis. Nature Communications, 8(1): 1712. DOI: 10.1038/s41467-017-01820-w.

DOI

[11]
Neff J C, Townsend A R, Gleixner G, et al. 2002. Variable effects of nitrogen additions on the stability and turnover of soil carbon. Nature, 419(6910): 915-917.

DOI

[12]
Poeplau C, Don A. 2015. Carbon sequestration in agricultural soils via cultivation of cover crops—A meta-analysis. Agriculture, Ecosystems and Environment, 200: 33-41.

DOI

[13]
Qin J, He N J, Wang Y, et al. 2012. Ecological issues of mulberry and sustainable development. Journal of Resources and Ecology, 3(4): 330-339.

DOI

[14]
Rohela G K, Shukla P, Muttanna, et al. 2020. Mulberry (Morus spp.): An ideal plant for sustainable development. Trees, Forests and People, 2: 100011. DOI: 10.1016/j.tfp.2020.100011.

DOI

[15]
Saikawa E, Prinn R G, Dlugokencky E, et al. 2014. Global and regional emissions estimate for N2O. Atmospheric Chemistry and Physics, 14(9): 4617-4641.

[16]
Sarrantonio M. 2003. Soil response to surface-applied residues of varying carbon-nitrogen ratios. Biology and Fertility of Soils, 37(3): 175-183.

DOI

[17]
Scharlemann J P, Tanner E V, Hiederer R, et al. 2014. Global soil carbon: understanding and managing the largest terrestrial carbon pool. Carbon Managemet, 5(1): 81-91.

[18]
Schmidt M W, Torn M S, Abiven S, et al. 2011. Persistence of soil organic matter as an ecosystem property. Nature, 478(7367): 49-56.

DOI

[19]
Shangguang W, Dai Y J, Liu B Y, et al. 2013. A China data set of soil properties for land surface modeling. Journal of Advances in Modeling Earth Systems, 5(2): 212-224.

DOI

[20]
Shen Y Y, Zhang Z Q, Xue Y. 2021. Study on the new dynamics and driving factors of soil pH in the red soil, hilly region of South China. Environmental Monitoring and Assessment, 193(5): 304. DOI: 10.1007/s10661-021-09080-4.

[21]
Srivastava S, Kapoor R, Thathola A, et al. 2003. Mulberry (Morus alba) leaves as human food: A new dimension of sericulture. International Journal of Food Sciences and Nutrition, 54(6): 411-416.

PMID

[22]
Tao F L, Palosuo T, Vallkama E, et al. 2019. Cropland soils in China have a large potential for carbon sequestration based on literature survey. Soil & Tillage Research, 186: 70-78.

[23]
Tian H Q, Chen G S, Zhang C, et al. 2010. Pattern and variation of C:N:P ratios in China’s soils: A synthesis of observational data. Biogeochemistry, 98(1-3): 139-151.

DOI

[24]
Wang R, Wang Q Z, Yao S L. 2021. Evaluation and difference analysis of regional energy efficiency in China under the carbon neutrality targets: Insights from DEA and Theil models. Journal of Environmental Management, 293: 112958. DOI: 10.1016/j.jenvman.2021.112958.

DOI

[25]
Xu H. 2017. Change characteristics of carbon, nitrogen and phosphorus of soil profile in China’s typical cropland under long-term fertilization. Diss., Guiyang, China: Guizhou University. (in Chinese)

[26]
Yang Y T. 2019. Analysis of spatial distribution characteristics of soil organic matter in cultivated lands in NWC. Diss., Yangling, China: Northwest A&F University. (in Chinese)

[27]
Zhang Q F, Donaldson J A. 2008. The rise of Agrarian Capitalism with Chinese characteristics: Agricultural modernization, agribusiness and collective land rights. The China Journal, 60: 25-47.

DOI

[28]
Zhang W J, Xu M G, Wang B, et al. 2009. Soil organic carbon, total nitrogen and grain yields under long-term fertilizations in the upland red soil of southern China. Nutrient Cycling in Agroecosystems, 84(1): 59-69.

DOI

[29]
Zhang Z H, Huisingh D. 2018. Combating desertification in China: Monitoring, control, management and revegetation. Journal of Cleaner Production, 182(1): 765-775.

DOI

Outlines

/