
Journal of Resources and Ecology >
The Influence of Plantation on Soil Carbon and Nutrients: Focusing on Tibetan Artificial Forests
|
LIU Ruixuan, E-mail: liuruixuan@stu.scu.edu.cn |
Received date: 2021-08-20
Accepted date: 2022-02-20
Online published: 2023-01-31
Supported by
The Strategic Priority Research Program of the Chinese Academy of Sciences(XDA20020401)
The Second Tibetan Plateau Scientific Expedition and Research Program(2019QZKK0404)
The Fundamental Research Funds for the Central Universities(JY201912)
As terrestrial ecosystem carbon (C) sinks, plantation ecosystems play essential roles in species diversity protection, resource supply and climate change. Artificial afforestation is of great important in improving the ecological condition, economic development and production in Tibet. Forests can improve soil property changes, yet the understanding of how plantations influence soil C and nutrient conditions in Tibet is still insufficient. This review combines with previous studies to explore the characteristics of soil nutrients, involving nitrogen (N) and phosphorus (P) on Tibetan poplar plantations. Generally, plantations have better abilities in improving the soil C and N cycles, and enhancing the soil stability. In this review, we further analyze the factors, including the modality of land-use, afforested period, tree species, climate factors and soil properties, which may affect the soil C and nutrients. (1) The patterns of land-use affect the accumulation of soil organic matter, thus influence the accumulation of soil C and nutrients; (2) Soil C and N increase with the years of artificial forests, while soil P is on the contrary; (3) The effects of different tree species on soil C and nutrients vary widely; (4) In terms of climate, the C sink of Tibetan plantation soil is most likely to be affected by precipitation, while the nutrient is more likely to be influenced by temperature; (5) Among soil properties, the most related factor to C is soil texture. Furthermore, our review pointed out that future research on soil ecological functions should be focused on soil microbes on Tibet plantation. At the end, we concluded three major challenges for the future research. Therefore, this review contributes to a better understand the effects of plantation on soil C and nutrients on the Tibetan Plateau.
Key words: plantation; soil carbon; nutrient; the Tibetan Plateau
LIU Ruixuan , YAO Yuan , ZHANG Sheng . The Influence of Plantation on Soil Carbon and Nutrients: Focusing on Tibetan Artificial Forests[J]. Journal of Resources and Ecology, 2023 , 14(1) : 57 -66 . DOI: 10.5814/j.issn.1674-764x.2023.01.006
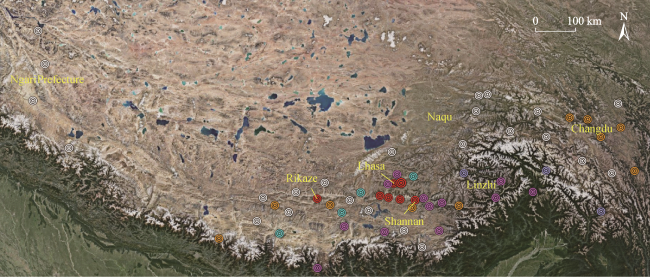
Fig. 1 The main districts and counties of plantations in TibetNote: The red, pink, yellow, blue and white areas represent areas with the highest, high, moderate, low and the lowest carbon density of plantations, respectively. The original data used here comes from the report of Liu and Zhang (2019). |
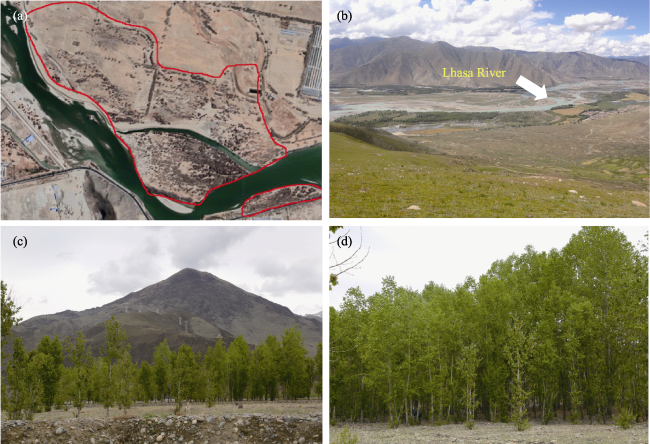
Fig. 2 The poplar plantations in the Lhasa River Basin.(a) shows the aerial image of plantation plot beside the Lhasa River Basin; (b) shows the Lhasa River Basin; (c) and (d) show the poplar plantations in Tibet |
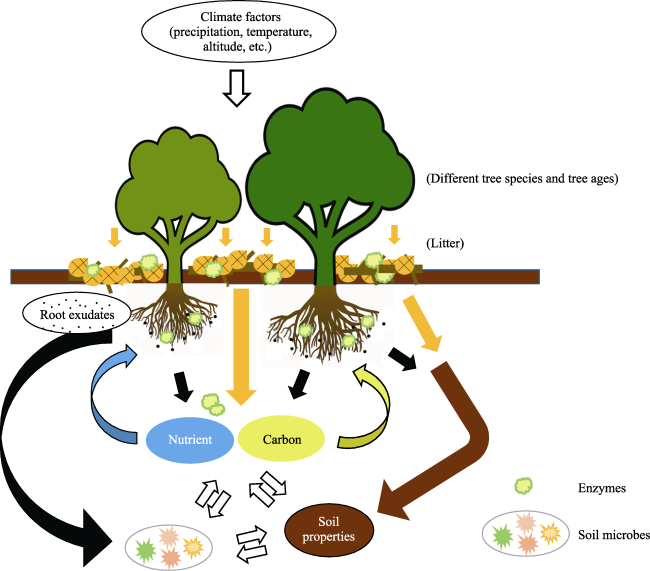
Fig. 3 The relationship between plantation and soil ecological systemNote: Plantation and soils can affect each other through the tree species, litters and soil microbes. |
Table 1 The average tree ages and evaluation indexes of five plantations’ zones |
| Types | Average ages of plantations (yr) | Proportion of artificial macrophanerophytes (%) | Proportion of artificial shrubs (%) | Average carbon density of plantations (t ha-1) |
|---|---|---|---|---|
| A | 13.01 | 2.26 | 0.13 | 21.23 |
| B | 11.79 | 0.31 | 0.02 | 14.43 |
| C | 9.90 | 0.27 | 0.02 | 10.73 |
| D | 7.90 | 0.33 | 0.29 | 6.38 |
| E | 6.29 | 0.07 | 0.01 | 3.76 |
Note: Five types based on the carbon density of plantations. The A, B, C, D and E represent areas with the highest, high, moderate, low and the lowest carbon density of plantations, respectively. Source: Liu and Zhang, 2019. |
| [1] |
|
| [2] |
|
| [3] |
|
| [4] |
|
| [5] |
|
| [6] |
|
| [7] |
|
| [8] |
|
| [9] |
|
| [10] |
|
| [11] |
|
| [12] |
|
| [13] |
|
| [14] |
|
| [15] |
|
| [16] |
|
| [17] |
|
| [18] |
|
| [19] |
|
| [20] |
|
| [21] |
|
| [22] |
|
| [23] |
|
| [24] |
Food and Agriculture Organization of the United Nations (FAO).2010. Global forest resources assessment 2010. Rome, Italy: FAO.
|
| [25] |
|
| [26] |
|
| [27] |
|
| [28] |
|
| [29] |
|
| [30] |
|
| [31] |
|
| [32] |
|
| [33] |
|
| [34] |
|
| [35] |
|
| [36] |
|
| [37] |
|
| [38] |
|
| [39] |
|
| [40] |
|
| [41] |
|
| [42] |
|
| [43] |
|
| [44] |
|
| [45] |
|
| [46] |
|
| [47] |
|
| [48] |
|
| [49] |
|
| [50] |
|
| [51] |
|
| [52] |
|
| [53] |
|
| [54] |
|
| [55] |
|
| [56] |
|
| [57] |
|
| [58] |
|
| [59] |
|
| [60] |
|
| [61] |
|
| [62] |
|
| [63] |
|
| [64] |
|
| [65] |
|
| [66] |
|
| [67] |
|
| [68] |
|
| [69] |
|
| [70] |
|
| [71] |
|
| [72] |
|
| [73] |
|
| [74] |
|
| [75] |
|
| [76] |
|
| [77] |
|
| [78] |
|
| [79] |
|
| [80] |
|
| [81] |
|
| [82] |
|
| [83] |
|
| [84] |
|
| [85] |
|
| [86] |
|
| [87] |
|
| [88] |
|
| [89] |
|
| [90] |
|
| [91] |
|
| [92] |
|
| [93] |
|
| [94] |
|
| [95] |
|
| [96] |
|
| [97] |
|
| [98] |
|
| [99] |
|
| [100] |
|
| [101] |
|
| [102] |
|
| [103] |
|
| [104] |
|
| [105] |
|
/
| 〈 |
|
〉 |