Resource Use and Resource Economy

Assessment of the Water Resources Carrying Capacity in the Great Dunhuang Region

  • LANG Tingting , 1, 2 ,
  • YANG Yanzhao , 1, 2, 3, * ,
  • ZHANG Chao 1, 2 ,
  • LIU Ying 1, 2
Expand
  • 1. Institute of Geographic Sciences and Natural Resources Research, Chinese Academy of Sciences, Beijing 100101, China
  • 2. University of Chinese Academy of Sciences, Beijing 100049, China
  • 3. Key Laboratory of Carrying Capacity Assessment for Resources and Environment, Ministry of Natural Resources, Beijing 101149, China
* YANG Yanzhao, E-mail:

LANG Tingting, E-mail:

Received date: 2021-05-26

  Accepted date: 2022-01-05

  Online published: 2022-10-12

Supported by

The Second Tibetan Plateau Scientific Expedition and Research(2019QZKK1006)

Abstract

Water resources carrying capacity (WRCC) is an important index for assessing the coordinated development relationship between population and water resources. The quantitative evaluation of WRCC can provide an important basis for water resource regulation and sustainable economic and social development. Based on the statistical data of cities and counties in the Great Dunhuang Region (GDR), and taking counties as the basic units, this study quantitatively analyzed the WRCC and carrying status of the GDR under different water inflow conditions and policy constraints from 2010 to 2017. The study revealed three main trends. (1) From 2010 to 2017, the WRCC of the GDR increased year by year, from 343700, 315900 and 291100 people to 458700, 415400 and 375600 people in normal, dry and extremely dry years, respectively. (2) Under policy constraints, the WRCC of the GDR increased year by year from 309400 people in 2010 to 412400 people in 2017. Based on future estimates, the WRCC of the GDR are expected to be 326600 people in 2020 and 341200 people in 2030. (3) From 2010 to 2017, the water resources carrying index of the GDR was decreasing, and it decreased from 1.05, 1.14 and 1.24 to 0.80, 0.88 and 0.97 in normal, dry and extremely dry years, respectively. The carrying status changed from critical overload to balanced. Although the WRCC and the carrying status of the GDR had significantly improved by 2017, the overall upper limit of the carrying capacity is not high. Therefore, efforts should be made to improve the utilization efficiency of water resources in order to maintain the sustainable utilization of water resources in the GDR.

Cite this article

LANG Tingting , YANG Yanzhao , ZHANG Chao , LIU Ying . Assessment of the Water Resources Carrying Capacity in the Great Dunhuang Region[J]. Journal of Resources and Ecology, 2022 , 13(6) : 999 -1008 . DOI: 10.5814/j.issn.1674-764x.2022.06.005

1 Introduction

Water resources are necessary for human survival. With the development of the economy and society and the increase in population, the contradiction between human beings and water resources is becoming increasingly serious. Many water problems have emerged, such as drought, water shortage, water environment pollution and the degradation of river and lake ecosystems (Zhang et al., 2013). Nowadays, to ensure the sustainable development of the economy and society, the carrying capacity of water resources for humans and society urgently needs to be clarified under the situation of less and limited water resources. As an important tool to calculate the population and an index to evaluate regional carrying status due to limitations of water resources, the water resources carrying capacity (WRCC) can help to clarify the current capability of water resources, and is of great significance to guide policies for the sustainable utilization of water resources (Cheng et al., 2020).
Carrying capacity mostly defines the limiting effects of natural resources or the environment on the development of the biological population. This concept was first used to characterize the maximum number of biological individuals under the influence of environmental factors (Hadwen and Palmer, 1922; Bavink and Hatfield, 1933). At present, carrying capacity research is widely used in various fields, including ecology (Pablo et al., 2004; Jiao et al., 2015), environmental science (Ning et al., 2014) and resource management (Feng et al., 2008; Xiong and Yang, 2014). The concept of resource carrying capacity has passed through different phases—from single, then multiple, to comprehensive resource carrying capacity (Zhu et al., 2002). As an important resource, the carrying capacity of water resources has gradually become a main content of resource carrying capacity research (Li et al., 2018).
As for the definition of WRCC, there is no unified understanding either at home or abroad, and there are two representative descriptions of WRCC in China. Shi and Qu (1992) believed that WRCC refers to the largest scale of agriculture, industry, city and population that can be carried by the water resources of a certain region in a certain stage of scientific and technological development without damaging the society or the ecosystem. Hui et al. (2001) hold that WRCC is the highest carrying capacity of water resources in a certain region under the natural and man-made mode, based on the predictable level of technology, economic and social development, the principle of sustainable development, and the condition of maintaining the benign development of the ecological environment, after a reasonable optimal allocation. Obviously, the latter description fully considers the effect of intervention by human activities on water resources and the water circulation system, and emphasizes the concept of dynamic development. When defining the concept of WRCC, it should be put under the framework of a sustainable development strategy, combined with the characteristics of water resources such as mobility and non-renewability. In addition, the coupling effect of the water resource system, natural ecosystem, socio-economic system, national policy and the coordinated social development mechanism should be also considered comprehensively (Liu et al., 2020; Wang et al., 2020). Based on the above analysis, the concept of WRCC adopted in this study can be described as follows: At the present stage and for a certain time in the foreseeable future, taking sustainable development as the premise, WRCC is the maximum population scale that can be supported by water resources in the region under a certain development level of the economy, society and technology (Liu et al., 2020).
The Great Dunhuang Region (GDR) is located in the western end of the Hexi Corridor. Relative to the whole country, its proportion of water resources is only 0.03% and the GDR is an extremely arid area (Liang and Lv, 2019). In recent years, although the water consumption has decreased to 0.87×10⁹ m3, the water resources are still in a severe situation. For example, there is no water sluiced in Shuangta reservoir of the Shule River in normal precipitation years, and there is water only in wet years. The shortage of water resources has become a bottleneck restricting the sustainable development of the regional economy and society. In order to coordinate the development of water resources and human beings, the WRCC in this region should be clarified precisely. To scientifically estimate the WRCC of the GDR, this paper takes counties as the basic units, and quantitatively calculates the WRCC of the GDR from 2010 to 2017 under different water supply and policy constraints. The water resources carrying indexes are also quantitatively evaluated to demonstrate the changes in the carrying status in this region.

2 Data and methods

2.1 Study area

The GDR is located at the westernmost end of the Hexi Corridor in Gansu Province, between 92°18′-100°13′E and 38°16′-42°41′N, and adjacent to Jiayuguan City in Gansu Province in the east, Xinjiang in the west and north, and Qinghai in the south. The GDR includes Dunhuang City (DH), Guazhou County (GZ), Subei Mongolian Autonomous County (SB) and Akesai Kazakh Autonomous County (AKS), with a total area of about 1.534×10⁵ km2. The GDR has a typical continental arid climate with windy seasons and a dry climate. It has limited precipitation and high evaporation, with annual average precipitation of 39.9-176 mm and annual average evaporation of 1228-2495 mm. The annual average temperature is 3.9-9.9 ℃.
The water resources in the GDR totaled 1.05×10⁹ m3 in 2020, including surface water resources of 1.03×10⁹ m3, and non-repeated underground water resources of 0.02×10⁹ m3. Relative to the proportion of total water resources, the water consumption accounted for 0.15% of the national level in 2020, with the water consumption amount being 0.87×10⁹ m3. The amounts of water utilization for agriculture, industry, life and ecology were 0.59×10⁹, 0.03×10⁹, 0.02×10⁹ and 0.23×10⁹ m3, respectively.
In terms of watershed and water system divisions, the GDR belongs to a sub watershed of the second level area of Gansu Hexi Corridor in the northwest inland river region (Fig. 1). The third level watershed includes the Shule River system, comprised of the Shule River mainstream, Danghe river system and other small rivers, and the Sugan Lake system. The Shule River system is the main water source for production and human needs in the GDR. Danghe River lies in a flat terrain and its water utilization is mainly for DH, SB and AKS. The water system of Sugan Lake is an independent inland lake in a wide alpine area.
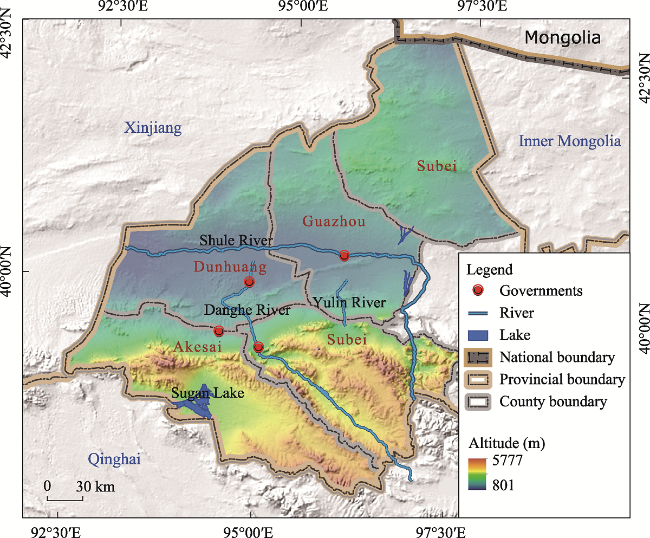
Fig. 1 The GDR location and water system distribution

2.2 Data resources

The data used in this study include the water resources data and social and economic data of the counties and cities in the GDR from 2010 to 2017.
The water resources data came from four main sources: 1) The Annual Report on Water Resources Management and Water Statistic Yearbook of DH, SB, AKS and GZ; 2) The related planning data included: The Plan for Rational Utilization and Ecological Protection of Water Resources in Dunhuang City (2011-2020), The Plan for the Society Construction of Water Saving in Dunhuang City, The Development, Utilization and Protection Plan of Water Resources in Subei County (2018-2025), Water and Soil Conservation Planning of Guazhou County (2017-2030) and The 13th Five-year Plan of Water Development of DH, SB, AKS and GZ; 3) The related reports included: The Current Situation Report of the Development and Utilization of Water Resources at County Level in Gansu Province, Water Resources Investigation and Evaluation Report of Subei County; 4) The material of water resources management and assessment included: Notice of the General Office of the State Council on Printing and Distributing Assessment Methods for Implementing the Strictest Water Resources Management System (GBF [2013] No.2), Notice of the General Office of Gansu Provincial People's Government on Printing and Distributing the Assessment Methods for the Strictest Water Resources Management System (GZBF [2014] No.121) and Notice of the General Office of Jiuquan Municipal People's Government on Printing and Distributing Assessment Methods for Implementing the Strictest Water Resources Management System (JZBF [2014] No.254). Social and economic data mainly came from the Statistical Yearbook of DH, SB, AKS and GZ.
The available water resources and water consumption red lines are important for WRCC research. There are three kinds of water supply conditions which determine the available water resources: Normal year (50% Guarantee rate), dry year (75% Guarantee rate) and extremely dry year (95% Guarantee rate). Three sample years (2015, 2020 and 2030) were chosen to set the water consumption red lines. According to the Notice of the General Office of the State Council on Printing and Distributing Assessment Methods for Implementing the Strictest Water Resources Management System (GBF [2013] No.2), The Notice of the General Office of Gansu Provincial People's Government on Printing and Distributing the Assessment Methods for the Strictest Water Resources Management System (GZBF [2014] No.121) and The Current Situation Report of the Development and Utilization of Water Resources at County Level in Gansu Province, the available water resources and red lines of water consumption of each county and city under different water supply conditions are shown in Table 1.
Table 1 The available water resources and water consumption red lines of each county and city under the different water supply conditions (Unit: 108 m3)
City/County Available water resources Red lines (limit) of water consumption
Normal years Dry years Extremely dry years 2015 2020 2030
ADS 0.3 0.3 0.3 0.2 0.2 0.2
SB 0.42 0.42 0.42 0.47 0.47 0.47
GZ 5.31 4.57 3.80 4.60 3.54 3.71
DH 3.81 3.54 3.34 3.54 2.75 2.89
The Great Dunhuang Region 9.84 8.83 7.86 8.81 6.96 7.27

2.3 Methods

2.3.1 General framework

In foreign studies, the main calculation methods for WRCC are grey compromise programming (GCP) and the adaptive ecological management model (AEM). In Chinese studies, there are three methods: empirical estimation method, index system method and complex system analysis method (Yuan et al., 2006). Based on the calculation methods of WRCC at home and abroad, and the characteristics of the GDR data, this paper employs the following calculation method. The available water resources were obtained and the water efficiency for life and production was calculated based on the total economy, industrial structure and available water resources under different water conditions. Next, the WRCC of the GDR were calculated using the available water resources and water efficiency. Then, the water resources carrying indexes were evaluated to assess the carrying status of the GDR based on WRCC and the current total population. The technical flowchart of the assessment is shown in Fig. 2.
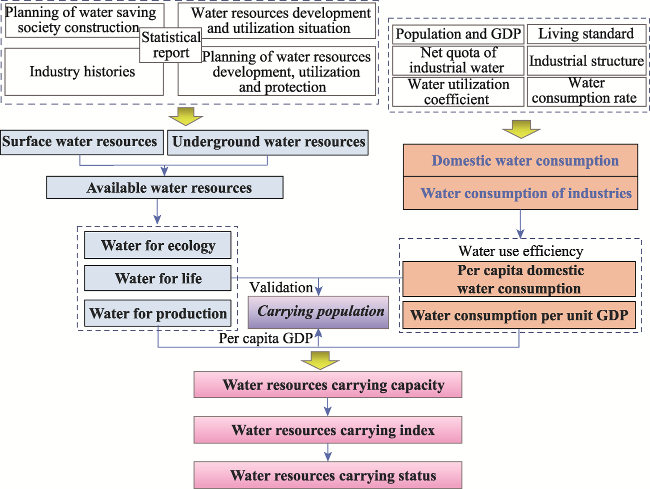
Fig. 2 Technical flowchart of the assessment

2.3.2 Calculation methods

(1) Water resources carrying capacity (WRCC)
The available water resources are mainly used for ecology, life and production. Therefore, after subtracting the ecological and domestic water from the available water resources, the water for production can be obtained. Next, in order to calculate the WRCC, the annual water use efficiency should be calculated first, including the per capita domestic water consumption and the per unit GDP water consumption. Note that we used water consumption per 10000 Yuan GDP as the measurement unit for the per unit GDP water consumption. At the same time, the coefficient of available water resources for production should be estimated consistently, and the last paragraph of this section explains the usage of this coefficient. Based on the available water resources for production, combined with the per unit GDP water consumption, the carrying GDP could be calculated. Finally, the carrying GDP and the per unit GDP were used to obtain the carrying population.
Per unit GDP water consumption is determined by total water consumption for production and GDP. The total water consumption for production is determined by the regional industrial structure, the water quota of industries, the water utilization coefficient and the water consumption rate. The calculation formulas of total water consumption for production and per unit GDP water consumption are as follows (Yuan, 2006):
${{W}_{c}}=\sum{\frac{{{E}_{t}}\times GDP\times {{p}_{t}}\times {{\sigma }_{t}}}{{{\mu }_{t}}}}$
${{U}_{c}}=\frac{{{W}_{c}}}{GDP}$
where, ${{W}_{c}}$ represents the total water consumption for production, ${{U}_{c}}$ represents the per unit GDP water consumption, t represents industries, ${{E}_{t}}$ represents the water quota of industries, ${{p}_{t}}$ represents the proportion of each industry in GDP, ${{\sigma }_{t}}$ represents the water consumption rate, and ${{\mu }_{t}}$ is the water utilization coefficient.
After the available water consumption for production is estimated, the validation can be implemented by the corresponding carrying population obtained from the available water resources for living. The estimated domestic water consumption population should not be greater than or substantially less than the production water consumption population. If the difference is too large, the coefficient of water for production should be adjusted again.
(2) Water resources carrying status
Using the water resources carrying index to assess the water resources carrying status (Feng et al., 2014): when WRCC < 1, the current population is less than the water resources carrying population, and the water resources carrying status is in surplus level; when WRCC = 1, the current population is equal to the carrying population, and the water resources carrying status is in balanced level; when WRCC > 1, the current population is greater than the water resources carrying population, and the water resources carrying status is in overloaded level. In order to quantitatively evaluate the water resources carrying status of the GDR, the classification standard was adopted from Feng et al. (2008) in a study of land resources carrying capacity in China. The carrying index is divided into six intervals, corresponding to rich and surplus, surplus, balanced, critical overload, overload and severe overload (Table 2).
$WCI={{P}_{a}}/{{P}_{w}}$
where, WCI represents water resources carrying index, Pa represents the current population, and Pw represents the water resources carrying population.
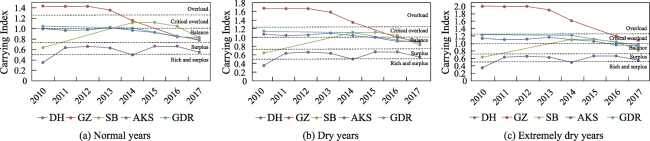
Table 2 The classification standard of water resources carrying index
Carrying status Surplus Balanced Overload
Rich and surplus Surplus Balanced Critical overload Overload Severe overload
Carrying index <0.5 0.5-0.75 0.75-1 1-1.25 1.25-1.5 >1.5

3 Results

3.1 Water use efficiency

Based on the annual population, total water consumption, domestic water consumption and the per 10000 Yuan GDP water consumption, the water use efficiency of each city and county was obtained (Fig. 3 and Table 3).
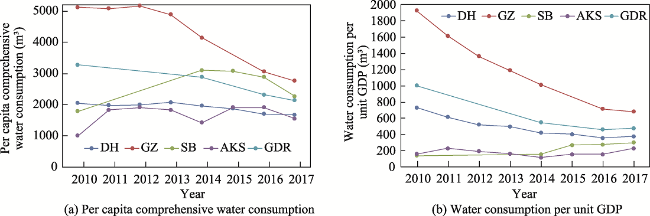
Fig. 3 The water use efficiency of the GDR during 2010-2017
Table 3 The water use efficiency of the GDR in 2017
City/ County Per capita
comprehensive water consumption (m3)
Per capita domestic water consumption (L d-1) Per 10000 Yuan GDP water consumption (m3)
AKS 1553 116 191
SB 2266 138 252
GZ 2760 141 570
DH 1669 124 315
GDR 2137 134 399
During 2010-2017, the trends of per capita comprehensive water consumption and the per 10000 Yuan GDP water consumption of each county and city in the GDR were nearly the same (Fig. 3). Specifically, the water consumption levels in DH, GZ and GDR were declining. The declining trends indicated that the water use efficiencies in DH, GZ and GDR were improving. The per unit water consumption of SB and AKS increased at first, and then decreased, but the water use efficiency was not improved overall. Specifically, the per capita comprehensive water consumption was 2137 m3, the per capita domestic water consumption was 134 L d-1, and the per 10000 Yuan GDP water consumption was 399 m3 in the GDR in 2017 (Table 3).

3.2 Water resources carrying capacity (WRCC)

3.2.1 WRCC under different water supply levels

Based on the different water use efficiency values, the WRCC of the GDR during 2010-2017 were evaluated (Fig. 4) and found to increase year by year with the improvement of water use efficiency since 2010. The carrying capacity under normal, dry and extremely dry years increased from 343700, 315900 and 291100 people to 458700, 415400 and 375600 people, respectively.
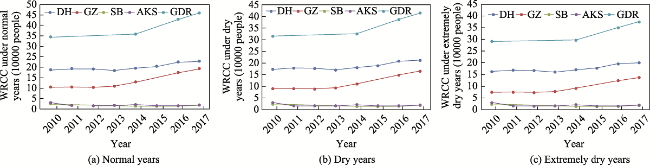
Fig. 4 The WRCC in different water supply conditions in each city and county during 2010-2017
As for the counties and cities in the GDR, the WRCC also increased year by year. Among them, the carrying capacity in DH increased from 186400, 173100 and 163400 people to 228200, 212100 and 200100 people in normal, dry and extremely dry years, respectively. The carrying capacity in GZ increased from 103800, 89200 and 74200 people to 192600, 165400 and 137600 people in normal, dry and extremely dry years, respectively. Since 2010, because the water use efficiency of AKS and SB increased at first and then decreased, the WRCC decreased at first and then increased. But in 2017, it did not return to the level of 2010. The WRCC in SB decreased from 23500 to 18600 people under the three different water supply conditions, and the WRCC in AKS similarly decreased from 30000 to 19300 people. Under the three water supply conditions in each year the WRCC of AKS and SB were nearly the same because of the low utilization and the same available water resources.
The WRCC of counties and cities of the GDR in 2017, and its comparison with the current situation, are shown in Table 4. Under normal, dry and extremely dry years, the available water resources were 9.84×10⁸, 8.83×10⁸ and 7.86×10⁸ m3, respectively. The corresponding WRCC in the GDR were 458700, 415400 and 375600 people in normal, dry and extremely dry years, respectively. So, with the decrease in available water resources, the WRCC in the GDR also decreased.
Table 4 The WRCC under different water supply levels in each city and county in 2017 (Unit: 104 people)
City/ County Current population Normal years Dry years Extremely dry years
AKS 1.06 1.93 1.93 1.93
SB 1.53 1.86 1.86 1.86
GZ 14.96 19.26 16.54 13.76
DH 19.03 22.82 21.21 20.01
Total 36.58 45.87 41.54 37.56
From Table 4, the WRCC were above the current population level, but the WRCC of each county was different. The WRCC in SB was the lowest at 18600 people. The WRCC in DH was the highest at 228200 people, followed by GZ and AKS, with carrying populations of 192600 and 19300 people, respectively. Due to the same available water resources of AKS and SB under different water supply conditions, the WRCC remained unchanged, and both of these two were higher than the current population. The WRCC of the other two counties increased with the increasing available water resources under different water supply conditions. The WRCC of the GZ and DH were 10 to 20 times larger than AKS and SB due to the better economic development and larger populations. Correspondingly, there was much greater water consumption in GZ and DH than in AKS and SB. To maintain social development, the water resources consumed in GZ and DH mainly came from external supplies because the internal available water resources were ten times less than those in AKS and SB, and unable to support life.

3.2.2 WRCC under different policy constraints

In order to clarify the WRCC of the GDR under policy constraints, this study included a quantitative analysis of the WRCC constrained by the total water consumption red lines in different years. The red line data of total water consumption in 2015 was regarded as the available water resources under the policy constraints in 2017, while the red line data of total water consumption in 2020 and 2030 were regarded as that of the planning years. To calculate WRCC, the water use efficiency data in 2017 was used for 2017, 2020 and 2030, respectively.
The results of WRCC under policy constraints showed that the carrying population levels in the GDR were 412400 people in 2017, 326600 in 2020 and 341200 in 2030 (Table 5). To assess the effect of policy red lines, the existing number of people in 2017 is shown in the “Current population” column. Under this water use efficiency condition, only AKS and SB have the ability to support the current population in the planning years, while GZ, DH and GDR do not have the ability to support the current population. Compared with different water supply conditions, the WRCC under policy constraints were lower. According to the above analysis, the effect of policy constraints was very obvious.
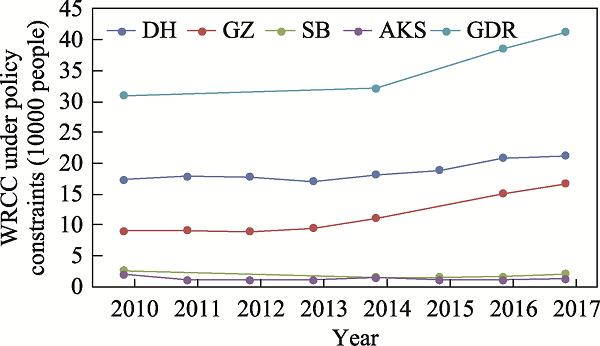
Table 5 The WRCC under policy constraints in 2017, 2020 and 2030 (Unit: 104 people)
City/County Current population WRCC
2017 2020 2030
AKS 1.06 1.29 1.29 1.29
SB 1.53 2.07 2.07 2.07
GZ 14.96 16.67 12.83 13.44
DH 19.03 21.21 16.47 17.31
GDR 36.58 41.24 32.66 34.12
Taking the red line data of total water consumption in 2015 as the available water resources, and based on the water use efficiency of each year from 2010 to 2017, the WRCC under the policy constraints were obtained (Fig. 5).
Fig. 5 The WRCC under policy constraints in each city and county during 2010-2017
The results showed that with the improvement of water use efficiency, the carrying population of the GDR for each city and county increased. Specifically, the WRCC in the GDR increased from 309400 people in 2010 to 412400 people in 2017. The results were lower than in the normal and dry years, and only slightly higher than in the extremely dry year.

3.3 Water resources carrying status

3.3.1 Water resources carrying status in 2010-2017

According to the calculation of the population of each county and city in 2010-2017, the water resources carrying indexes of the GDR and each county and city in 2010- 2017 under different water supply conditions were obtained (Fig. 6).
Fig. 6 The water resources carrying status in each city and county during 2010-2017
During 2010-2017, the carrying index of water resources of the GDR decreased continuously under different water supply conditions. The carrying index in the normal, dry and extremely dry years decreased from 1.05, 1.14 and 1.24 to 0.80, 0.88 and 0.97, respectively. The relationship between population and water resources changed from critical overload to balanced.
As for the city and county level, the water resources carrying index of DH and GZ declined. The carrying index of DH decreased from 1.00, 1.07 and 1.14 to 0.83, 0.90 and 0.95 in normal, dry and extremely dry years, respectively. Therefore, the water resources carrying status of DH changed from critical overload to balanced. The carrying index of GZ decreased from 1.43, 1.66 and 2.66 to 0.78, 0.90 and 1.08 in normal, dry and extremely dry years, respectively. Thus, the water resources carrying status of GZ changed from overload to balanced or critical overload. The water resources carrying indexes of SB and AKS first increased and then decreased, in which SB was at the surplus level in 2010, then reached critical overload in 2014-2016, and finally recovered to balanced status in 2017. Although the AKS water resources carrying index increased, the overall carrying status between population and water resources remained in surplus.

3.3.2 Water resources carrying status in 2017

Under the restriction of available water resources and taking the current population in the GDR in 2017 as a reference, the water resources carrying index in 2017 under the three kinds of water supply conditions were 0.80, 0.88 and 0.97, respectively. According to the classification standard (Table 2), the carrying status of the GDR was in balanced status under the three water supply conditions. On the whole, the relationship between population and water resources was basically in a balanced status, but the space of future carrying capacity is limited.
In 2017, under the conditions of normal, dry and extremely dry years, none of the counties and cities were overloaded (Fig. 7). Among them, AKS was in surplus status, while SB and DH were in balanced status. GZ was in balanced status in the normal and dry year, but in critical overload status in the extremely dry year. The relationship between population and water resources in AKS was relatively good in general, but in SB, DH and GZ that relationship tended to be tense. It should be pointed out that the cardinal number for the population of the GDR gives the lower carrying index and provides some space for improving the WRCC in the GDR to some extent.
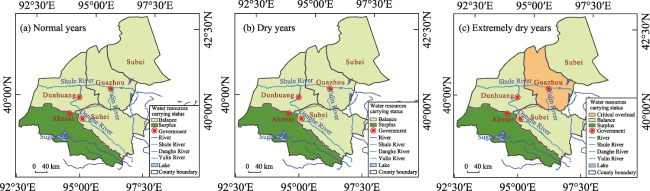
Fig. 7 The water resources carrying status in each city and county in 2017

4 Discussion

The WRCC of the GDR significantly improved from 2010 to 2017, but the upper limit of carrying capacity is not very high. Meanwhile, the GDR is a typical water shortage region, so the needless consumption and utilization of water resources should be forbidden in the GDR. The water resources carrying status also improved from 2010 to 2017. These two kinds of increasing trends are related to the implementation of water saving, the reformation of industrial structure and the significant improvement of water resource utilization efficiency in the GDR in recent years. However, in general, the current water resources carrying status in the GDR, especially in DH and GZ, are at nearly critical overload or critical overload levels, which can be regarded as a warning sign. Due to this warning sign and the lack of water resources in this region, the utilization efficiency of water resources should still be improved, and the allocation of water resources should be further optimized to ensure sustainable development in the future.
Under policy constraints, the WRCC presents a decreasing trend in the future given the limitations of available water resources. The decreasing WRCC seems to have little ability to hold people with the improvement of the population in the future. The worse outcome was based on the assumption that the water use efficiency is always unchanging. However, the water use efficiency will continue to improve with the development of technology and the corresponding WRCC will be ameliorated. According to the analysis, to improve the accuracy of the assessment, the next urgent step is to calculate the water use efficiency in the future scenario. In addition, departments related to water resource management are required to formulate water quotas for each industry and industries can draw on the experiences of developed countries to reduce the water consumption in their production process.
There have been many theories and methods related to the research of WRCC. In this study, the calculation method performed reasonably and was simply constructed, and has significant reference for the evaluation of WRCC in the GDR. One shortcoming is that there are few indicators of ecological water demand. According to the research of Jia et al. (2004), the water for ecology includes natural ecology and artificial ecology, and only the latter are defined as part of water utilization. However, there is no exact demarcation of water consumption between natural and artificial uses in the available statistics and policies. So, one of the research directions for WRCC assessment in the future is to divide the water consumption for ecology into natural water and artificial water, and then take artificial ecological water demand into account.

5 Conclusions

Based on the calculation methods of WRCC and relevant data about the GDR, this paper assessed the WRCC of the GDR under different water supply and policy constraints. The results showed three major trends from 2010 to 2017.
(1) Under different water supply conditions, the WRCC of the GDR increased year by year from 2010 to 2017, and the carrying capacity increased from 343700, 315900 and 291100 people to 458700, 415400 and 375600 people in normal, dry and extremely dry years, respectively. As for counties and cities, the WRCC in DH and GZ increased year by year, while those of AKS and SB first decreased and then increased. However, the WRCC in 2017 were still lower than in 2010 in AKS and SB.
(2) Under the policy constraints, the WRCC of the GDR increased from 309400 in 2010 to 412400 in 2017. Compared with different water supply conditions, the populations obtained were lower than in normal and dry years, and only slightly higher than in extremely dry years. In 2020 and 2030, 326600 and 341200 people can be carried, respectively, both of which are less than the current population in 2017, and significantly less than the carrying population under the available water resources in 2017.
(3) Under different water supply conditions, the water resources carrying index of the GDR continued to decrease from 2010 to 2017, and the carrying index decreased from 1.05, 1.14 and 1.24 to 0.80, 0.88 and 0.97 in normal, dry and extremely dry years, respectively. The relationship between population and water resources changed from critical overload to balanced. As for all cities and counties, the water resources carrying indexes of DH and GZ showed downward trends. The water resources carrying status of DH changed from critical overload to balanced. The water resources carrying status of GZ changed from overload to balanced or critical overload. The water resources carrying status of SB experienced critical overload and then reached a balanced status. The carrying status of AKS was improving year by year, and remained in surplus.
The WRCC and carrying status of the GDR improved from 2010 to 2017 under the improvement of water utilization efficiency. However, the policies on available water resources will constrain the carrying capacity if the water utilization efficiency cannot be improved. Water utilization efficiency was mainly decided by per capita domestic water consumption and per 10000 Yuan GDP, and both of those are related to production technologies and people's consciousness regarding water consumption. Thus, enhancing the scientific technologies and water saving consciousness are the most efficacious ways to improve the WRCC in the GDR.
[1]
Bavink B, Hatfield H S. 1933. The anatomy of modern science: An introduction to the scientific philosophy of to-day. Nature, 131(3316): 707-708.

DOI

[2]
Cheng Q P, Zhong F L, Zuo X A, et al. 2020. Evaluation of water resources carrying capacity of Heihe River Basin combining beautiful China with SDGs. Journal of Desert Research, 40(1): 204-214. (in Chinese)

[3]
Feng Z M, Yang Y Z, You Z. 2014. Research on the water resources restriction on population distribution in China. Journal of Natural Resources, 29(10): 1637-1648. (in Chinese)

[4]
Feng Z M, Yang Y Z, Zhang J. 2008. The land carrying capacity of China based on man-grain relationship. Journal of Natural Resources, 23(5): 865-875. (in Chinese)

[5]
Hadwen S, Palmer L J. 1922. Reindeer in Alaska. Washington DC, USA:U.S. Department of Agriculture Bulletin: 1-70.

[6]
Hui Y H, Jiang X H, Huang Q, et al. 2001. On system dynamic simulation model of water resources bearing capacity in duality mode. Geographical Research, 20(2): 191-198. (in Chinese)

DOI

[7]
Jia S F, Zhou C Q, Yan H Y, et al. 2004. Estimation of usable water resources and carrying capacity in Northwest China. Advances in Water Science, 15(6): 801-807. (in Chinese)

[8]
Jiao W J, Min Q W, Li W H, et al. 2015. Measuring water ecological carrying capacity with the ecosystem-service-based ecological footprint (ESEF) method: Theory, models and application. Chinese Journal of Applied Ecology, 26(4): 1041-1048. (in Chinese)

[9]
Li Y, Yang Y Z, Yan H M, et al. 2018. Research methods of water resources carrying capacity: Progress and prospects. Journal of Resources and Ecology, 9(5): 455-460.

DOI

[10]
Liang Y Y, Lv A F. 2019. Risk assessment of water resource security in China. Resources Science, 41(4): 775-789. (in Chinese)

DOI

[11]
Liu Y J, Dai L, Zhang J, et al. 2020. Research on monitoring resource carrying capacity: Taking Three-Rivers Region in Tibet as an example. Journal of Natural Resources, 35(7): 1699-1713. (in Chinese)

DOI

[12]
Ning J, Liu J Y, Shao Q Q, et al. 2014. Multiply scenario simulations of environmental carrying capacity in the western region of China. China Population, Resources and Environment, 24(11): 136-146. (in Chinese)

[13]
Pablo D M, Brook B W, Zetina-Rejón M J, et al. 2004. The carrying capacity of ecosytems. Global Ecology and Biogeography, 13(6): 485-495.

DOI

[14]
Shi Y F, Qu Y G. 1992. Water resources carrying capacity and its rational utilization in Urumqi River Basin. Beijing, China: Science Press: 1-220. (in Chinese)

[15]
Wang P L, Song X Y, Xu B X, et al. 2020. Evaluation and advancement of water resources carrying capacity of Zhangye Prefecture in Heihe River Basin. Journal of Glaciology and Geocryology, 42(3): 1057-1066. (in Chinese)

DOI

[16]
Xiong Y, Yang X B. 2014. Research on the carrying capacity of resources space of city-mountain resorts: A case study of Yuelu Mountain. China Population, Resources and Environment, 24(3): 301-304. (in Chinese)

[17]
Yuan Y, Gan H, Wang Z J, et al. 2006. Discussion on progress and development trend of the research on water resources carrying capacity. Journal of China Institute of Water Resources and Hydropower Research, 4(1): 62-67. (in Chinese)

[18]
Yuan Y. 2006. Study on methodology of assessment for water resources carrying capacity in different zones. Diss., Beijing, China: China Institute of Water Resources and Hydropower. (in Chinese)

[19]
Zhang J Y, He R M, Qi J, et al. 2013. A new perspective on water issues in North China. Advances in Water Science, 24(3): 303-310. (in Chinese)

[20]
Zhu Y X, Xia J, Tan G. 2002. A primary study on the theories and process of water resources carrying capacity. Progress in Geography, 21(2): 180-188. (in Chinese)

DOI

Outlines

/