
Journal of Resources and Ecology >
Ecosystem Service Value Evolution and Security Pattern Optimization in Huaihai Economic Zone
|
CAO Yuhong, E-mail: caoyuhong923914@qq.com |
Received date: 2021-12-20
Accepted date: 2022-03-10
Online published: 2022-10-12
Supported by
The National Natural Science Foundation of China(41971175)
The ecological and environmental effects caused by land use change have attracted global attention. Huaihai Economic Zone, as the core of the Huaihe River ecological economic belt, has experienced a reciprocal evolution of land use, ecological security and regional economic development. Based on multi-stage land use data extracted by Google Earth Engine (GEE), the spatio-temporal differentiation characteristics of ecosystem service value (ESV) evolution in Huaihai Economic Zone from 1998 to 2018 were analyzed with the help of ESV assessment and a minimum accumulated resistance model (MCR), and the regional ecological security pattern (ESP) was optimized. The results show that ESV intensity has obvious spatial differentiation, which is higher in northeastern China and lower in southwestern China. The median ESV area accounted for the largest proportion, while the high and low ESV areas accounted for a small proportion. The characteristics of EVS temporal and spatial differentiation show decreasing and increasing grades. From the perspective of development period, the ESV grade changes show a positive trend. In the optimization of the ecological security pattern, 26 important ecological sources, 22 main landscape ecological corridors, and 65 ecological strategic nodes were optimized and identified, and the middle-level ecological security zone accounted for the largest proportion. The main reasons for the changes in the ESV and ESP are closely related to the changes in local natural resources and the changes and adjustments in government protection policies. These research results can provide a reference for inter-provincial territorial space protection and the formulation of a sustainable development strategy.
CAO Yuhong , CAO Yuandan , CHEN Zhiyu , YU Dailiang . Ecosystem Service Value Evolution and Security Pattern Optimization in Huaihai Economic Zone[J]. Journal of Resources and Ecology, 2022 , 13(6) : 977 -985 . DOI: 10.5814/j.issn.1674-764x.2022.06.003
Table 1 Testing the accuracy of land use type data for the study area |
| Year | Sample | Training set | Test set | Kappa | Overall accuracy (%) |
|---|---|---|---|---|---|
| 1998 | 582 | 75562 | 115275 | 0.89 | 92.62 |
| 2008 | 596 | 72698 | 91276 | 0.88 | 91.81 |
| 2018 | 636 | 39266 | 34076 | 0.83 | 87.88 |
Table 2 Research model formula |
| Model name | Model formula | Meaning of variables |
|---|---|---|
| Ecosystem Services Value | $ESV=\underset{i=1}{\overset{n}{\mathop \sum }}\,\left( {{A}_{i}}\times V{{C}_{i}} \right)$ (1) | ESV: ecosystem service value, yuan; i: land-use type; Ai: area of class ‘i' land use type, ha; VCi: ecosystem service value per unit area of type i land use type, yuan ha‒1 |
| $V{{C}_{i}}=\underset{j=1}{\overset{k}{\mathop \sum }}\,\left( E{{C}_{ij}}\times {{E}_{a}} \right)$ (2) | j: type of ecosystem services; ECij: value equivalent of item j of ecosystem services of the i-th land use type; Ea: ecosystem economic value per unit, yuan ha‒1 | |
| ${{E}_{a}}=\frac{1}{7}\underset{r=1}{\overset{n}{\mathop \sum }}\,\frac{{{m}_{r}}{{p}_{r}}{{q}_{r}}}{M}$ (3) | r: type of food crops; mr: national average price of the r type of food crops, yuan kg‒1; pr: yield per unit area of the r-type grain, kg ha‒1; qr: sown area of the r-type grain crop, ha; M: sown area of grain crops, ha | |
| Ecosystem Service Value Intensity | ${{E}_{k}}=\underset{i=1}{\overset{n}{\mathop \sum }}\,\left( \frac{{{A}_{ki}}}{{{A}_{k}}}\times V{{C}_{i}} \right)$ (4) | Ek: intensity of ecosystem service value of the k-th grid; Aki: area of the i-th land use type of the k-th grid, ha; Ak: area of the k-th grid, ha |
| Minimum Cumulative Resistance | $MCR={{f}_{\text{min}}}\underset{i=1}{\overset{m}{\mathop \sum }}\,\underset{j=1}{\overset{n}{\mathop \sum }}\,\left( {{D}_{ij}}\times {{R}_{i}} \right)$ (5) | MCR: minimum cumulative resistance value; f: positive correlation between minimum cumulative resistance and ecological process; min: the evaluated plaques were evaluated with minimum cumulative resistance to different sources; Dij: distance from source ‘j' to land unit ‘i'; Ri: drag coefficient |
| Minimum Cumulative Resistance difference | $MC{{R}_{d}}=MC{{R}_{s}}-MC{{R}_{c}}$ (6) | MCRd: minimum cumulative resistance difference between ecological and urban land expansion; MCRs: minimum cumulative resistance value of ecological land expansion; MCRc: minimum cumulative resistance value of urban land expansion |
Table 3 Classification of different ESV grades |
| Classification | The lower ESV | Low ESV | Middle ESV | High ESV | The higher ESV |
|---|---|---|---|---|---|
| Scope (yuan km‒2) | Ek < 994200 | 994200 ≤ Ek < 1121600 | 1121600≤ Ek < 1946700 | 1946700 ≤ Ek < 2891700 | Ek ≥ 2891700 |
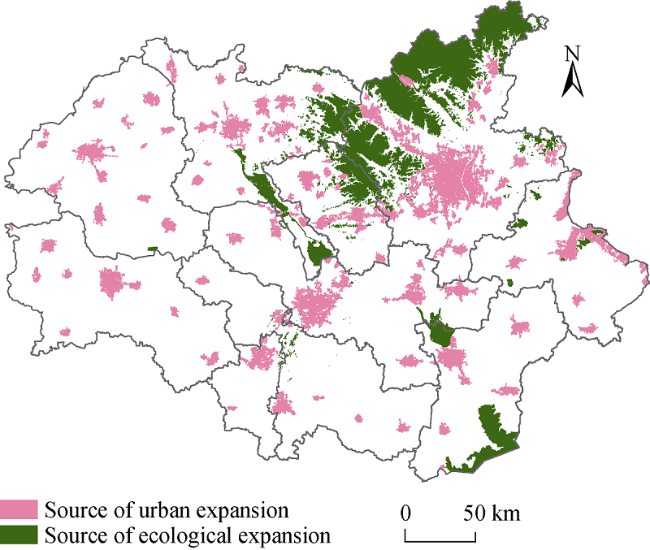
Fig. 1 Distribution of ecological protection sources and urban expansion sources |
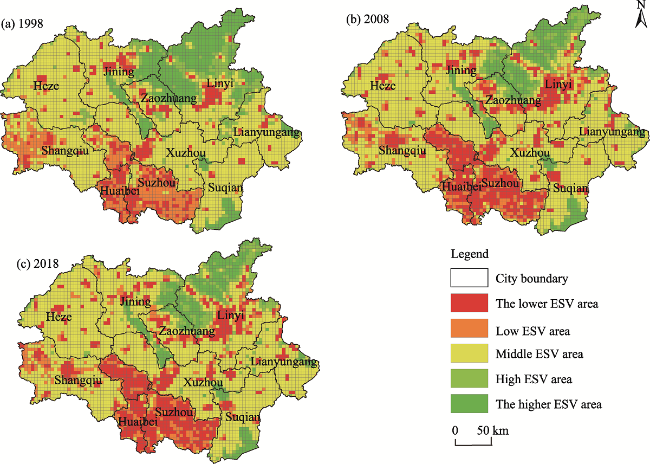
Fig. 2 Distribution of ecosystem service value grades in Huaihai Economic Zone from 1998 to 2018 |
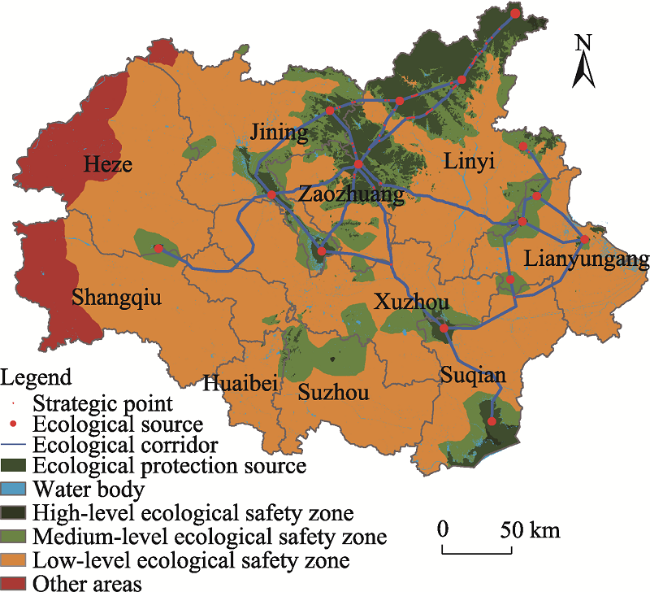
Fig. 3 Landscape ecological security regulation pattern |
| [1] |
|
| [2] |
|
| [3] |
|
| [4] |
|
| [5] |
|
| [6] |
|
| [7] |
|
| [8] |
|
| [9] |
|
| [10] |
|
| [11] |
|
| [12] |
|
| [13] |
|
| [14] |
|
| [15] |
|
| [16] |
|
| [17] |
|
| [18] |
|
| [19] |
|
| [20] |
|
| [21] |
|
| [22] |
|
| [23] |
|
| [24] |
|
| [25] |
|
| [26] |
|
| [27] |
|
| [28] |
|
| [29] |
|
| [30] |
|
| [31] |
|
| [32] |
|
| [33] |
|
| [34] |
|
| [35] |
|
| [36] |
|
| [37] |
|
| [38] |
|
| [39] |
|
/
| 〈 |
|
〉 |