Animal Ecology

The Spatio-temporal Patterns of Macro Benthos Functional Groups and the Associated Factors Affecting Them after Wetland Restoration

  • WANG Maoqiu , 1 ,
  • HU Yang 1 ,
  • HE Ning 1 ,
  • WU Mingxuan 1 ,
  • WU Pengling 1 ,
  • WANG Qinyi 1 ,
  • ZHANG Bolun 1 ,
  • ZHANG Shengle 1 ,
  • GAO Meihua 1 ,
  • FANG Shubo , 1, 2, *
Expand
  • 1. College of Marine Ecology and Environment, Shanghai Ocean University, Shanghai 201306, China
  • 2. Research Center of Water Environment & Ecological Engineering, Shanghai Ocean University, Shanghai 201306, China
* FANG Shubo, E-mail:

WANG Maoqiu, E-mail:

Received date: 2021-10-08

  Accepted date: 2022-03-20

  Online published: 2022-10-12

Supported by

The National Key Research and Development Program of China(2017YFC0506002)

The Foundation of Shanghai Marine Environmental Monitoring Center(MEMRT202003)

Abstract

This study examines how the spatiotemporal patterns of functional groups of macro benthos responded to coastal wetland restoration projects. Compared with the traditional single-species approach, methods for identifying functional groups of macro benthos more comprehensively reflect the states of the wetland, i.e., spatiotemporal patterns and the related influencing factors. In this study, the macro benthos samples, soil samples, and plant samples were collected at each same sample site in April, July, and October of 2017 and January of 2018. After classification of the macro benthos functional groups according to some traits, the factors influencing the functional groups were examined by a linear stepwise regression. The results showed that all macro benthos were classified into 11 different functional groups based on their traits of forms of locomotion, feeding habits, and food gathering methods. The semi-mobile suspensivores (FDX), semi-mobile surface detritivores (SDX), and Jawed mobile carnivores (CMJ) were the main groups observed in a year. Regression analysis showed that particle size, moisture content, and plant height were important common factors influencing most groups. The main influencing factor of FDX was particle size (P=0.020). Moisture content (P=0.004), plant cover degree (P=0.008), and particle size (P=0.032) comprised the main restrictions of SDX in summer. Soil salinity (P=0.040) and plant height (P=0.011) were the factors influencing CMJ in autumn and winter. This study shows the changing characteristics of macro benthos functional groups to promote coastal wetland restoration and future biogeomorphological studies.

Cite this article

WANG Maoqiu , HU Yang , HE Ning , WU Mingxuan , WU Pengling , WANG Qinyi , ZHANG Bolun , ZHANG Shengle , GAO Meihua , FANG Shubo . The Spatio-temporal Patterns of Macro Benthos Functional Groups and the Associated Factors Affecting Them after Wetland Restoration[J]. Journal of Resources and Ecology, 2022 , 13(6) : 1152 -1164 . DOI: 10.5814/j.issn.1674-764x.2022.06.019

1 Introduction

The research on macro benthos has aroused world attention for many years (Shi et al., 2015). The spatiotemporal patterns of macro benthos have long been used as ecological indicators of various environmental impacts (Jiang et al., 2019). Some researchers have used the macro benthos species composition to reveal the status of wetlands after resto-ration. For example, Sheng et al. (2007) used the species approach to study the restoration effect on benthos of the ecological environment in the Yangtze River estuary. Macro benthos can also be used to show wetland diversity classification or the heterogeneity of wetlands (Bell et al., 1978). Single species loss is typically used to show the responses of ecosystem functions. The recent development of bioge-
omorphology theory has shown that animals not only grow under environmental influences, but also have the ability to intuitively change the environment (Butler and Sawyer, 2012). For example, crabs buried or burrowing in sediments disturb the buds of plants, which then influences the wetland succession (Nickerson et al., 2019; Qiu et al., 2021), and the excretions of the clams could promote the deposition of sediments (Zhang et al., 2016).
Compared with traditional methods of species classification, more research has focused on the functional approach in studying the impacts on the wetland functions. Functional groups are defined as sets of species showing similar responses to the environment and effects on major ecosystem processes (Liu et al., 2019). Different methods have been applied to classify macro benthos into different functional groups. For example, Bremner et al. (2006) used biological trait analysis to describe the functional group classification. Benjamin et al. (2013) used a functional feeding group scheme to show the differences in functioning organisms and ecosystems. Gascon et al. (2008) used functional groups to analyze the life strategies and habitat traits of macro benthos, and determined the different patterns in the extents of functional groups in the pond system. Functional group-oriented methods can be used to reflect the effects of environmental impacts and consequent biological responses. The diversity of functional groups can also reveal the system status (Cardinale et al., 2006). However, further study is needed to develop the system for classifying macro benthos species into different functional groups.
Factors associated with the spatiotemporal patterns of macro benthos are multiplicative (Su et al., 2019), and various biotic and abiotic factors always interact together to shape the patterns of macro benthos functional groups. However, quantitative approaches for studying the functional groups of macro benthos and associated factors affecting them are still not sufficient. There is in an urgent need to discover better ways to classify the macro benthos into different functional groups and quantitative methods to determine the relationships of influencing factors and functional groups. The aim of this study was to use the quantitative multi-factors method to reveal the macro benthos spatiotemporal patterns from the perspective of functional groups, and to clarify the effects of restoration projects on the dynamics of coastal wetlands.

2 Material and methods

2.1 Study area

The Nanhui Dongtan coasts (from 30°51′27″N to 30°52′10″N, 121°55′06″E to 121°56′42″E) are located in the south bank of the Yangtze estuary, between Hangzhou Bay and Chongming Dongtan. Yangtze Estuary is the largest estuary in China (Xu et al., 2016). The large scale of coastal wetland reclamation has been proven to negatively affect the benthic fauna communities on the Nanhui coasts (Ma et al., 2011). Scirpus mariqueter is the pioneer and ecological engineering plant on the Nanhui coasts (Balke et al., 2012; Chen et al., 2020), and has been selected as the vegetation in the coastal restoration project.

2.2 Research flow chart of this study

The conceptual flow of this paper is shown in Fig. 1. Based on the consideration of the scientific question, a Biogeomorphological Index (BI) was designed, which was defined as the joint quantitative effects of vegetation and hydrological forces. Then the BI and influencing factors were used to reveal the patterns and characteristics of macro benthos functional groups.
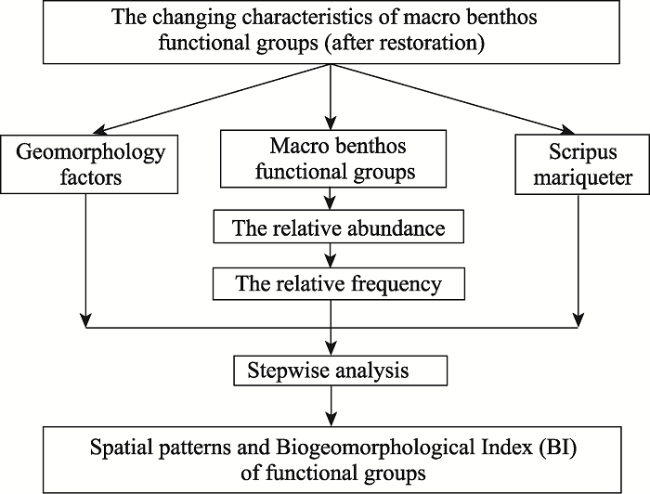
Fig. 1 Research flowchart

2.3 Vegetation field sampling

Scirpus mariqueter germinates in April, grows fast until July, matures in October, and then seeds (Shun et al., 2001). Using a global positioning system, the locations of the sampling points were determined. A total of 12 sampling sites, i.e., S1 to S12, were selected during the research period (Fig. 2). The sampling sites of S1 and S11 contained few S. mariqueter, while S3 and S8 were bare. Vegetation samples were taken in April, July, and October of 2017, as well as January of 2018.
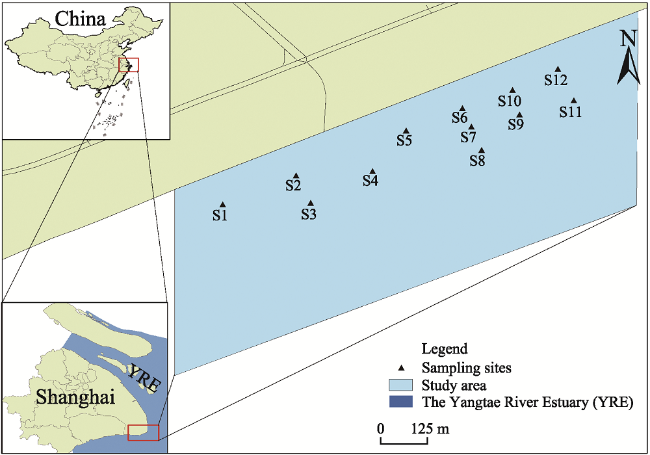
Fig. 2 Study area and sampling sites
The variables of plant density, plant coverage degree, and plant height were recorded to show the traits of S. mariqueter. Plant density and plant height were calculated as the total number and mean height of the plants in 1 m×1 m plots, respectively. Three 1 m2 quadrats were randomly placed at each sampling site. The plant density of S. mariqueter in the sampling area was calculated based on the mean density of the three quadrats. The plant height of S. mariqueter was the average height of the plants in the three quadrats.

2.4 Soil sampling

Soil samples were taken at the same time from the same sampling sites as the vegetation samples. Three soil sample replicates of 25 cm×25 cm with 20 cm depth were obtained from plots of 1 m×1 m. The soil was placed into zip-lock bags and brought back to the laboratory for further processing and analysis.

2.5 Macro benthos sampling

The macro benthos samples were taken at the same time and within the same sampling sites as the vegetation and soil samples. Macro benthos were sampled to a 20 cm soil depth in 25 cm×25 cm plots (You et al., 2018). The macro benthos were first collected from the surface of the salt marsh, then filtered through a mesh screen (0.5 mm) (Zuo et al., 2016). Then, the macro benthos were sealed into bags and brought back to the laboratory for fixation and classification. The macro benthos were classified into functional groups based on three kinds of biological functions, i.e., feeding habits, forms of locomotion, and food gathering methods (Veiga et al., 2016). There were five types of feeding habits, including suspension feeder (F), surface detritivore (S), burrowing detritivore (B), carnivore (C), and herbivore (H); three forms of locomotion, including mobile (M), semi-mobile (D), and sessile (S); and three types of food gathering methods including jawed (J), tentaculata (T), and other mechanism (X) (Yuan et al., 2002).

2.6 Statistical and analytical methods

Using a comprehensive Soil Detector (YN-8000), the soil physicochemical characteristics measured included total nitrogen, total phosphorus, organic carbon, and soil salinity. Particle size is used as the indicator of hydrodynamics (Shi et al., 2020). We used a Malvern Mastersizer 2000 to measure the particle size (Liu et al., 2013). The moisture content was measured as a ratio of dry weight and wet weight (Chu, 2021).
Relative abundance (RA) and relative frequency (RF) were calculated as the characteristics of the functional groups (Lin et al., 2015). We used Excel 2016 to calculate relative abundance and relative frequency with the following formula:
$RA=\frac{{{n}_{i}}}{N}\times 100$
$RF=\frac{{{f}_{i}}}{F}\times 100$
where $~{{n}_{i}}$ is the number of the t-th functional group, N is the total number of all functional groups,is the appearance frequency of the t-th functional group, and F is the total number of sampling times.
Stepwise regression analysis was performed using SPSS 26.0 to quantitatively reveal the key influencing factors associated with the macro benthos functional group spatial patterns.

3 Results

3.1 The classification results of the functional groups

All macro benthos species were classified into 15 functional groups (Table 1), but there were only 11 effective functional groups. FSX, FST, SST, and SMX were shown to be ineffective functional groups when it was revealed that sessile macro benthos were seldom observed, and most functional groups are more likely to flourish with movement.
Table 1 The functional group classification of macro benthos
Functional groups Description Species found in the samples
CMJ Jawed mobile carnivore Palaemon modestus Heller, 1862, Palaemon annandalei Kemp, 1917, Eohaustorius cheliferus Bulyčeva, 1952, Glycera chirori Izuka, 1912, Nephtys glabra Hartman, 1950
CMX Mobile carnivore Cerebratulina sp.
CDJ Jawed semi-mobile carnivore Gnorimosphaeroma rayi Hoestlandt, 1969
FMJ Jawed mobile suspensivore Hemileucon bidentatus Liu & Liu, 1990
FMX Mobile suspensivore Perioculodes meridichinensis Hirayama, 1992
FDX Semi-mobile suspensivore Corbicula fluminea O.F. Müller, 1774; Glaucomya chinensis*, Sinonovacula constricta Lamarck, 1818; Gomphina veneriformis Bivalvia: Veneridae *, Potamocorbula Amurensis Schrenck,1861*; Astarte borealis Schumacher, 1817
SMJ Jawed mobile surface detritivore Pyrhila pisum De Haan, 1841; Helicana wuana Rathbun, 1931; Deiratonotus cristatum De Man, 1895; Grandidierella japonica Stephensen, 1938
SDX Semi-mobile surface detritivore Assiminea J. Fleming, 1828; Pseudomphala latericea H. Adams & A. Adams, 1864; Assiminea violacea Heude, 1882; Bullacta caurina Benson, 1842; Cerithideopsis largillierti Philippi, 1848
BMJ Jawed mobile subsurface detritivore Helice tientsinensis Rathbun, 1931; lyoplax deschampsi Rathbun, 1913
BMX Tentaculate semi-mobile subsurface detritivore Heteromastus filiformis Claparède, 1864
HDX Semi-mobile herbivore Stenothyra glabra A. Adams, 1861
FSX Tessile suspensivore None
FST Tentaculate sessile suspensivore None
SST Tentaculate sessile surface detritivore None
SMX Mobile surface detritivore None

Note: Feeding habits: F-suspension feeder, S-surface detritivore, B-burrowing detritivore, C-carnivore, H-herbivore. Forms of locomotion: M-mobile, D-semi-mobile, S-sessile. Food gathering methods: J-jawed, T-tentaculate, X-other mechanism. *: Species names were not found on http://www.marinespecies.org, while they appeared in some Chinese sources.

3.2 Changes in the relative abundance of functional groups

The semi-mobile suspensivore (FDX) functional group was dominant in April, the semi-mobile surface detritivore (SDX) group was dominant in the summer, and the jawed mobile carnivore (CMJ) group was dominant in autumn and winter (Fig. 3). The relative abundances of functional groups in spring and summer were mostly higher than in autumn and winter.
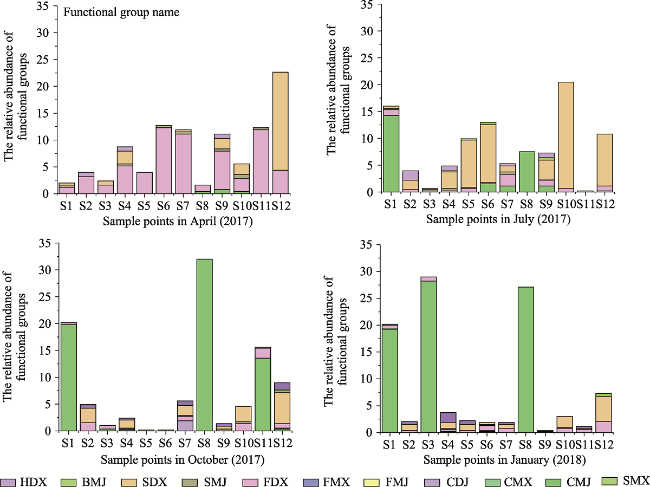
Fig. 3 Changes in the relative abundance of functional groups during the year

Note: FDX dominated in spring. SDX dominated in summer. CMJ dominated in autumn and winter. BMJ, jawed mobile subsurface detritivore; CDJ, jawed semi-mobile carnivore; CMJ, jawed mobile carnivore; CMX, mobile carnivore; FDX, semi-mobile suspensivore; FMJ, jawed mobile suspensivore; FMX, mobile suspensivore; HDX, semi-mobile herbivore; SDX, semi-mobile surface detritivore; SMJ, jawed mobile surface detritivore; SMX, mobile surface detritivore.

The semi-mobile suspensivore (FDX) group demonstrated a higher relative abundance at sites S1-S11, and appeared at sites S2, S4-S7, S9-S10, and S12. The semi-mobile surface detritivore (SDX) group had higher relative abundances at sites S2, S4, S5, S6, S9, S10, and S12. The jawed mobile carnivore (CMJ) group had higher abundance values at sites S1, S8, and S11 in autumn and S1, S3, and S8 in winter. The jawed (J) group was dominant over the “other mechanism” (X) group in relative abundance. The other mechanism (X) and jawed (J) groups dominated the tentaculate (T) group throughout the year.

3.3 Changes in the relative frequency of functional groups

The relative frequency of functional groups increased from April to July, and then decreased in October and January (Fig. 4). BMJ, CDJ, CMX, FMJ, and FMX appeared in some seasons, but not all; while CMJ, FDX, HDX, SDX, and SMJ appeared all throughout the year. The relative frequency of the semi-mobile suspensivore (FDX) group had the highest value among all functional groups during the research period. The relative frequency of the semi-mobile surface detritivore (SDX) group increased from April to July and then decreased after July. The relative frequency of the jawed mobile carnivore (CMJ) group was highest in July, but then changed little during autumn and winter.
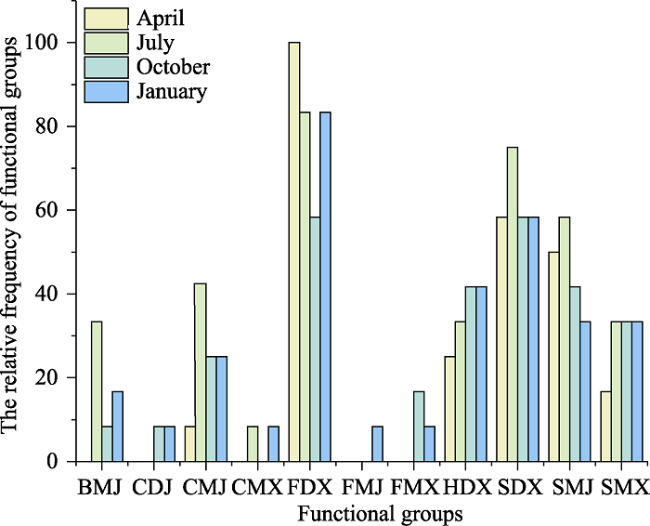
Fig. 4 Changes in the relative frequency of functional groups throughout the year

Note: BMJ: jawed mobile subsurface detritivore; CDJ: jawed semi-mobile carnivore; CMJ: jawed mobile carnivore; CMX: mobile carnivore; FDX: semi-mobile suspensivore; FMJ: jawed mobile suspensivore; FMX: mobile suspensivore; HDX: semi-mobile herbivore; SDX: semi-mobile surface detritivore; SMJ: jawed mobile surface detritivore. SMX: mobile surface detritivore.

The relative frequencies of the carnivore (C) functional groups, in order, were CMJ > CDJ, indicating that movement dominates over semi-movement among carnivores. The other mechanism (X) group of food gathering was dominant over the jawed (J) group with respect to the relative frequency.

3.4 Regression analysis

The regression analysis showed the relationships of the factors to the different functional groups (Table 2). In April, the dominant functional group semi-mobile suspensivore (FDX) had a negative correlation with particle size (P=0.02). Jawed mobile carnivore (CMJ) had a negative correlation with elevation (P=0.022), while it had a positive correlation with plant density (P=0.058). SMJ had a significant positive correlation with moisture content (P=0.001), and semi-mobile surface detritivore (SDX) had a significant positive correlation with organic carbon (P<0.001).
Table 2 The regression analysis of macro benthos functional groups
Month Dependent Variable Models Independent Variable Adjusted R2 Standard Coefficient B P
April CMJ 1 EL 0.849 ‒0.949 0.051
2 EL 0.998 ‒1.368* 0.022
PD 0.998 0.525 0.058
FDX 1 PZ 0.376 ‒0.658* 0.020
SMJ 1 MC 0.93 0.972** 0.001
SDX 1 OC 0.967 0.986** 0.000
July CMJ 1 PZ 0.8 0.917** 0.010
2 PZ 0.962 1.072** 0.001
TP 0.962 ‒0.401* 0.024
SDX 1 MC 0.361 0.664 0.051
2 MC 0.59 1.158* 0.011
PCD 0.59 ‒0.704 0.069
3 MC 0.821 1.085** 0.004
PCD 0.821 ‒1.018** 0.008
PZ 0.821 ‒0.576* 0.032
BMJ 1 PZ 0.537 ‒0.793 0.060
HDX 1 PH 0.687 0.875 0.052
2 PH 0.948 1.143* 0.013
TP 0.948 ‒0.531 0.057
3 PH 0.999 1.214* 0.011
TP 0.999 ‒0.666* 0.024
MC 0.999 0.198 0.069
October CMJ 1 PH 0.708 ‒0.870* 0.011
SDX 1 PD 0.363 0.685 0.090
BMX 1 TP 0.863 ‒0.947* 0.014
2 TP 0.997 ‒0.82** 0.001
PZ 0.997 ‒0.342** 0.008
HDX 1 TP 0.863 ‒0.947* 0.014
2 TP 0.997 ‒0.820** 0.001
PZ 0.997 ‒0.342** 0.008
January CMJ 1 SS 0.364 0.686 0.089
2 SS 0.633 0.749* 0.040
TP 0.633 0.538 0.097
SDX 1 MC 0.695 0.864* 0.012
BMJ 1 MC . 1 .
HDX 1 OC 0.861 ‒0.946* 0.015
FDX 1 OC 0.323 0.631* 0.050

Note: EL: elevation, PD: plant density, PZ: particle size, MC: moisture content, OC: organic carbon, TP: total phosphorus, PCD: plant cover degree, SS: soil salinity.

In July, the dominant functional group of semi-mobile surface detritivore (SDX) had a positive correlation with moisture content (P=0.004), while it had negative correlations with plant cover degree (P=0.008) and particle size (P=0.032). The jawed mobile carnivore (CMJ) group had a significant positive correlation with particle size (P=0.001), but a negative correlation with total phosphorus (P=0.024). BMJ had a negative correlation with particle size (P=0.060). HDX had positive correlations with plant height (P=0.011) and moisture content (P=0.069), but a negative correlation with total phosphorus (P=0.024).
In October, the dominant functional group of jawed mobile carnivore (CMJ) had a positive correlation with plant height (P=0.011). SDX had a positive correlation with plant density (P=0.090). BMX and HDX had positive correlations with total phosphorus (P=0.001) and particle size (P=0.008).
In January, the dominant functional group of jawed mobile carnivore (CMJ) had positive correlations with soil salinity (P=0.040) and total phosphorus (P=0.097). The semi-mobile surface detritivore (SDX) group had a positive correlation with moisture content (P=0.012). Organic carbon had a positive correlation with the semi-mobile suspensivore (FDX) group (P=0.050), while it had a negative correlation with HDX (P=0.015).

3.5 Spatial distribution of the main functional groups

Semi-mobile suspensivore (FDX), semi-mobile surface detritivore (SDX), and jawed mobile carnivore (CMJ) were the main macro benthos functional groups with higher relative abundance and relative frequency values. Their spatial patterns are illustrated in Fig. 5. FDX preferred locations far away from water, but was found in wider extents throughout the study area. SDX and CMJ prefer locations close to the sea. CMJ dominated at sites with less plant coverage, such as S1, S3, S8, and S11.
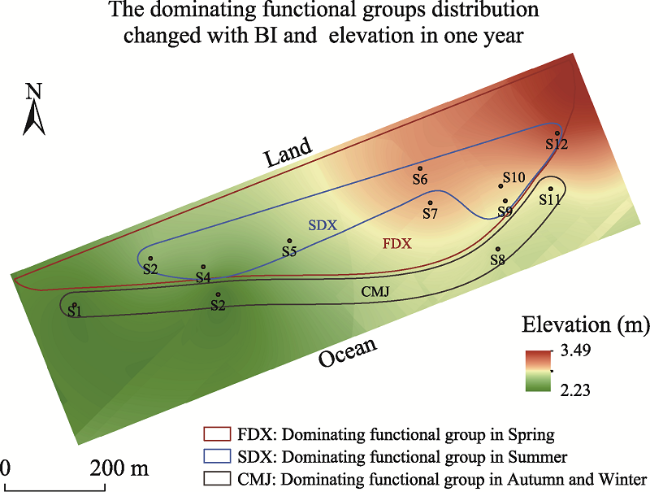
Fig. 5 Distribution of the dominant functional groups in relation to elevation
Note: The order of functional groups from land to ocean was FDX, SDX, and CMJ. FDX had a wider distribution area and higher elevation than SDX and CMJ throughout whole year. CMJ was distributed on the edge of the vegetation of wetlands and at a lower average elevation.

4 Discussion

4.1 The increase of macro benthos functional groups

Based on a pre-survey of the macro benthos in the research area, there is no single dominant species of macro benthos during the whole year. Different functional groups showed different spatiotemporal patterns throughout the year with different associated factors affecting them. Compared with wetlands before restoration, the relative abundance of functional groups increased after restoration. The plants were restored and used as habitats for macro benthos (Tao et al., 2018). The number of macro benthos increased from 13 to 19 (Zhong et al., 2020), revealing that the macro benthos were restored gradually after the restoration of the wetlands.

4.2 The spatiotemporal patterns of macro benthos functional groups

Macro benthos patterns originate from the cooperative effect of different environmental factors. Different macro benthos have various life cycles. From land to sea, the relative abundance of functional groups was in the order of FDX > SDX > CMJ (Fig. 5), which was similar to the order found by Lv et al. (2013).

4.2.1 The factors influencing the FDX group

The semi-mobile suspensivore (FDX) group was distributed with more vegetation, which might be because suspensivores prefer to stay in sites with more organic matter (Alurralde et al., 2019). S. mariqueter has the advantages of organic carbon fixation (Mei and Zhang, 2007). Different kinds of plants create different organic carbon contents (Chen et al., 2005; Wu et al., 2015). This also indicates the reason why macro benthos inhabited areas under S. mariqueter more than bare areas.
The vegetation accumulated total nitrogen in sediments inhabited by FDX and influenced its distribution. That result was similar to the findings of Jayaraj et al. (2007), who proposed that total nitrogen could be used to explain the diversity of semi-mobile suspensivores. Higher soil salinity and organic carbon influenced the abundance of larval clams and oysters among the semi-mobile suspensivores (Zhang et al., 2016; Huang et al., 2008). Even though Spartina alterniflora had more advantages due to nitrogen fixation (Li et al., 2020), its roots are too complex for macro benthos to inhabit.
On the other hand, plants weaken the hydrological force leading to the accumulation of finer sand sediments. Leitner et al. (2015) found that sand sediments suit some bivalve clams. The sites with S. mariqueter were around 2.7 m elevation, and most of the sampling sites were characterized by sand sediments (Li et al., 2018), which explained the dominance of semi-mobile suspensivores, especially bivalve clams. The semi-mobile suspensivore habitats were found to be more unstable with a greater occurrence of hydrodynamics with washing power. Campbell and Hall (2019) also showed that hydrodynamics had significant effects on FDX oysters.
Thus, semi-mobile suspensivores preferred sites with higher vegetation density, weaker hydrodynamic forces and higher elevation, higher soil salinity, and more organic carbon.

4.2.2 The factors influencing the SDX group

Most members of the Nanhui coast semi-mobile surface detritivore (SDX) functional group were snails. Regression analysis showed moisture content had a significant correlation with the SDX functional group. Compared with the findings of Zhao et al. (2017), SDX could withstand 25% dehydration, but not over 30%, indicating that moisture content was the important restrictive factor for SDX. Snails exist within a 15-30 ℃ temperature range and grow rapidly around 25 ℃ (Guan et al., 2016). Guan showed that the snails of SDX breed successfully (98.5%) under temperatures of 28.5 ℃, explaining why SDX was dominant in summer with higher temperatures and appeared at some sites in the spring.
Most snails live on the surface of sediments (Back et al., 2012). Too many plants hinder the movement of SDX snails. Strong hydrodynamic forces wash away snails and disturb their habitat. Therefore, plant cover degree and particle size had negative correlations with SDX.
The SDX distribution reveals that SDX preferred sites with better soil salinity, higher moisture content, smaller particle size, and a soft bottom. The semi-mobile surface detritivore (SDX) group required more environmental heterogeneity than the semi-mobile suspensivore (FDX) group.

4.2.3 The factors influencing the CMJ group

Jawed mobile carnivores (CMJ) were found in areas with less plant density that are closer to the ocean. CMJ preferred sites with higher soil salinity, larger particle size, less vegetation, lower elevation, and stronger hydrodynamic forces.
CMJ carnivores have the advantage of using multiple feeding habits to survive (Han et al., 2019). Sites with an abundance of CMJ were typically those without plants to weaken the hydrodynamic force and closer to the ocean, and the particle size of these sites was coarser. Some CMJ species preferred sites with higher nutrition and soil salinity (Wang et al., 2020). The stronger movement ability of the amphipods could suit the stronger changes of particle size and hydrodynamic force. Less environmental heterogeneity supported more space for the movements of the CMJ functional group. Finer particle size sediments have a stronger viscous force (Liu et al., 2017). Swimming movement is the better form for hunting and survival, especially in summer and winter (Wang et al., 2015). Swimming movement macro benthos find it harder to hunt and move in finer sediment, and similar results were found by other researchers (Wang et al., 2018). These characteristics also explained why CMJ inhabited sampling sites S1 and S8 during the summer (Fig. 3).
The changes of tide and hydrodynamic force washing changed the nutrients in the sediments. Organic material usually had a significant correlation with the production of macro benthos. Most significantly, organic carbon and the ratio of carbon to nitrogen had positive correlations with macro benthos omnivores (You et al., 2018). This also explained why suspension feeders (F) and surface detritivores (S) were dominant when plants were present. The order of functional groups by relative abundance was: Carnivores (C) > suspension feeders (F) > surface detritivores (S) > burrowing detritivores (B) > herbivores (H), which was similar to other studies (Liu et al., 2016; Yuan et al., 2019).

4.3 Combining functional groups and influencing factors into a biogeomorphological index

The functional groups of macro benthos and their influencing factors, both biotic and abiotic, comprise the biogeomorphology of the system. We propose a biogeomorphological index (BI) to summarize the regression analysis. The BI was computed in the following simple composite formula:
$BI=PD\times 0.3++MC\times 0.3+PZ\times 0.4$
where PD is plant density; MC is moisture content; and PZ is particle size.
The BI proposed here is just a synoptic computation that reflects the joint effects of vegetation and hydrodynamic forces. Specifically, PD represents the effects of vegetation, while MC and PZ reflect the effects of elevation and hydrodynamic forces. Then, the responses of different macro benthos functional groups to BI were calculated (Fig. 6).
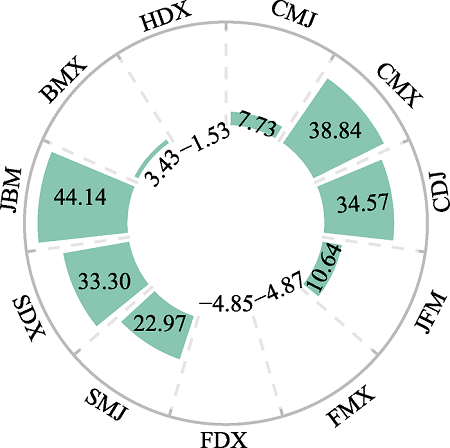
Fig. 6 The BI of all functional groups throughout the year
Note: The average biogeomorphological index (BI) of all functional groups was 32.27 for the whole year. The FDX, FMX, and HDX functional groups were distributed on sites with a BI that was lower than the average. The order of dominant functional group BI values was SDX> CMJ> FDX. BMJ needed the highest BI, while FMX needed the lowest BI.
The changes in BI revealed a synthetic state of the coastal wetlands. When compared with individual traditional biogeomorphological factors, the BI composed of different biotic and abiotic factors had some advantages in the quantitative analysis by showing the level of biogeomorphology in the study area (Fig. 7).
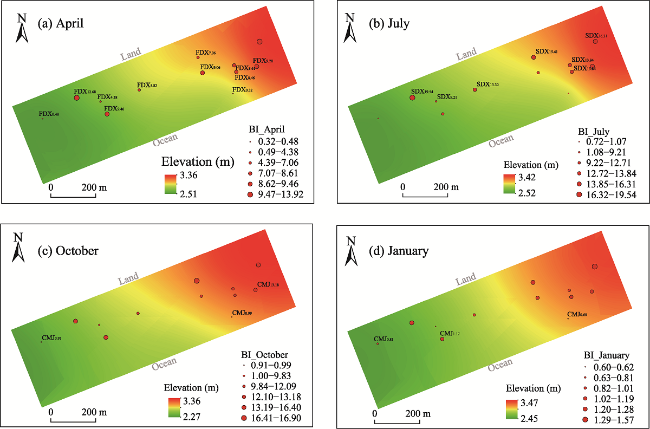
Fig. 7 The change in the distribution of biogeomorphological index (BI) and functional groups throughout the year
Note: SDX was distributed on sites with a higher BI than FDX and CMJ. FDX needed a higher elevation than SDX and CMJ. CMJ was distributed on sites with the lowest BI and elevation.
The results of Cui et al. (2020) and Vacchi et al. (2017) showed that higher heterogeneity of wetlands with more vegetation indicated a better biogeomorphological process. Some species of semi-mobile suspensivores (FDX) improved bio-deposition to increase the sedimentation (Li et al., 2021a). Semi-mobile surface detritivores (SDX) have a biodeposition function to raise the sediments (Zhang et al., 2016; Zhang et al., 2018). Li et al. (2021b) discovered the FDX M. meretrix was deposited on sediments. This explained why FDX and SDX were distributed at sites with more vegetation, while jawed mobile carnivores (CMJ) were found on the edge of the wetlands with lower BI in autumn and winter.
BI as a synthetic index reflects the joint effects of vegetation and other variables, i.e., hydrodynamic forces and elevation. The changes in BI showed the level of biogeomorphological effects in reducing the wave energy for macro benthos and promoting particle sedimentation. Higher BI values revealed the interactions of rising elevation, accelerating organic carbon, and reducing soil total nitrogen between plants and macro benthos.

4.3.1 The use of macro benthos to promote wetland

restoration work
The coordinated variations between BI and functional groups of macro benthos might give us some ideas of how to use macro benthos and BI to promote wetland remediation. Organisms are not only passively influenced by geomorphic environmental processes but also actively shape the geomorphic processes (Eichel et al., 2016; Guo, 1994). In the summer group, semi-mobile surface detritivores (SDX) can be added at sites with higher BI, middle elevation, and higher moisture content. In the spring group, semi-mobile suspensivores (FDX) can be added at sites that have higher elevation, a weaker hydrodynamic force, more plants with organic carbon, and that are further from the sea. Semi-mobile suspensivores (FDX) and semi-mobile surface detritivores (SDX) accumulate the biodepositions for plants to improve the biogeomorphological processes. The behaviors of jawed mobile carnivores (CMJ) can generate a stronger biodisturbance in the environment (Keijsers et al., 2015; Spencer and Viles, 2002). The swimming and burrowing behavior of CMJ, such as crabs, can influence the environment (Nagelkerken et al., 2016; Qiu et al., 2019). Adding CMJ at the lower BI sites can enhance the biodisturbance effect to improve the circulation of energy and matter.

4.3.2 Use of BI to reflect the biological invasion of wetlands

The BI can also be used to explain and reflect the holistic dynamics caused by the integrated interactions of vegetation and the physical environment, i.e., hydrodynamic forces, elevation, and solid suspended sediments. The biological invasion of S. alterniflora could also be reflected. It has been reported that among the differences of biogeomorphological effects of salt marsh (Xue et al., 2021), the sediment interceptions and wave attenuations of plants were different. The average wave attenuation rate (% m-1) of S. mariqueter was 0.54, while for S. alterniflora it was 2.79 (Xue et al., 2021), and this effect could be reflected by the BI.

4.3.3 Use of BI to reflect the succession of wetlands

The BI in combination with functional groups of macro benthos could reveal the succession process of restored wetlands. The higher BI in sites S5, S6, S7, and S12 reflected better plant density and more different kinds of macro benthos, while the lower BI revealed lower space heterogeneity, making it difficult to attract more species (Zhou et al., 2007). Those findings were similar to Cocito (2004) and Dong et al. (2017), who revealed that the wetlands they studied were restored better than the lower BI sites, such as S1, S3, and S8.
Zhao et al. (2019) showed that through self-organization plants have the ability to resist bad environments and grow better, so the higher BI had stronger power for survival. The lower average BI sampling points (S1, S4, and S8) had a lower moisture content, allowing plants to grow (Ding et al., 2015) and revealing the lower succession of vegetation. Some higher elevation sampling points were no longer suitable for S. mariqueter (Hou et al., 2008; Xu and Tong, 2018). For example, at sampling points S12 and S6 with higher elevation, P. australis might have more potential to replace S. mariqueter, and S. alterniflora have a better ecological niche to inhabit than S. mariqueter (Yan et al., 2007).
Therefore, the use of BI is practical for estimating the succession status and planning some corresponding management steps to promote the restoration process. By using BI, we can assess the extent and development of spatially explicit biogeomorphology, which may help to improve the wetlands through digital management, guiding whether functional groups of macro benthos or plants should be added to the sites.

4.4 The next research steps

The regression analysis of different functional groups showed that they did not all have high explanatory power. In this research, the actual hydrodynamic forces were not measured, but particle size was used as a surrogate variable to represent the effects of hydrodynamic forces (Collin et al., 2011). Though particle size can be used to represent the hydrodynamic forces to some degree, it cannot replace the measurements of the true hydrodynamic forces. In the near future, we plan to perform field hydrodynamic force measurements to improve the study.
The BI designed and calculated in this research could be used to show the possibilities of biogeomorphology in a cursory sense. However, other variables need to be examined for more precise computation in the future. Compared with S. mariqueter, S. alterniflora and P. australis can cover most of the areas of S. mariqueter, because they have more advantages for adapting to the changes of tides and higher elevation (Ni, 2013). Future research on the BI of those different plant species may help us to distinguish different kinds of plants or invasions, and support a more precise change in the ranges to reflect the dynamics of succession. In the future, we should use more data to derive the BI, which we can combine with remote sensing and drones on one map to study the dynamic changes and spatial movements of biogeomorphology.

5 Conclusions

The classification of macro benthos functional groups in this study was determined by feeding habits, food gathering methods, and forms of locomotion. All macro benthos were classified into 11 effective functional groups.
The main functional groups of macro benthos were semi-mobile suspensivores (FDX) in spring, semi-mobile surface detritivores (SDX) in summer, and jawed mobile carnivores (CMJ) in the autumn and winter.
From land to sea, the order of the dominant functional groups was FDX, SDX, and CMJ.
Quantitative analysis showed that particle size, moisture content, and plant height were common factors for determining the spatiotemporal patterns of most of the functional groups. The main factors influencing the semi-mobile suspensivores (FDX) were particle size (P=0.020) and vegetation. Moisture content (P=0.004), plant cover degree (P=0.008), particle size (P=0.032), and temperature were the restricting factors of semi-mobile surface detritivores (SDX) in summer. Particle size and soil salinity (P=0.040) along with plant height (P=0.011) were the factors influencing the jawed mobile carnivores (CMJ).

Appendix

Appendix: The abbreviation list
Abbreviation Full name Abbreviation Full name
BI biogeomorphological index FST tentaculate sessile suspensivore
BMJ jawed mobile subsurface detritivore FSX tessile suspensivore
BMX tentaculate semi-mobile subsurface detritivore HDX semi-mobile herbivore
CDJ jawed semi-mobile carnivore PCA principal component analysis
CMJ jawed mobile carnivore SDX semi-mobile surface detritivore
CMX mobile carnivore SMJ jawed mobile surface detritivore
FDX semi-mobile suspensivore SMX mobile surface detritivore
FDX semi-mobile suspensivore SST tentaculate sessile surface detritivore
FMJ jawed mobile suspensivore YRE the Yangtze River Estuary
FMX mobile suspensivore
[1]
Alurralde G, Fuentes V L, Maggioni T, et al. 2019. Role of suspension feeders in Antarctic pelagic-benthic coupling: Trophic ecology and potential carbon sinks under climate change. Marine Environmental Research, 152: 1-15.

[2]
Back C L, Holomuzki J R, Klarer D M, et al. 2012. Herbiciding invasive reed: Indirect effects on habitat conditions and snail-algal assemblages one year post-application. Wetlands Ecology and Management, 20(5): 419-431.

DOI

[3]
Balke T, Klaassen P C, Garbutt A, et al. 2012. Conditional outcome of ecosystem engineering: A case study on tussocks of the salt marsh pioneer Spartina anglica. Geomorphology, 153: 232-238.

[4]
Bell S S, Watzin M C, Coull B C. 1978. Biogenic structure and its effect on the spatial heterogeneity of meiofauna in a salt marsh. Journal of Experimental Marine Biology and Ecology, 35(2): 99-107.

DOI

[5]
Benjamin K, Inmaculada F, Lrich S U, et al. 2013. Trophodynamics and functional feeding groups of North Sea fauna: A combined stable isotope and fatty acid approach. Biogeochemistry, 113(1): 189-212.

DOI

[6]
Bremner J, Rogers S I, Frid C L J. 2006. Methods for describing ecological functioning of marine benthic assemblages using biological traits analysis (BTA). Ecological Indicators, 6(3): 609-622.

DOI

[7]
Butler D R, Sawyer C F. 2012. Introduction to the special issue-Zoogeomorphology and ecosystem engineering. Geomorphology, 157-158: 1-5. DOI: 10.1016/j.geomorph.2012.02.027.

DOI

[8]
Campbell M D, Hall S G. 2019. Hydrodynamic effects on oyster aquaculture systems: A review. Reviews in Aquaculture, 11(3): 896-906.

DOI

[9]
Cardinale B J, Srivastava D S, Emmett D J, et al. 2006. Effects of biodiversity on the functioning of trophic groups and ecosystems. Nature, 443(7114): 989-992.

DOI

[10]
Chen H, Wang D Q, Chen Z L, et al. 2005. The variation of sediments organic carbon content in Chongming east tidal flat during Scirpus mariqueter growing stage. Journal of Geographical Sciences, 15(4): 500-508.

DOI

[11]
Chen Y N, Chen L Z, Cai T L, et al. 2020. Advances in biogeomorphology in coastal wetlands and its application in ecological restoration. Oceanologia et Limnologia Sinica, 51(5): 1055-1065. (in Chinese)

[12]
Chu Z H. 2021. Study on the change of soil water content and temperature. Modern Agricuture Research, 27(4): 23-24, 153. (in Chinese)

[13]
Cocito S. 2004. Bioconstruction and biodiversity: Their mutual influence. Scientia Marina, 68(S1): 137-144.

DOI

[14]
Collin A, Archambault P, Long B. 2011. Predicting species diversity of benthic communities within turbid nearshore using full-waveform bathymetric LiDAR and machine learners. Plos One, 6(6): 1-16.

[15]
Cui L F, Yuan L, Ge Z M, et al. 2020. The impacts of biotic and abiotic interaction on the spatial pattern of salt marshes in the Yangtze Estuary, China. Estuarine Coastal and Shelf Science, 238(3): 106717. DOI: 10.1016/j.ecss.2020.106717.

DOI

[16]
Ding W H, Jiang J Y, Li X Z, et al. 2015. Spatial distribution of species and influencing factors across salt marsh in southern Chongming Dongtan. Chinese Journal of Plant Ecology, 39(7): 704-716. (in Chinese)

DOI

[17]
Dong L L, Li X P, Liu X C, et al. 2017. Determining the effects of major cations (K+, Na+, Ca2+, Mg2+) and pH on Scirpus mariqueter to assess the heavy metal biotoxicity of a tidal flat ecosystem. Journal of Coastal Research, 33(5): 1086-1094.

DOI

[18]
Eichel J, Corenblit D, Dikau R. 2016. Conditions for feedbacks between geomorphic and vegetation dynamics on lateral moraine slopes: A biogeomorphic feedback window. Earth Surface Processes and Landforms, 41(3): 406-419.

DOI

[19]
Gascon S, Boix D, Sala J, et al. 2008. Relation between macroinvertebrate life strategies and habitat traits in Mediterranean salt marsh ponds (Emporda wetlands, NE Iberian Peninsula). Hydrobiologia, 597(1): 71-83.

DOI

[20]
Guan Q, Liu J P, Wu H T, et al. 2016. Research progress on the ecology of natural wetland snails (Mollusca Gastropoda) in China. Acta Ecologica Sinica, 36(9): 2471-2481. (in Chinese)

[21]
Guo Y. 1994. An approach to biogeomorphology. Journal of Chongqing Teachers College (Natural Science Edition), 11(3): 88-94. (in Chinese)

[22]
Han J, Song M M, Zhang J, et al. 2019. Selective adaptations of macrobenthic functional feeding groups in the Hunhe River Basin. Acta Ecologica Sinica, 39(6): 2013-2020. (in Chinese)

[23]
He L Z, Shou L, Liao Y B, et al. 2020. The succession of macrobenthic functional groups in Changjiang River Estuary and its adjacent waters. Oceanologia Et Limnologia Sinica, 51(3): 477-483. (in Chinese)

[24]
Hou L J, Liu M, Ou D N, et al. 2008. Influences of the macrophyte (Scirpus mariqueter) on phosphorous geochemical properties in the intertidal marsh of the Yangtze Estuary. Journal of Geophysical Research: Biogeosciences, 113(G4). DOI: 10.1029/2008JG000780.

DOI

[25]
Huang Y, Du T, Yang S P. 2008. Preliminary studies on ecological habit of Tapes dorsatus. Fisheries Science, 27(4): 175-178. (in Chinese)

[26]
Jayaraj K A, Jayalakshmi K V, Saraladevi K. 2007. Influence of environmental properties on macrobenthos in the northwest Indian shelf. Environmental Monitoring & Assessment, 127(1-3): 459-475.

[27]
Jiang R J, Zhang L L, Xu K D, et al. 2019. Characteristics and diversity of nekton functional groups in the coastal waters of south-central Zhejiang Province. Biodiversity Science, 27: 1330-1338. (in Chinese)

[28]
Keijsers J G S, De G A V, Riksen M J P M. 2015. Vegetation and sedimentation on coastal foredunes. Geomorphology, 228: 723-734.

DOI

[29]
Kent M, Owen N W, Dale P, et al. 2001. Studies of vegetation burial: A focus for biogeography and biogeomorphology? Progress in Physical Geography: Earth and Environment, 25(4): 455-482.

[30]
Leitner P, Hauer C, Ofenbock T, et al. 2015. Fine sediment deposition affects biodiversity and density of benthic macroinvertebrates: A case study in the freshwater Pearl Mussel River Waldaist (Upper Austria). Limnologica, 50: 54-57.

[31]
Li C W, Tao Y D, Zhao M, et al. 2018. Soil characteristics and their potential thresholds associated with Scirpus mariqueter distribution on a reclaimed wetland coast. Journal of Coastal Conservation, 22(6): 1107-1116.

DOI

[32]
Li J S, Wang Y P, Du J B, et al. 2021a. Effects of Meretrix meretrix on sediment thresholds of erosion and deposition on an intertidal flat. Ecohydrology & Hydrobiology, 21(1): 129-141.

[33]
Li J S, Chen X D, Townend I, et al. 2021b. A comparison study on the sediment flocculation process between a bare tidal flat and a clam aquaculture mudflat: The important role of sediment concentration and biological processes. Marine Geology, 434: 106443. DOI: 10.1016/j.margeo.2021.106443.

DOI

[34]
Li N, Li B, Nie M, et al. 2020. Effects of exotic spartina alterniflora on saltmarsh nitrogen removal in the Yangtze River Estuary, China. Journal of Cleaner Production, 271: 122557. DOI: 10.1016/j.jclepro.2020.122557.

DOI

[35]
Lin L Y, Tong C F, Li X Z. 2015. Classification and distribution characteristics of benthic macroinvertebrate functional groups in the saline algae of Chongming Dongtan. Chinese Journal of Ecology, 34(8): 2229-2237. (in Chinese)

[36]
Liu K, Lin H S, He X B, et al. 2016. Functional feeding groups of macrozoobenthos and their relationships to environmental factors in Xiamen coastal waters. Acta Oceanologica Sinica, 38(12): 95-105. (in Chinese)

[37]
Liu M H, Meng Y, Cao J, et al. 2019. Functional traits of macroinvertebrates in Naolihe Wetland. Journal of Northeast Forestry University, 47(1): 76-82. (in Chinese)

[38]
Liu R F, Zhang L H, Lin X, et al. 2013. Denitrification potential of Cyperus malaccensis marsh soil in Minjiang River estuary of Esat China. Chinese Journal of Ecology, 32(11): 2865-2870. (in Chinese)

[39]
Liu Y Y, Wang S, Li S, et al. 2017. Advances in molecular ecology on microbial functional genes of carbon cycle. Microbiology China, 44(7): 1676-1689. (in Chinese)

[40]
Lv W W, Ma C A, Yu J, et al. 2013. Macrobenthic functional groups at the reclamation and natural tidal flats of Hengsha East Shoal the estuary of Changjiang River. Acta Ecologica Sinica, 33(21): 6825-6833. (in Chinese)

DOI

[41]
Ma C A. Xu L T, Tian W, et al. 2011. Species composition, quantity distribution and seasonal variation of macrobenthos in east Nanhui tidal flat. Journal of Fudan University (Natural Science), 50(3): 274-281. (in Chinese)

[42]
Mei X Y, Zhang X F. 2007. Carbon storage and fixation function of Scirpus mariqueter in Changjiang River Estuary: A case study of Chongming Dongtan Wetland. Journal of Agro-Environment Science, 26(1): 360-363. (in Chinese)

[43]
Nagelkerken I, Munday P L. 2016. Animal behaviour shapes the ecological effects of ocean acidification and warming: Moving from individual to community-level responses. Global Change Biology, 22(3): 974-989.

DOI PMID

[44]
Ni G. 2013. Studies on the sensitive limiting factors of competition between exotic invaive plant Spartina alterniflora and Scirpus mariqueter. Diss., Shanghai, China: Shanghai University. (in Chinese)

[45]
Nickerson Z L, Mortazavi B, Atkinson C L. 2019. Using functional traits to assess the influence of burrowing bivalves on nitrogen-removal in streams. Biogeochemistry, 146(2): 125-143.

DOI

[46]
Qiu D D, Cui B S, Yan J G, et al. 2019. Effect of burrowing crabs on retention and accumulation of soil carbon and nitrogen in an intertidal salt marsh. Journal of Sea Research, 154: 101808. DOI: 10.1016/j.seares.2019.101808.

DOI

[47]
Qiu D D, Xu M, Yan J G, et al. 2021. Biogeomorphological processes and structures facilitate seedling establishment and distribution of annual plants: Implications for coastal restoration. Science of the Total Environment, 756: 143842. DOI: 10.1016/j.scitotenv.2020.143842.

DOI

[48]
Schwarz C, Bouma T J, Zhang L Q, et al. 2015. Interactions between plant traits and sediment characteristics influencing species establishment and scale-dependent feedbacks in salt marsh ecosystems. Geomorphology, 250: 298-307.

DOI

[49]
Sheng X Q, Chen Y Q, Quan W M, et al. 2007. Restoration effect of benthos on the ecological environment of the Changjiang River Estuary. Journal of Fisheries of China, 31(2): 199-203. (in Chinese)

[50]
Shi B W, Pratolongo P D, Du Y F, et al. 2020. Influence of macrobenthos (Meretrix meretrix Linnaeus) on erosion-accretion processes in intertidal flats: A case study from a cultivation zone. Journal of Geophysical Research: Biogeosciences, 125(1). DOI: 10.1029/2019JG005345.

DOI

[51]
Shi B W, Wang Y P, Yang Y, et al. 2015. Determination of critical shear stresses for erosion and deposition based on in situ measurements of currents and waves over an intertidal mudflat. Journal of Coastal Research, 31(6): 1344-1356.

[52]
Shun S C, Cai Y L, Liu H. 2001. Biomass allocation of Scirus mariqueter along an elevational gradient in a salt marsh of the Yangtse River Estuary. Acta Botanica Sinica, (2): 178-185.

[53]
Spencer T, Viles H. 2002. Bioconstruction, bioerosion and disturbance on tropical coasts: Coral reefs and rocky limestone shores. Geomorphology, 48(1-3): 23-50.

DOI

[54]
Su P, Wang X X, Lin Q D, et al. 2019. Variability in macroinvertebrate community structure and its response to ecological factors of the Weihe River Basin, China. Ecological Engineering, 140: 105595. DOI: 10.1016/j.ecoleng.2019.105595.

DOI

[55]
Tao Y D, Zhong S C, Li C W, et al. 2018. A study on the effect of ecological restoration and reconstruction of Scirpus mariqueter comminuty: A case of Nanhui coasts. Transactions of Oceanology and Limnology, (5): 40-49. (in Chinese)

[56]
Vacchi M, de Falco G, Simeone S, et al. 2017. Biogeomorphology of the Mediterranean Posidonia oceanica seagrass meadows. Earth Surface Processes and Landforms, 42(1): 42-54.

DOI

[57]
Veiga P, Torres A C, Aneiros F, et al. 2016. Consistent patterns of variation in macrobenthic assemblages and environmental variables over multiple spatial scales using taxonomic and functional approaches. Marine Environmental Research, 120: 191-201.

DOI PMID

[58]
Wang M, Hong B, Zhang Y P, et al. 2015. Community structure of nektons on northern Hangzhou Bay in summer and winter. Journal of Guangdong Ocean University, 35(3): 56-62. (in Chinese)

[59]
Wang Q S, Feng R J, Li L, et al. 2018. Characterization of the complete mitogenome for the freshwater shrimp Exopalaemon modestus. Conservation Genetics Resources, 10(4): 805-808.

DOI

[60]
Wu M X, Hu Y, Wu P L, et al. 2020. Does soil pore water salinity or elevation influence vegetation spatial patterns along coasts? A case study of restored coastal wetlands in Nanhui, Shanghai. Wetlands, 40(6): 2691-2700.

DOI

[61]
Wu M X, Wu P L, He P M, et al. 2021. Theory of scale-dependent feedback: An experimental validation and its significance for coastal saltmarsh restoration. Science of the Total Environment, 756: 143855. DOI: 10.1016/j.scitotenv.2020.143855.

DOI

[62]
Wu Z L, Wang D Q, Li Y J, et al. 2015. The contribution of Scripus mariqueter to sediment carbon storage of Chongming East Tidal Flat Wetland in Yangtze River Estuary. Acta Scientiae Circumstantiae, 35(11): 3639-3646. (in Chinese)

[63]
Xu Y, Li X Z, Wang H F, et al. 2016. Characteristics of a macrozoobenthic community in the sea adjacent to the Yangtze River Esuary during the wet season. Biodiversity Science, 24(7): 811-819. (in Chinese)

DOI

[64]
Yan Q, Lu J J, He W S. 2007. Succession character of saltmarsh vegetations in Chongming Dongtan Wetland. Chinese Journal of Applied Ecology, 18(5): 1097-1101. (in Chinese)

[65]
You D, Tong C F, Wu F R. 2018. Effects of sediments erosion and depositon varition on the benthic macroinvertebrate functional groups in an intertidal salt marsh of Nanhui Dongtan during the dry season Chongjiang River Estuar. Acta Oceanologica Sinica, 40(8): 63-78. (in Chinese)

[66]
Yuan J M, Zhang H, Tang X H, et al. 2019. Macrozoobenthic functional groups intertidal zone of southern Jiangsu Province. Marine Fisheries, 41(1): 43-52. (in Chinese)

[67]
Yuan X Z, Lu J J, Liu H. 2002. Distribution pattern and variation in the functional groups of zoobenthos in the Changjiang Estuary. Acta Ecologica Sinica, 22(12): 2054-2062. (in Chinese)

[68]
Zhang A G, Yuan X T, Hou W J, et al. 2016. Biodeposition, respiration, and excretion rates of an introduced clam Mercenaria mercenaria in ponds with implications for potential competition with the native clam Meretrix meretrix in Shuangtaizi Estuary, China. Chinese Journal of Oceanology and Limnology, 34(3): 467-476.

DOI

[69]
Zhang T T, Gao Y, Wang S K, et al. 2018. Landscape pattern of estuarine wetland and its multi-scale effects on macrobenthos diversity. Marine Fisheries, 40(6): 679-690. (in Chinese)

[70]
Zhao D, Liu Y, Song A H, et al. 2017. Genetic diversity of snail Bullacta exarate populations based on Mitochondrial DNACOI. Fisheries Science, 36(3): 353-358. (in Chinese)

[71]
Zhao L X, Xu C, Ge Z M, et al. 2019. The shaping role of self-organization: Linking vegetation patterning, plant traits and ecosystem functioning. Proceedings of the Royal Society B, 286(1900): 20182859. DOI: 10.1098/rspb.2018.2859.

DOI

[72]
Zhong S C, Yu K F, Li C W, et al. 2020. Variation and the associated factors of benthic biodiversity in wetlands of Scipus mariqueter on remediated Nanhui coasts. Resources and Environment in the Yangtze Basin, 29(4): 889-899. (in Chinese)

[73]
Zhou X, Ge Z M, Shi W Y, et al. 2007. Temporal and spatial fluctuation of macrobenthos community in a newly established wetland in Yangtze River estuary. Chinese Journal of Ecology, 26(3): 372-377. (in Chinese)

[74]
Zuo Z, Chen Y Q, Cheng B X, et al. 2016. Ecological characteristics of macrobenthic communities in SFWs of different hydrophytes and their relationships with environmental factors. Acta Ecologica Sinica, 36(4): 953-960. (in Chinese)

Outlines

/