
Journal of Resources and Ecology >
Evolution of Landscape Pattern and Tourism Service Value in Zhangjiakou City
|
LI Ying, E-mail: liying20190063@bisu.edu.cn |
Received date: 2021-10-18
Accepted date: 2022-03-15
Online published: 2022-10-12
Supported by
The Beijing Social Science Fund(20GLC064)
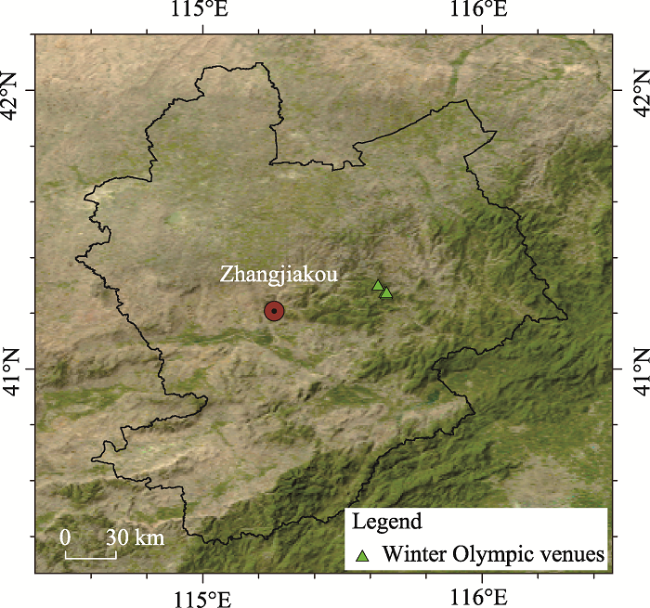
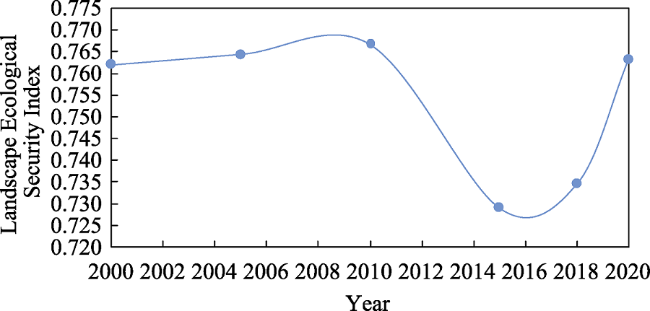
Zhangjiakou is a northern Chinese city that hosted the Beijing 2022 Winter Olympic Games. As an important ice and snow tourist destination, it is essential to investigate Zhangjiakou's rate of landscape pattern change, the landscape ecological security level, and ecosystem service value, particularly the tourism ecological service value during its construction. With land use data from 2000 to 2020, this study comprehensively analyzed the dynamic changes in Zhangjiakou, including land use dynamics, the land use transfer matrix, landscape vulnerability, landscape disturbance, ecosystem service value, tourism ecological service value, and other aspects. The results show that the landscape pattern in Zhangjiakou was greatly disturbed from 2015 to 2018, and the landscape ecological security was threatened in the process of landscape pattern adjustment. By 2020, after the landscape pattern was adjusted and stabilized, the landscape ecological security was restored, and the ecosystem service value was significantly improved, especially the tourism ecological service value. The results of this study will play an important role in promoting the optimization of Zhangjiakou's ice and snow landscape pattern and the improvement of tourism ecological value. In addition, it provides important lessons for the development of other ice and snow tourist destinations.
LI Ying , DAI Yuexingtong , HAN Jingting , ZOU Tongqian . Evolution of Landscape Pattern and Tourism Service Value in Zhangjiakou City[J]. Journal of Resources and Ecology, 2022 , 13(6) : 1098 -1108 . DOI: 10.5814/j.issn.1674-764x.2022.06.014
Fig. 1 Topographic map of Zhangjiakou |
Table 1 The land use types in Zhangjiakou |
| Code | Land use types | |
|---|---|---|
| 1 | Arable land | Paddy field |
| 2 | Dry land | |
| 3 | Woodland | Woodland |
| 4 | Shrubwood | |
| 5 | Open woodland | |
| 6 | Other woodlands | |
| 7 | Grassland | High coverage grassland |
| 8 | Medium coverage grassland | |
| 9 | Low coverage grassland | |
| 10 | Waters | River |
| 11 | Lake | |
| 12 | Reservoir pit | |
| 13 | Beach land | |
| 14 | Construction land | Urban area |
| 15 | Rural residential area | |
| 16 | Other construction land | |
| 17 | Unused land | Sand |
| 18 | Saline alkali land | |
| 19 | Swamp | |
| 20 | Bare land | |
| 21 | Bare rock | |
Table 2 Ecological service value coefficients |
| Land use type | Ecosystem service value coefficient (104 yuan km-2) | Tourism ecological service value coefficient (104 yuan km-2) |
|---|---|---|
| Arable land | 62.03 | 0.09 |
| Woodland | 196.13 | 11.33 |
| Grassland | 64.98 | 0.35 |
| Waters | 487.77 | 43.76 |
| Construction land | 0 | 0 |
| Unused land | 3.71 | 0.09 |
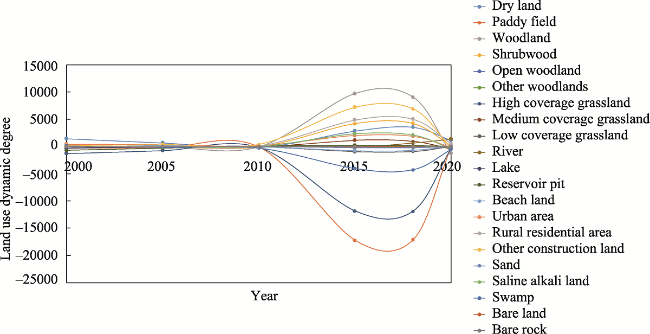
Fig. 2 Land use dynamic degree in Zhangjiakou |
Table 3 Land use transfer matrix (Unit: km2) |
| Period | Type | Arable land | Woodland | Grassland | Waters | Construction land | Unused land |
|---|---|---|---|---|---|---|---|
| Arable land | 17627.05 | 1.00 | 1.00 | 5.97 | 29.87 | 4.98 | |
| Woodland | 6.97 | 6919.19 | 1.00 | ||||
| 2000-2005 | Grassland | 68.70 | 9691.24 | 1.99 | |||
| Waters | 22.90 | 1.00 | 1.99 | 568.55 | 6.97 | ||
| Construction land | 792.58 | ||||||
| Unused land | 3.98 | 1.00 | 871.25 | ||||
| Arable land | 17701.72 | 5.97 | 1.00 | 20.91 | |||
| Woodland | 6917.19 | 3.98 | |||||
| 2005-2010 | Grassland | 9679.29 | 2.99 | 11.95 | |||
| Waters | 575.52 | ||||||
| Construction land | 825.44 | ||||||
| Unused land | 18.92 | 3.98 | 860.29 | ||||
| Arable land | 17700.73 | 1.00 | 1.00 | 17.92 | |||
| Woodland | 2.99 | 6917.19 | 2.99 | ||||
| 2010-2015 | Grassland | 9672.32 | 1.00 | 5.97 | |||
| Waters | 583.49 | ||||||
| Construction land | 862.28 | ||||||
| Unused land | 2.99 | 1.99 | 855.31 | ||||
| Arable land | 11966.44 | 1221.74 | 2852.71 | 231.00 | 1085.32 | 279.79 | |
| Woodland | 1000.69 | 4633.04 | 1142.08 | 23.90 | 85.63 | 7.97 | |
| 2015-2018 | Grassland | 2731.23 | 1763.40 | 4701.74 | 80.65 | 249.92 | 113.51 |
| Waters | 246.94 | 41.82 | 69.70 | 163.30 | 31.86 | 30.87 | |
| Construction land | 492.88 | 28.88 | 101.56 | 9.96 | 233.99 | 18.92 | |
| Unused land | 388.33 | 25.89 | 85.63 | 27.88 | 36.84 | 283.78 | |
| Arable land | 16903.17 | 14.94 | |||||
| Woodland | 1.00 | 7816.32 | 28.88 | 1.99 | |||
| 2018-2020 | Grassland | 2.99 | 9012.17 | 1.00 | 11.95 | ||
| Waters | 1.00 | 537.68 | 1.00 | 1.00 | |||
| Construction land | 23.90 | 4.98 | 2.99 | 4.98 | 1692.71 | 1.99 | |
| Unused land | 8.96 | 1.99 | 10.95 | 716.91 |
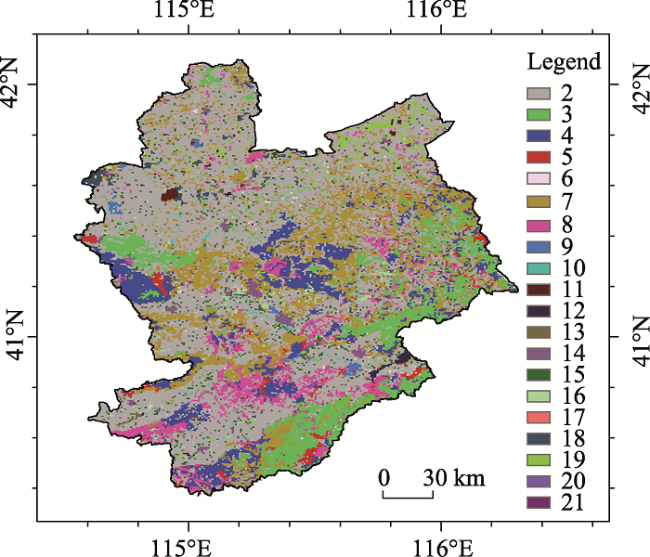
Fig. 3 Distribution of Zhangjiakou's land use types in 2020 Note: See Table 1 for the definitions of the land use type numbers in the legend. |
Fig. 4 Landscape Ecological Security Index of Zhangjiakou during 2000-2020 |
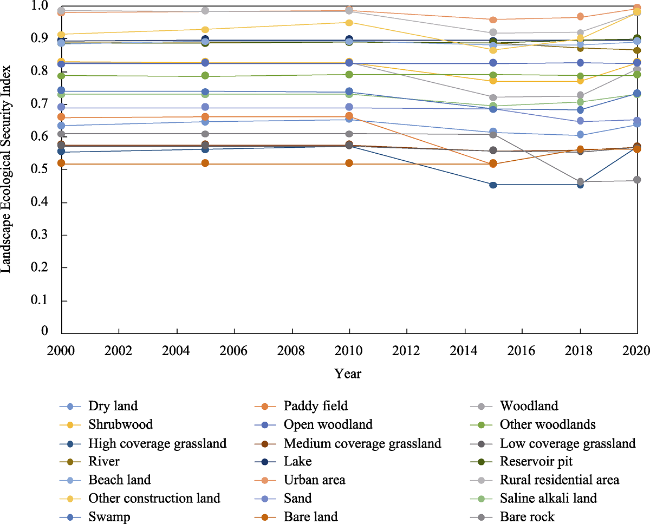
Fig. 5 LESI values of different land use types from 2000 to 2020 |
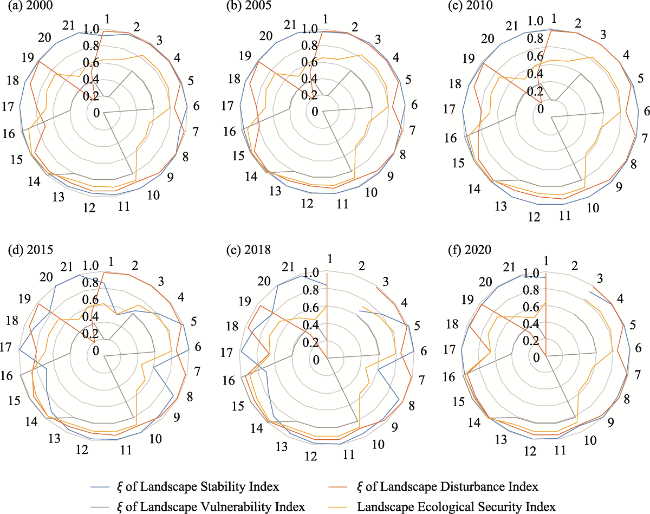
Fig. 6 The landscape disturbance, landscape vulnerability, land use dynamics, LESI standardized radar map.Note: See Table 1 for the definitions of the land use type numbers in the legend. ξ means the sample score. |
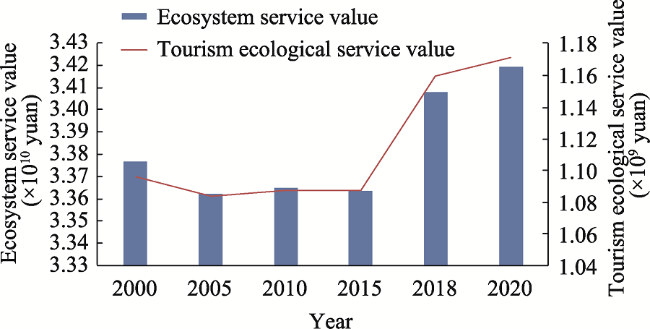
Fig. 7 Ecosystem service value and tourism ecological service value in Zhangjiakou from 2000 to 2020 |
| [1] |
|
| [2] |
|
| [3] |
|
| [4] |
|
| [5] |
|
| [6] |
|
| [7] |
|
| [8] |
|
| [9] |
|
| [10] |
|
| [11] |
|
| [12] |
|
| [13] |
|
| [14] |
|
| [15] |
|
| [16] |
|
| [17] |
|
| [18] |
|
| [19] |
|
| [20] |
|
| [21] |
|
| [22] |
|
| [23] |
|
| [24] |
|
| [25] |
|
| [26] |
|
| [27] |
|
| [28] |
|
| [29] |
|
| [30] |
|
/
| 〈 |
|
〉 |