Tourism Resource and Ecotourism

Spatial Structure and Development of Tourism Resources based on Point Pattern Analysis: A Case Study in Hainan Island, China

  • ZHANG Tongyan , 1 ,
  • WANG Yingjie , 2, * ,
  • WANG Yingying 3 ,
  • ZHANG Shengrui 1 ,
  • YU Hu 2
Expand
  • 1. College of Management, Ocean University of China, Qingdao, Shandong 266100, China
  • 2. State Key Laboratory of Resources and Environmental Information Systems, Institute of Geographic Sciences and Natural Resources Research, Chinese Academy of Sciences, Beijing 100101, China
  • 3. College of Resources and Environment, Shandong Agricultural University, Taian, Shandong 271018, China
* WANG Yingjie, E-mail:

ZHANG Tongyan, E-mail:

Received date: 2021-02-12

  Accepted date: 2022-06-01

  Online published: 2022-10-12

Supported by

The Hainan Province Tourism Development Committee(HZ2018-186)

The Special Key Projects of Science and Technology Basic Work of Ministry of Science and Technology(2013FY112800)

Abstract

Tourism resources are the basic materials of tourism development, and they also provide the support for regional tourism spatial competition. The development of tourism depends on the degree to which tourism resources are utilized, and it is of great guiding significance for their development and utilization to study their spatial structure. Based on a large sample of data on tourism resources, and starting from the characteristics of multi-type, multi-level and multi-combination, this paper puts forward a framework and method for analyzing the spatial structure of tourism resources. Taking Hainan Island as an example, this paper describes the spatial structure of tourism resources in Hainan Island by using the method of point pattern analysis, identifies the tourism resource development zones, and puts forward some suggestions for the development of tourism resources. The results are as follows: (1) The characteristic scale of the spatial structure of tourism resources in Hainan Island is 30.5 km, and there are significant differences in the distributions of all kinds of tourism resources. (2) Through the spatial structure map of tourism resources, the tourism resource development zones are identified, including three tourist central city levels, “one horizontal and three vertical” tourist belts and four tourist combination areas. (3) By combing the distribution of tourism resources and the development zones in Hainan Island, the cross-border characteristics of the tourism resources and development zones are obvious. In order to give full play to the spatial combination and superposition effect of tourism resources, a change from a single isolated development mode to the overall combined development between regions is suggested. On the provincial scale, it is relatively accurate to describe the spatial structure of tourism resources for point data with a large sample size. However, the method of point pattern analysis can not only accurately describe the spatial structure of tourism resources, but it can also provide reference for other types of regional spatial analyses. The research results provide a scientific basis for the spatial planning of regional tourism resources and have practical significance for the development of regional tourism.

Cite this article

ZHANG Tongyan , WANG Yingjie , WANG Yingying , ZHANG Shengrui , YU Hu . Spatial Structure and Development of Tourism Resources based on Point Pattern Analysis: A Case Study in Hainan Island, China[J]. Journal of Resources and Ecology, 2022 , 13(6) : 1058 -1073 . DOI: 10.5814/j.issn.1674-764x.2022.06.011

1 Introduction

Tourism resources are the basic materials of tourism development, and also provide the support for regional tourism spatial competition (Mills, 2010; Zhu et al., 2012). The development of tourism depends on the degree to which tourism resources are utilized, and it is of great guiding significance for their development and utilization to study their spatial structure (Wu et al., 2008; Li, 2011). By studying the geographical location, spatial correlation, and agglomeration of tourism resources, the characteristics of tourism resource development are revealed, and the efficiency of regional tourism resource utilization is improved (Liu, 2018). Coastal tourism has made great progress in the past decade. For their unique geographical locations, natural environments, and cultural characteristics, islands have become increasingly important tourist destinations (Lukoseviciute and Panagopoulos, 2021; Sun and Hou, 2021; Zaragozí et al., 2021). Tourism development in coastal areas shows an increasing trend (Ghafourian and Sadeghzadeh, 2022; Kim et al., 2021). Island tourism of the Caribbean and Mediterranean Seas, Pacific and Indian Oceans, and Southeast Asia rank higher. In China, Hainan, Hengsha, and Zhoushan Islands began to develop tourism on different scales in 1970. In 2010, “Several Opinions of the State Council on Promoting the Construction and Development of Hainan International Tourism Island” was released, and the construction of Hainan International Tourism Island was launched. Tourism on Hainan Island has attracted the attention of scholars with regard to how to promote the development of Hainan International Tourism Island because of its unique value and development prospects (Zhou and He, 2009; Xu, 2009; Yang et al., 2010b; Zhu and Xi, 2010). These scholars mainly focused either on analyzing the island's tourism market and marketing strategy (Zhong and Zhao, 2009; Papageorgiou and Marilena, 2016), or on strategies for promoting its internationalization (Yin, 2010; Alipour and Arefipour, 2020), to assess the development and utilization of Hainan Island's valuable tourism resources. According to the above studies, there is little research on the spatial development and utilization of Hainan Island from the perspective of tourism resources that analyzes the objectives and makes policy recommendations from the perspective of the whole region.
With the continuous development of tourism, relevant theories and case studies on the spatial structures of tourism resources have been applied. The spatial structure of tourism resources refers to the relationship or combination of resources in space, which is a collection of tourist attractions, traffic routes, and regions, and serves as important content in the analysis (Weidenfeld et al., 2010; Chen, 2015). Dredge (1999) believes that under the influence of geographical pattern, the rational spatial planning and design should build a rational tourism spatial pattern. Since the 1960s, various theories and methods, such as location theory, pole-axis theory, spatial structure theory, central place theory, and tourism geographic system models, have been widely applied in the study of tourism spatial patterns. Christler (1964) used location theory to study the structural relationship between the spatial characteristics of tourist entertainment activities and geographic space. Some other scholars extended the core-edge theory of tourism systems, having determined that the core area includes already existing tourism activities and the area with development ability in the future (Gladstone and Fainstein, 2001; Zhang and Liu, 2010). Some scholars put forward that the planning of tourism spatial patterns is conducive to dispersing the pressure of hot spots (Risteskia et al., 2012).
To explore the spatial pattern of China's tourism, the first step is to study the comprehensive regional development from the geographical perspective. Lu's point-axis spatial system structure model has been used as a reference by many scholars (Lu, 1991; Lu, 2002; Jin et al., 2013; Rahmafitria et al., 2020). In recent years, scholars have paid more attention to research on the spatial structure of tourism resources. From the study content, such research mainly focuses on the agglomeration effects of tourism resources (Hills and Lundgren, 1977) and the spatial network characteristics (Xi et al., 2004; Chen and Huang, 2006; Gan et al., 2021; Sun and Hou, 2021). In terms of research methods, the commonly used methods for spatial structure include pattern analysis, geometric models, social spatial networks and indicators including the Gini coefficient and Lorentz curve, geographical concentration index, coefficient of variation and equilibrium coefficient, and kernel density estimation (Stephen, 1989; Zhang and Zhao, 2004; Zhang, 2007; Yang et al., 2010b; Miao and Zhang, 2014; Liu et al., 2016; Liu et al., 2017a; Ma et al., 2018; Cheng, 2019).
These studies have scientifically explained the spatial characteristics and strategic choices of tourism resources. However, most of them use administrative regions as the scale to quantitatively study the spatial pattern through spatial autocorrelation and other methods. The disadvantage of this approach is that the accuracy is not high, so it is not conducive to the development of tourism resources across administrative regions. In addition, most of the current research focuses on mature tourism products, such as scenic spots and tourist areas, which are characterized by a small sample size and do not allow for the investigation of undeveloped or developing tourism resources, which are of great significance for finding a reasonable direction for the development of regional tourism resources (Liu et al., 2013). For the development of tourism resources, the theoretical research is based on the “point-axis” theory, which is qualitatively expanded and extended, and the planning pays more attention to creativity (Ho et al., 2007; Benur and Bramwell, 2015; Boo, 2019; Li and Deng, 2020). In the large and medium-sized spatial unit system, tourism resources exist in the form of individual clusters, showing a certain grouping tendency. A tourism resource cluster is not a simple superposition of various resources, but an organic combination of certain regions, environments and spaces, with the characteristics of various types, levels and combinations (Xi et al., 2004). At present, limited attention is being paid to the study of spatial patterns from the perspective of spatial combinations of tourism resources.
In view of the above problems, this paper attempts to build a framework and method for analyzing the point pattern for a large sample of data from the perspective of the spatial distribution and spatial combination of tourism resources. Taking Hainan Island as a case study area, a large amount of point vector data on the tourism resources was obtained through field investigation, and the spatial patterns of tourism resources in provincial administrative regions were analyzed. Finally, through the spatial pattern map of tourism resources, the tourism resource development area and regional tourism development ideas are explored, and a tourism development and utilization mode is formed. The research method based on a point model provides a new way of thinking for the study of the spatial pattern of regional tourism resources. This new approach, which breaks the traditional development and utilization mode of tourism resources taking administrative region as the unit, is beneficial to the comprehensive management of cross-border regions, and can accurately identify the potential areas of tourism development.

2 Case study region

Hainan Island, which is one of the exemplary island tourism cities in Hainan Province, China, is famous for its coastal tourism, tropical rain forest, and national historical culture. It is located in the southernmost part of China and is the second largest island in China after Taiwan Island, with an area of 3.39×10⁴ km2. Hainan Island has a multi-step topography, which is surrounded sequentially by mountains, terraces, plains and coasts. The island is semi-arid, with a mountainous and tropical climate in the East Asian monsoon region. The vegetation coverage rate on the island reaches 59.2%, including tropical monsoon rain forest, tropical rain forest, evergreen broad-leaved forest, mangrove forest, coniferous forest, shrub and grassland. There are many rivers, including the Nandu, Changhua, and Wanquan Rivers and others, which flow into the ocean from the central mountain range and form a radial island water system. Hainan Island has a unique coastal zone landscape, mountains, rare tropical and subtropical forest resources, rich flora and fauna, high-quality climate and environmental resources, high biodiversity, rich cultural tourism resources, and rural ethnic characteristics, so it is rich in tourism resources.
As an independent island, Hainan has rich and unique tourism resources, but there are obvious differences in the type, quality and development of the tourism resources in different areas on the island. Hainan Island has built 53 A-level scenic spots, including six 5A-level scenic spots, seventeen 4A-level scenic spots, twenty-four 3A-level scenic spots and six 2A-level scenic spots. Because of the availability of data, we selected Hainan Island as the study area for analyzing the spatial structure and development of tourism resources. The study area covers 18 municipal administrative units, including three prefecture-level cities (Haikou City, Sanya City, and Danzhou City), five county-level cities (Wuzhishan City, Wenchang City, Qionghai City, Wanning City, and Dongfang City), four counties (Ding'an County, Tunchang County, Chengmai County, and Lingao County), and six autonomous counties (Baisha Li Nationality) (Fig. 1).
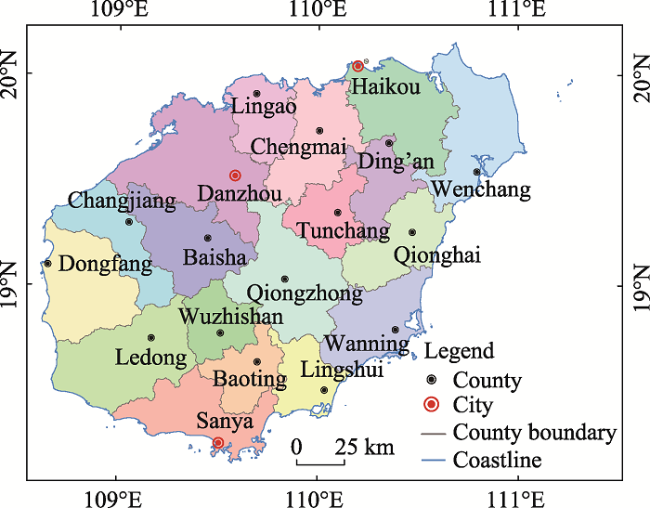
Fig. 1 Location map and administrative subdivisions of Hainan Island

3 Data and methods

3.1 Data sources and preparation

Tourism resource data for Hainan Island were acquired from five sources: Tropical forest tourism planning documents of Hainan Province, the database of the second census of geographical names, high-resolution remote sensing images, the official tourism website of Hainan Province, and a field survey in 2018. The field survey covered the entire island and 10260 spatial data points were collected, including 3696 natural tourism resources and 6564 humanistic tourism resources. However, in the related research on traditional tourism resources, there are only dozens or hundreds of samples of tourism resources in a region, and the coverage rate of resources is less than 0.1 per km2. The types of tourism resources only include developed scenic spots and a few undeveloped ones. For example, there are only 235 samples of tourism resources in Nanjing (Liu et al., 2017b). In this study, the sample size of tourism resources is much larger, and the resource coverage rate reaches 0.3 per km2. From the perspective of tourism resource types, it covers both natural and humanistic tourism resources. From the development status, it includes not only the undeveloped resources, but also the developed and developing ones. The large sample of data on the tourism resources obtained can be used not only to scientifically and accurately assess the hot spots of resources, but also to deeply analyze the spatial combination relationships between resources, and to determine the combination configuration and spatial structure of tourism resources, which have a guiding role for the key development and combined development of tourism products in the future.
The survey provided the location, type, nature, and characteristics of the tourism resources, the surrounding environment, and attribute information on the protection and development conditions. Among the investigated attributes, only the location, type and value attributes of tourism resources were used in this study. Tourism commodities and festivals within the humanistic tourism resources are non-physical tourism resources, which have the characteristics of wide-area distribution rather than specific geographic coordinates. Statistics are carried out according to administrative units, which are evenly distributed in various regions, with small spatial differences. Therefore, this study only considers 9588 physical tourism resources, excluding the tourism goods and festivals (Fig. 2). According to China's national standard, specified in “Classification, Investigation and Evaluation of Tourism Resources” (GBT 18972-2017), and on the basis of Hainan's natural environmental characteristics, entity tourism resources are divided into seven categories: geological landscapes, water landscapes, biological landscapes, astronomical phenomena and meteorological landscapes, buildings and facilities, ruins and remains, and ocean and coastal landscapes (Table 1). In addition, tourism experts, geography experts, and government officials participated in the evaluation of the values of tourism resources. This assessment was divided into five levels (Table 2). We combined the different types of tourism resources in pairs, including one combination form of humanistic, 10 of natural, and 10 of natural and humanistic tourism resources (Fig. 3).
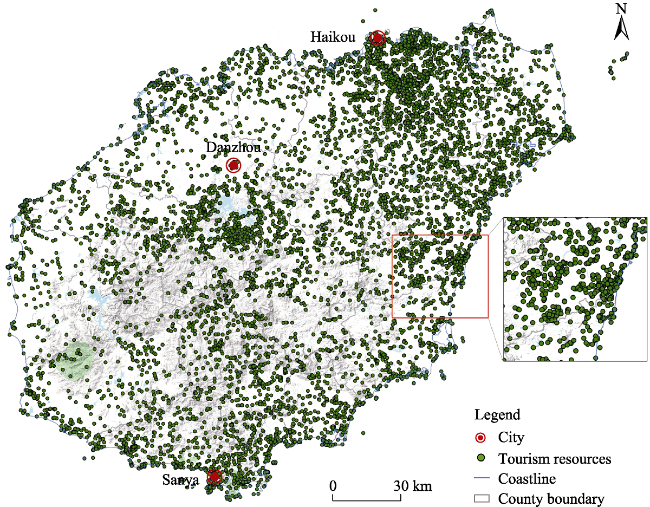
Fig. 2 Spatial location of tourism resource points within the large sample size for Hainan Island
Table 1 Classification of physical tourism resources on Hainan Island
Primary type Main type Number of tourism resources
Natural tourism resource Geographical landscapes 1640
Water landscapes 1591
Biological landscapes 253
Astronomical phenomena and meteorological landscapes 32
Ocean and coastal landscapes 180
Humanistic tourism resource Buildings and facilities 4850
Ruins and remains 1042
Table 2 Evaluation grades of tourism resources
Score Interval Grade of tourism resources
≥90 Level five
75-89 Level four
60-74 Level three
45-59 Level two
30-44 Level one
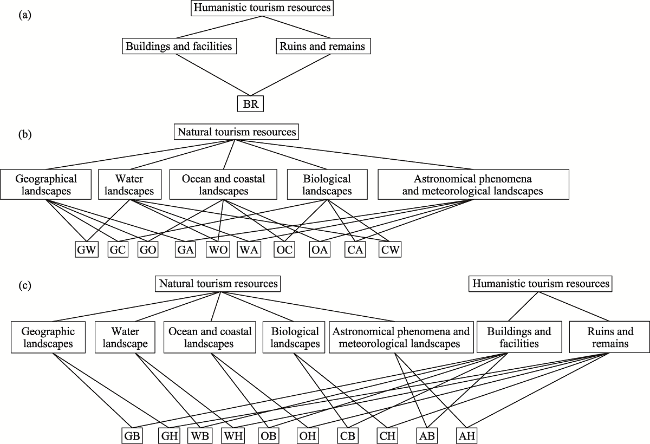
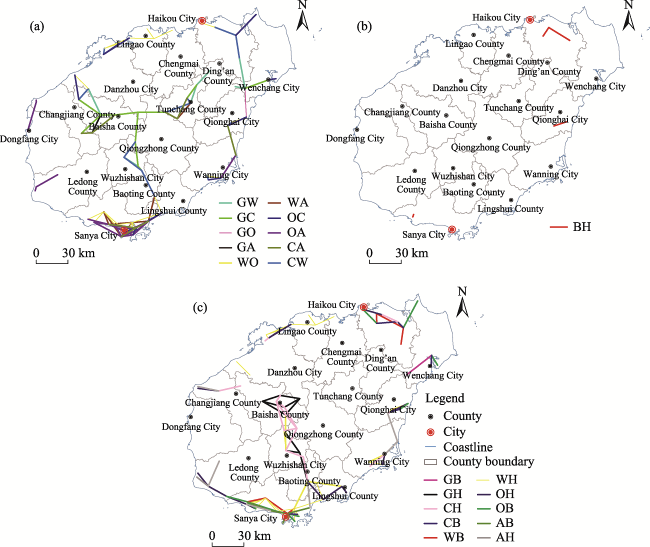
Fig. 3 Spatial composition of (a) humanistic tourism resources, (b) natural tourism resources, and (c) combination of humanistic and natural tourism resources.

Note: The abbreviations such as GW in the figure are the combination of acronyms of different main type of tourism resources.

3.2 Technical approach

According to the characteristics of multiple types, levels and combinations of tourism resources, this study collected the relevant information to establish a provincial-level tourism resource information database, and analyzed the spatial patterns and the development and utilization patterns of regional tourism resources from the perspective of space and combined characteristics by using spatial analysis methods, in order to provide a scientific basis and policy suggestions for regional tourism planning. Firstly, the multi-scale distance method was used to analyze the characteristic distance scale in the provincial region. Based on this scale, the spatial distribution characteristics of different types of tourism resources were analyzed by using the grade weighted kernel density and peak point extraction methods, and the combined analysis of different types of tourism resources was carried out by using geographic network analysis to comprehensively analyze the spatial pattern of tourism resources. Finally, according to the spatial pattern map of tourism resources, we explored the spatial development pattern of regional tourism resources, which provides a scientific basis for the layout of regional tourism products and key projects in the next step (Fig. 4).
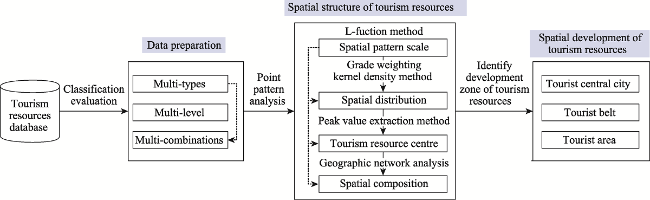
Fig. 4 Model flowchart for analyzing the spatial structure and development of tourism resources

3.3 Point pattern analysis methods

3.3.1 L-function method

The L-function, a commonly used method for point pattern analysis, judges the spatial pattern of event points according to a spatial scale, and its advantage lies in its capacity for multi-scale analysis (Ripley, 1976, 1977). It introduces the spatial scale and generates statistics for the spatial clustering according to a certain search range radius (Qian et al., 2016), which can summarize the spatial clustering or dispersion degree within a certain distance range—i.e., with a change in distance, the spatial aggregation or dispersion degree of event points changes correspondingly. In this paper, the L-function is introduced to judge the spatial distance of regional tourism resource points in the maximum aggregation state. We call this distance the characteristic scale of the tourism resource spatial pattern, and its calculation formula is as follows:
$L\left( d \right)=\sqrt{\frac{A\sum\limits_{i=1}^{N}{\sum\limits_{j=1,j\ne i}^{N}{k\left( i,j \right)}}}{\pi N\left( N-1 \right)}}$
where A is the area of the region, N is the number of points, d is the distance threshold, and $k\left( i,j \right)$ is the value of the weight. The value of a given weight is 1 when the distance between i and j is less than or equal to d and the value is 0 when the distance is greater than d. The relationship between L(d) and d can reflect the spatial pattern of tourism resources, and L(d) > 0 indicates that tourism resources are distributed in spatial aggregation; L(d) < 0 indicates that tourism resources are evenly distributed in space; and L(d) = 0 indicates that tourism resources are completely random in spatial distribution. Therefore, we can read the d value under the maximum value of L(d) from the relational graph, that is, the characteristic scale of the tourism resources spatial pattern, and further study the spatial distribution pattern and spatial combination of tourism under this characteristic scale.

3.3.2 Grade-weighted kernel density model (GW-KDE)

Kernel density estimation analysis calculates the concentration density state and trend of point elements in the whole spatial unit according to point data. In the kernel density estimation method, a kernel function is set at each point element, and the attribute of the point element is distributed within the specified threshold range (a circle with radius h). The density value is the maximum at the center position, and the attenuated density value decreases with distance until the value at the most extreme distance is 0, and the attenuation mode is determined by the kernel density function (Liu and Wang, 2016). For this purpose, researchers often use the Rosenblatt Parzen kernel estimation method (Liu et al., 2011; Heidenreich et al., 2013).
The choice of bandwidth has a critical impact on the results of kernel density analysis. When analyzing the spatial distribution difference of tourism resources, we should not only consider the distribution difference of the distance scale to the data of tourism resources, but also the spatial difference in the value of tourism resources, so as to avoid weakening the spatial differentiation characteristics of the tourism resources. We improved the kernel density model by using the grade as the weight parameter, and named it the “Grade Weighted Kernel Density Method (GW-KDE)”. Each tourism resource point is given a specific weight according to its value level, and the estimated density of each point is the weighted average density of all points in the region. The calculation formula is as follows:
$f\left( x,y \right)=\frac{1}{n{{h}^{2}}}\underset{i=1}{\overset{n}{\mathop \sum }}\,{{w}_{j}}k\left( \frac{{{d}_{i}}}{h} \right)$
In this expression, $\text{ }\!\!~\!\!\text{ }f(x,y) $ is the density estimation of the spatial position at $(x,y)$; $h$ is the bandwidth or smoothing parameter, which can be set according to the above scale L(d); ${{d}_{i}}$ is the distance from the $\text{ }\!\!~\!\!\text{ }(x,y)$ position to the observed position; n is the observed value; $k(\cdot )$ is the Gaussian kernel function; and ${{w}_{j}}$ is the weight of level j, where level 5 is 1.0, level 4 is 0.7, level 3 is 0.5, level 2 is 0.2, and level 1 is 0.1, and the weight of each level was determined through expert scoring.

3.3.3 Peak value extraction method

Central place theory plays an important role in urban spatial research, and it is also the main theoretical basis of urban spatial structure (Lin et al., 2019). At present, this theory is mostly used in the location of commercial formats and the identification of commercial centers (Xu et al., 2002; Chen et al., 2016). The distribution characteristics of different types of tourism resources are described by using the center where tourism resources are highly concentrated. The level of the tourism resource center determines its scope of influence, and it is also the basis for the selection of future scenic spot locations. We used the peak extraction method to extract the centers of different types of tourism resources from the grade-weighted kernel density map.
Firstly, the neighborhood analysis of the kernel density map is carried out, and a 3 × 3 rectangle is selected to obtain the maximum density by the maximum type. Secondly, using the condition that the maximum density reduction of the original kernel density map is equal to 0 and the original kernel density map is greater than 0, the possible peak points are obtained, and the peak points with a value of 0 are eliminated. Finally, according to the density value, the classification map of the peak points is obtained. The central level is then determined by the weighted kernel density value.

3.3.4 Geographic network model

“Combination” refers to a highly dependent and inseparable combination of tourism resources formed by several individual resources with similar geographical positions and different resource levels according to a certain landscape structure and function, and the resource level includes the type and quality level of resources and the regional space where they are located. Besides the type and value of tourism resources, the spatial distance has a great influence on the combination degree of tourism resources. Therefore, the provincial distance threshold is chosen in this study, and the better the combination of tourism resources below the distance threshold, the worse the combination. Graphs can reveal the spatial distribution patterns of geographical entities and events, as well as relationships between the geographical elements. In the field of geography, graphs describe geographical problems as arrangement patterns of points and lines that can be measured quantitatively in geographical networks. Network analysis uses graph theory to study the structure and optimization of various networks. Therefore, in this paper, the spatial combination of different types of tourism resources is analyzed by a geographic network, and the combination of different types of tourism resources is expressed by a correlation matrix. The vertices in the network graph represent the center points of different types of tourism resources, while the edges between vertices represent the combinations of different types of tourism resources. The vertex set V of graph G = (V, E) is an n-order correlation square matrix, and the edge E is a constraint function, which can be expressed as:
$G\left( {{V}_{ij}} \right)=\left[ \begin{matrix} {{v}_{11}} & {{v}_{12}} & \ldots & {{v}_{1m}} \\ {{v}_{21}} & {{v}_{22}} & \ldots & {{v}_{2m}} \\ \ldots & \ldots & \ldots & \ldots \\ {{v}_{n1}} & {{v}_{n2}} & \ldots & {{v}_{nm}} \\ \end{matrix} \right]$
${{G}_{h}}\left( {{E}_{ij}} \right)=\left\{ \begin{array}{*{35}{l}} 0\ \ \ \ \ \ \ \ \ \ \ \ (s>h) \\ \underset{i=1}{\overset{n}{\mathop \sum }}\,{{E}_{ij}}~~~~\left( s\le h \right) \\ \end{array} \right.$
where Vij is the relationship between vi and vj, which indicates the type of tourism resources; Eij is the actual number of interconnection edges between i nodes directly connected with j nodes, s is the distance between vi and vj, and h is the distance threshold calculated by the L-function in Formula (1).

4 Results and analysis

4.1 Spatial structure of tourism resources

4.1.1 Spatial structure scale of tourism resources on Hainan Island

We used the L-function to analyze the characteristic scale of the spatial distribution pattern of tourism resources on Hainan Island. As can be seen from Fig. 5, the L(d) curve of tourism resources is higher than the HiConfEnv curve (high confidence interval), which explains the clustered distribution in Hainan Island. With increasing distance, the L(d) curve gradually moves away from the d curve, reaching the highest value at 30.5 km, and then it starts to decrease at 86 km, and the L(d) curve intersects with the d curve. These results show that the aggregation degree of the spatial distribution has a maximum at 30.5 km and decreases gradually between 30.5 and 85.5 km. Therefore, 30.5 km was selected as the analysis scale for the spatial pattern on Hainan Island.
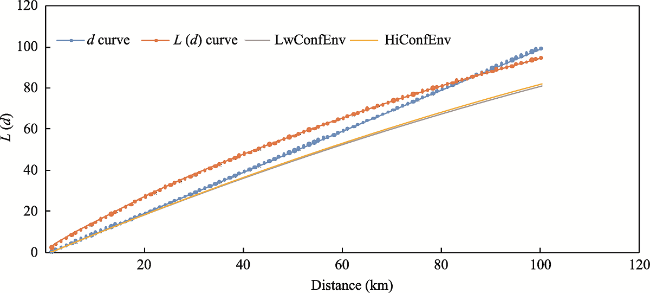
Fig. 5 L-function analysis of tourism resources

Note: d curve is Expected—Random spatial pattern; L(d) curve is Observed—Spatial patterns; LwConfEnv is lower confidence interval; HiConfEnv is higher confidence interval.

4.1.2 Spatial distribution of tourism resources on Hainan Island

Density maps of the natural and humanistic tourism resources were generated at 30.5 km using grade-weighted kernel density estimation (GW-KDE) (Fig. 6). There is a significant regional difference between the natural and humanistic spatial distributions. The spatial distribution of natural tourism resources has an obvious trend of continuous aggregation, showing a “multi-core structure” in which the density in the northeast and central south of Hainan Island is relatively high, while the density in other areas is relatively low. The cross-border areas of Baisha County and Danzhou City, Wenchang County, Ding'an County and Qionghai City form an obvious high-density area with a maximum value of 0.21. The density gradually decreases from the center to the periphery, forming a corridor with medium density between the counties and cities in the central and southern region (Fig. 6a). The area with a high density of human tourism resources presents a “single core structure” (Fig. 6b). The northern region shows a relatively high density, with a maximum density of 0.64, while the southern region shows a low density, with a maximum density of 0.26 (Fig. 6b), indicating that the density value of cultural tourism resources is significantly higher than that of the natural tourism resources.
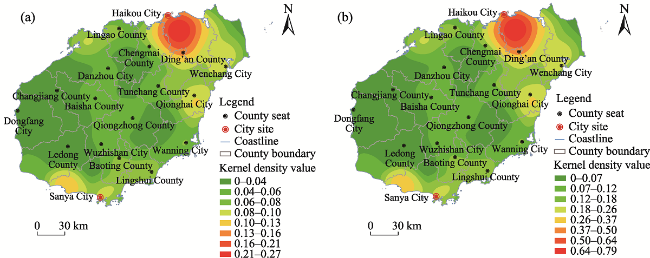
Fig. 6 Kernel density maps of (a) natural tourism resources, and (b) humanistic tourism resources.

4.1.3 Extraction and analysis of tourism resource centers on Hainan Island

Using the peak point extraction method on the grade- weighted kernel density maps, the high-value centers of the grade-weighted kernel densities of the main types of tourism resources were extracted (Fig. 7a), and the center area distributions of the different main types of tourism resources were obtained. Among the different types of centers, there are 5 geographical landscapes, 14 water landscapes, 13 biological landscapes, 10 astronomical phenomena and meteorological landscapes, 21 marine and coastal landscapes, 6 buildings and facilities, and 15 ruins and remains. On the whole, the tourism resource centers have the spatial distribution characteristics of “more in the south and less in the north”, and the distributions of different types of centers are obviously different. Marine and coastal landscapes are distributed in Sanya in the southern region, while biological and geological landscapes are distributed in Wuzhi Mountains in the central region, water landscapes are distributed throughout the whole region, buildings and facilities are distributed in Haikou in the northern region, and ruins and remains are distributed in Wuzhi Mountains area and Limu Mountains area in the central region.
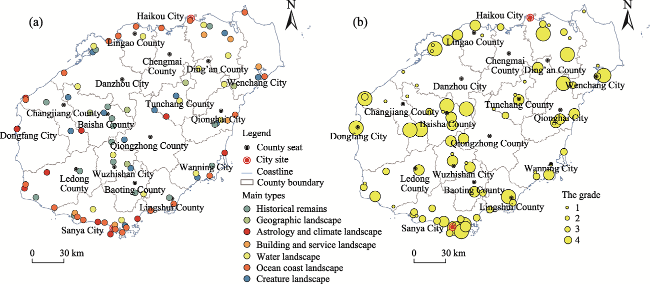
Fig. 7 (a) Center of Kernel density map, and (b) grade classification of center of Kernel density map of the main types of tourism resources.
We divided the grade-weighted kernel density values into four grades according to the natural breakpoint method, in which the fourth grade is the maximum kernel density value and the first grade is the minimum kernel density value. The results show that the high values of kernel density are mainly distributed in the southern, southeastern, and northern regions, indicating that these areas are not only rich in tourism resources, but also concentrated in value (Fig. 7b).

4.1.4 Spatial combinations of tourism resources on Hainan Island

Using the geographic network analysis method, 30.5 km was selected as the distance threshold for combining and analyzing tourism resources, and the spatial connection matrix obtained (Fig. 8) indicates the number of combined connections between the different main types. It can be seen from Fig. 8 that the combination of meteorology and ocean has the most connections, with the number reaching 28, which fully shows the island characteristics of the study area. The least connected is the combination of geographic landscapes and either ocean and costal landscapes, buildings and facilities, or astronomical phenomena and meteorological landscapes, each with only one connection.
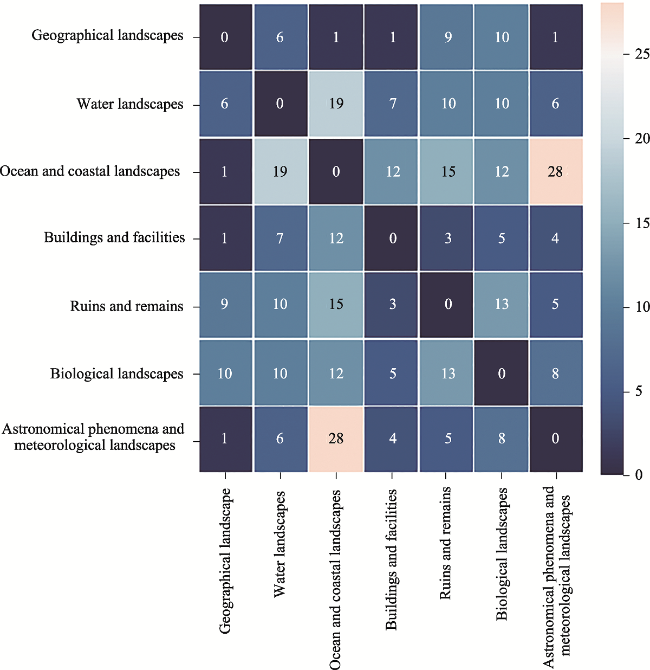
Fig. 8 Numbers of spatial combinations among the main types of tourism resources
The spatial combination map shows combinations of natural (Fig. 9a), humanistic (Fig. 9b), and both types of tourism resources (Fig. 9c). It can be seen from Fig. 9a that there is a relative concentration in the southern region, and the main landscape combinations are water area, biology, coast, and meteorology. There are many combinations between the southwestern and north-central regions, which are mainly geography and biology. There are sporadic combinations along the line from Haikou to the northeast of Wanning. It can be seen from Fig. 9b that the main humanistic combination type is architecture and historical remains, which are generally less distributed, and mainly in Haikou City in the north and Qionghai City in the east. Figure 9c shows the overall distribution characteristics of the combinations of natural and humanistic tourism resources, which are concentrated in the southeastern, northern, and central regions and scattered on the west coast. Most of the combined landscapes in the central region are historical sites and biological, water, and geological landscapes. The combined landscapes in the southern region are coast, architecture, and historical sites. The combined landscape of the northern region is coast and architecture.
Fig. 9 Spatial combinations of (a) natural, (b) humanistic, and (c) natural and humanistic tourism resources.

4.2 Identification of tourism resource development areas

4.2.1 Tourist central city

We rendered a density map using standard deviation classification, and calculated the mean of the kernel density at 30.5 km. It can be seen from Fig. 10 that the high-density region is mainly in the northwest of Hainan Island, namely the Haikou-Ding'an-Chengmai core area, whereas there is low density in the northeast, center, and south, including Qionghai, Wenchang, Baisha, Danzhou, and Sanya core area. Combined with the geomorphologic characteristics of Hainan Island, we divided the spatial distribution pattern of tourism resources into three hot spot levels in the north, center, and south: the first-level hot spot area of Haikou, the-second-level hot spot area of Qionghai-Yazhou, and the third-level hot spot area of Wenchang-Baisha-Danzhou. The first-level hot spot area mainly includes Haikou City, while the second-level hot spot area mainly includes northern Qionghai and Yazhou District of Sanya City, and the third-level central area mainly includes some towns in the south of Wenchang City, the cross-border area between Baisha and Danzhou, some towns in the vicinity of Songtao Reservoir, and Tiandu Town, Dadonghai and Luhuitoujiao in the east of Sanya.
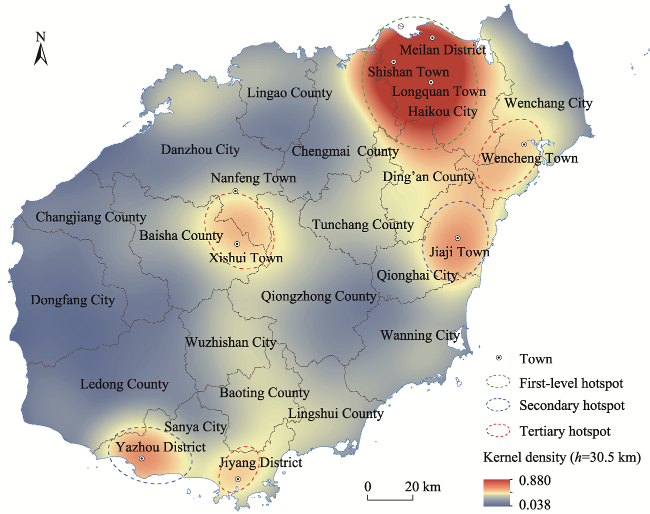
Fig. 10 Distribution pattern of tourism resource hotspots on Hainnan Island
Haikou and Sanya are the major tourist cities in Hainan Province. In addition to the richness, diversity and concentration of tourism resources, the number of scenic spots above Grade 4A in these two cities accounts for half of Hainan Province, and those in Sanya exceed those in Haikou City. In 2019, the number of tourists received by these two cities accounted for 59% of the total number of tourists received by Hainan province. The total tourism revenue of the two cities accounted for 76% of the total tourism revenue of the whole province. Therefore, good location conditions, diversified tourism resources and policy support are important factors for allowing Sanya and Haikou to develop their tourism economies. According to tourist location theory, Haikou and Sanya were selected as the major tourist centers in Hainan Province. We focused on developing them into the “windows” of Hainan's external development. At the same time, we gave full play to their radiation power in order to enhance their service functions, drive the development of surrounding cities and counties, and form the driving force of the northern and southern centers. Haikou and Sanya have taken the lead in development, which will inevitably lead to the development of surrounding cities and counties. From the perspective of tourism centers, the growth poles are the second-class and third-class tourism centers, which rely on the first-class tourism center. Therefore, the development of Qionghai, Baisha, Wenchang and Haitang District depends on the development of the first-class tourism center.

4.2.2 Tourist belts

By analyzing the spatial distribution characteristics of the natural and humanistic tourism resources, a “one horizontal and three vertical” distribution pattern, or belt, is formed, which shows that the resources are highly concentrated in the northern urban area, the western and the eastern coast belts, and the central mountainous area (Fig. 11). The developmental directions of these regional resources are as follows: humanistic tourist belt, humanistic holiday tourist belt, coastal tourist belt, and tropical rainforest tourist belt.
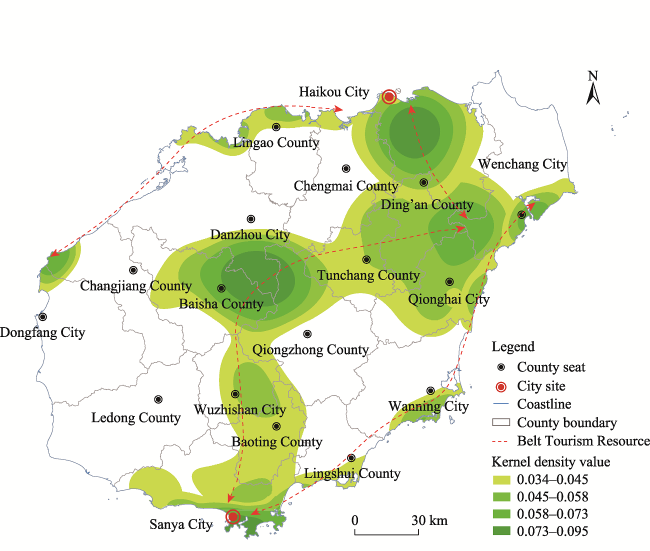
Fig. 11 Distribution pattern of the tourism resource belts on Hainan Island
The northern humanistic tourist belt is comprehensively developed around Haikou City and the surrounding counties, which aims at building a Qiongbei tourism circle, developing products such as businesses, exhibitions, and humanistic tourism, and building a humanistic tourism platform of the Maritime Silk Road. The western humanistic holiday tourist belt is represented by key projects such as Haihua Island, Dongpo culture, and Qiziwan, and an international tourist resort is built on the west coast of Hainan Island. The eastern coastal tourist belt focuses on the developmental direction of coastal tourism and vacationing, and has built characteristic tourism resources such as coastal and rainforest vacations, and a first-class, internationally-renowned tropical destination in Asia. The tropical rainforest tourist belt in the central mountainous area is guided by the construction of Hainan Tropical Rainforest National Park, focusing on tropical agri-humanistic tourism, forest ecological vacations, tropical rainforest viewing, and other products, so as to enhance the tourism development level in the Qiongzhong area and form a tourism service consumption center in central Hainan Island.
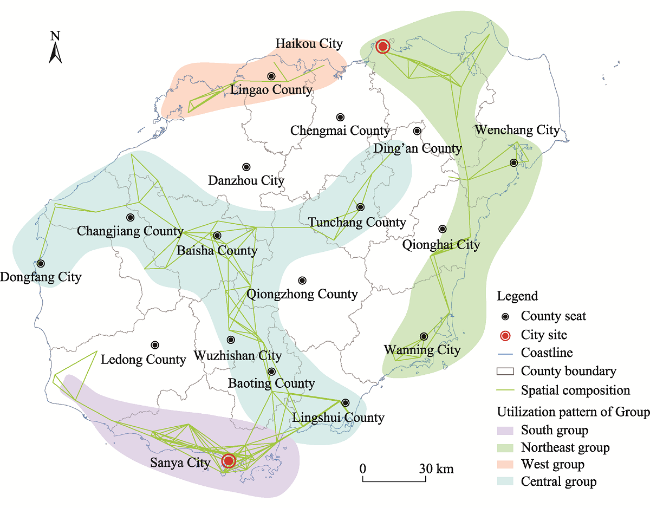
Fig. 12 Distribution pattern of tourism resource combined areas on Hainan Island

4.2.3 Tourist areas

According to the spatial distribution of tourism resources on Hainan Island, there are four combined areas: Haikou- Wenchang-Qionghai-Wanning in the northeastern region, Sanya-Ledong in the southern region, Lingao-Danzhou in the western region, and Dongfang-Changjiang-Baisha- Tunchang-Ding'an-Wuzhishan-Baoting-Lingshui in the central region (Fig. 12).
The northeastern combined area is centered in Haikou, which acts as the tourism hub for the whole province. This area is characterized by coastal, volcanic landforms, and large-scale modern theme park tourism. In the aspect of tourism resource development, it has the advantages of passenger flow and the investment policy of the Hainan tourism hub. With Sanya as the center, the southern combined area is mainly characterized by developing coastal holiday and modern theme park tourism resources. As a mature tourist destination, Sanya has developed excellent natural resources, but the development of humanistic resources still needs to be strengthened, and theme park tourism projects are also among the future development goals. With Lingao County and Danzhou City as the center, the western combined area forms a combination characterized by coastal tourism resources and comprehensive artificial tourist resorts. The development of combined areas in the western portion lags behind, but the opening of bullet train routes has created better traffic conditions for the development of tourism in western Hainan Island. The central combined area takes Wuzhishan City as the center, which is the ecological treasure of Hainan Island. It is rich in biological resources and has great development potential, mainly for tropical island ecological rainforest tourism.

4.3 Suggestions for regional common development based on cross-border tourism on Hainan Island

By combing the distributions of tourism resources on Hainan Island, the cross-border characteristics of tourism resources are obvious. For example, many tourism resources are concentrated in the cross-border area between Wuzhishan City and Baoting County. Baoting County has developed into an AAAAA-level “Canada Tropical Rainforest Cultural Tourism area”, while the tropical rainforest area located in Wuzhishan City is a nature reserve with weak accessibility, but since the local economy is relatively backward it has not been rationally developed so far. Due to the division of tourism resources by the administrative divisions, these two counties have considered their respective interests in the actual development process, which has led to many drawbacks and problems.
The attractive value of regional tourism resources depends not only on the abundance and grade of the resources themselves, but also on the position of tourism resources in the regional space and the combined structure with neighboring resources. The combination of tourism resources in the region is in good condition, and different types of resources complement each other. These factors can produce a superposition effect, form compound value, and have comprehensive attractiveness to tourists, which is beneficial for promoting the comprehensive development of regional tourism resources. The complementarity of tourism resources and the resulting advantages determine that the development of tourism resources must change from a single isolated development focus to a more wholistic combined development mode. As it is difficult for Wuzhishan City to develop itself and attract powerful investments from developers, it is more important to integrate tourism development in the administrative border areas with Baoting County, jointly develop tourism resources, build complementary tourism product groups and establish cross-border tourism coordination organizations.

5 Discussion

Whether the spatial structure of tourism resources is reasonable or not has a direct impact on the developmental trend of tourism in tourism destinations (Wu et al., 2017). In the research on the spatial structure of existing tourism resources, there is a lack of analysis and mining of potential tourism resources, and their combination relationships in geographical space are ignored. Taking Hainan Island as an example, this paper puts forward a new method to describe the spatial structure of tourism resources and identify potential development areas by using point pattern analysis. Compared with research on the spatial structure of tourism resources, which only takes mature scenic spots as the research object and considers traffic routes, the spatial structure description based on a large sample size and the point pattern analysis method in our approach greatly improves the accuracy and objectivity, and the resulting spatial structure map of tourism resources can be directly used to identify potential development zones of cross-border tourism resources.
The main values of this study are three-fold.
(1) We have collected point data for a large number of tourism resources, including those that have been developed, are being developed and could be developed. The classification and evaluation of tourism resources proved that tourism resources have the characteristics of multi-types, multi-levels and multi-combinations. Especially for provincial-scale cities, these tourism resource points are accurate in describing the spatial structure.
(2) This paper puts forward a point pattern analysis method to describe the spatial structure of tourism resources. Taking the distance threshold of the spatial structure of tourism resources as the analysis scale and the value of tourism resources as the consideration factor for the spatial distribution of tourism resources, the center and grade distribution of tourism resources are extracted, and the spatial combinations of different types of tourism resources are analyzed. The method of point pattern analysis can not only accurately describe the spatial structure of tourism resources, but it can also provide reference for other types of regional spatial analysis.
(3) This paper describes the spatial structure of tourism resources in Hainan Island by using a point pattern analysis method, determines the tourism resource development zones in Hainan Island according to the spatial structure map of tourism resources, and puts forward recommendations for regional common development based on cross-border tourism in Hainan Island. According to the development trend of tourism resources in Hainan Island, it is promoted from east to west, from south to north, from land and sea, taking the layout of infrastructure and new tourism formats along the high-speed rail system and airport around the island as the starting point, focusing on building products such as national parks, rural tourism, recreation and health care, and coastal tourism, and promoting the formation of a comprehensive tourism product system.
This study only discusses the spatial characteristics of tourism resources, while it ignores the influences of development conditions such as location and transportation, and lacks an analysis of the spatial distribution law of tourism resources under different development conditions. Determining how to deepen the influences of tourism resources in different developing states on regional tourism development will be the focus of future research.
In this study, only the physical tourism resources were studied in depth, while ignoring the humanistic non-physical tourism resources with a time series, such as myths and legends, celebrity anecdotes, historical events and festivals, which have no specific geographical entities, but instead have wide-area distribution characteristics and tend to disappear. In a later stage, grid methods can be used to further deepen the related research of non-physical tourism resources and further explore the connotation of regional cultural tourism. As for the physical tourism resources, we only discuss the spatial relationships among tourism resources, while ignoring the external development conditions, such as location, transportation, environment, etc., and this study lacks an analysis of the spatial distribution law of tourism resources under different development conditions. Determining how to deepen the developmental direction of tourism resources and the planning path of tourism products under different development conditions will be the focus of future research.

6 Conclusions

(1) Based on the large amount of sample data for tourism resources, starting from the characteristics of multi-type, multi-level and multi-combination, this paper puts forward a framework and method for analyzing the spatial structure of tourism resources. In this method, the characteristic scale of regional spatial structure is determined, and the kernel density method considering resource value is modified under this spatial scale. Combined with the central place theory, the extraction method of the tourism resource center is formed by using the peak extraction method. Finally, a geographic network model is constructed to analyze the spatial combinations of tourism resources.
(2) Taking Hainan Island as an example, this paper conducts an empirical analysis on the spatial structure of tourism resources on Hainan Island. The characteristic scale of the spatial structure of tourism resources on Hainan Island is 30.5 km, and there are significant differences in the distributions of all kinds of tourism resources. The high-value areas of humanistic tourism resource density are distributed in the northern main city, showing a single core structure; while the high-value areas of natural tourism resource density are mainly distributed in the central mountainous areas and the southern coastal areas, showing a multi-core structure. Tourism resources combining nature with humanities are concentrated in the southeastern, northern and central regions. Through the spatial structure diagram of tourism resources, the tourism resource development zones are identified, including three tourism center levels, “one horizontal and three vertical” tourism belts and four major tourism combination areas.
(3) By combing the distribution of tourism resources and development zones in Hainan Island, the cross-border characteristics of tourism resources and development zones are obvious. Because tourism resources are divided according to administrative regions, there are obvious differences in tourism development between neighboring regions. In order to give full play to the spatial combination and superposition effect of tourism resources, it is suggested to change from a single isolated development mode to one involving the overall combined development between regions.
[1]
Alipour H, Arefipour T. 2020. Rethinking potentials of co-management for sustainable common pool resources (CPR) and tourism: The case of a Mediterranean Island. Ocean & Coastal Management, 183(1): 104993. 1-104993.14.

[2]
Benur A M, Bramwell B. 2015. Tourism product development and product diversification in destinations. Tourism Management, 50(10): 213-224.

DOI

[3]
Boo C S. 2019. A study on the priority analysis for development of tourism resources in the island area: Focused on ChuJa-Ialand. Journal of Tourism and Leisure Research, 31(7): 5-21.

[4]
Chen J F. 2015. A study on the spatial distribution and influencing factors of china's class A tourist resorts. Diss., Hangzhou, China: Zhejiang Gongshang University. (in Chinese)

[5]
Chen W S, Liu L, Liang Y T. 2016. Retail center recognition and spatial aggregating feature analysis of retail formats in Guangzhou based on POI data. Geographical Research, 35(4): 703-716. (in Chinese)

DOI

[6]
Chen X Q, Huang F C. 2006. Research on tourism spatial structure and its optimization: A network analysis. Geography and Geo-Information Science, 22(5): 75-80. (in Chinese)

[7]
Cheng Z. 2019. Study on the optimization of spatial structure of desert tourism resources in China based on the social network analysis. Inner Mongolia Science Technology & Economy, (8): 10-12. (in Chinese)

[8]
Christaller W. 1964. Some considerations of tourism location in Europe: The peripheral regions-under-developed countries-recreation areas. Papers of the Regional Science Association, 12(1): 95-105.

[9]
Dredge D. 1999. Destination place planning and design. Annals of Tourism Research, 26(4): 772-791.

DOI

[10]
Gan C, Voda M, Wang K, et al. 2021. Spatial network structure of the tourism economy in urban agglomeration: A social network analysis. Journal of Hospitality and Tourism Management, 47(6): 124-133.

DOI

[11]
Ghafourian S, Sadeghzadeh M. 2022. Coastal tourism planning using GIS-based system: The case of Shirud Coast, Caspian Sea, Mazandaran, Iran. GeoJournal, 87: 3231-3248.

DOI

[12]
Gladstone D L, Fainstein S S. 2001. Tourism in US global cities:A comparison of New York and Los Angeles. Journal of Urban Affairs, 23(l): 23-40.

[13]
Heidenreich N B, Schindler A. Sperlich S. 2013. Bandwidth selection for kernel density estimation: A review of fully automatic selectors. ASTA Advances in Statistical Analysis: A Journal of the German Statistical Society, 97(4): 403-433.

DOI

[14]
Hills T L, Lundgren J. 1977. The impact of tourism in the Caribbean: A methodological study. Annals of Tourism Research, 4(5): 248-267.

DOI

[15]
Ho K Y, Dae H K, Jeong S C, et al. 2007. Relation between tourism attractions as marine tourism resources and tourism development type in Dok-do. Journal of Tourism & Leisure Research, 19(2): 407-425.

[16]
Jin D, Song B P, Gao N. 2013. Spatial structure of tourism in Shanxi Province based on “Pole-Axis” theory. Journal of Arid Land Resources and Environment, 27(5): 196-202. (in Chinese)

[17]
Kim G S, Chun J Y, Kim Y J, et al. 2021. Coastal tourism spatial planning at the regional unit: Identifying coastal tourism hotspots based on social media data. ISPRS International Journal of Geo-Information, 10(3): 167. DOI: 10.3390/ijgi10030167.

DOI

[18]
Li J H, Deng W L. 2020. Research on creative development of mountain sports tourism products in Guizhou Province based on RMP analysis. Journal of Xingyi Normal University for Nationalities, (6): 44-49. (in Chinese)

[19]
Li Y Z. 2011. Research on development and utilization of tourism resources in Nanjing based on spatial structure analysis. Acta Agriculturae Jiangxi, 23(5): 178-181. (in Chinese)

[20]
Lin Q, Sun F, Wang X M, et al. 2019. Hierarchical system of Beijing commercial center judged from POI data. Journal of Beijing Normal University (Natural Science), 55(3): 415-424. (in Chinese)

[21]
Liu A L, Yang C Y, Ming Q Z. 2017a. Analysis of spatial structure of mountain tourism resources in western mountainous cities-Take Liupanshui as an example. Journal of Liupanshui Normal University, 29(6): 1-6. (in Chinese)

[22]
Liu C G, Wang D G. 2016. Spatial effects and development pattern of creative tourism resource: A case study of center city of Suzhou. Geographical Research, 35(5): 977-991. (in Chinese)

[23]
Liu D J, Xie S Y, Chen J Z, et al. 2013. Evolution models for the spatial structure of regional tourist scenic spots system based on Fractal Theory: A case study of Wuhan. Economic Geography, 33(4): 155-160. (in Chinese)

[24]
Liu J, Li Y Y, Lin C, et al. 2016. Spatial pattern of the tourism resource of Yangtze River Tourism Belt. Resources and Environment in the Yangtze Basin, 25(7): 1009-1015. (in Chinese)

[25]
Liu Q. 2018. Study on spatial analysis and development strategies of tourism resources in Wufeng Town. Diss., Chengdu, China: Chengdu University of Technolgy. (in Chinese)

[26]
Liu R, Hu W P, Wang H L, et al. 2011. The road network evolution of Guangzhou-Foshan metropolitan area based on Kernel density estimation. Scientia Geographica Sinica, 31(1): 81-86. (in Chinese)

DOI

[27]
Liu S L, Zhang Z K, Juck Z, et al. 2017b. Study on the spatial structure characteristics of regional tourism resources-Taking Nanjing as an example. Journal of Shanghai Normal University (Natural Science Edition), 46(4): 590-598. (in Chinese)

[28]
Lu D D. 1991. Research on the development of geography and regional development. Scientia Geographica Sinica, 11(3): 197-206. (in Chinese)

[29]
Lu D D. 2002. Formation and dynamics of the “Pole-Axis” spatial system. Scientia Geographica Sinica, 22(1): 1-6. (in Chinese)

[30]
Lukoseviciute G, Panagopoulos T. 2021. Management priorities from tourists' perspectives and beach quality assessment as tools to support sustainable coastal tourism. Ocean & Coastal Management, 208(7): 105646. DOI: 10.1016/j.ocecoaman.2021.105646.

DOI

[31]
Ma H H, Xie Y Y, Wang X L. 2018. Spatial pattern of tourism resources in Beijing-Tianjin-Hebei region. Journal of Hebei Normal University (Natural Science Edition), 42(5): 82-90. (in Chinese)

[32]
Miao H, Zhang M. 2014. Spatial structure of intangible heritage in Northwest China based on GIS analysis. Journal of Arid Land Resources and Environment, 28(4): 179-186. (in Chinese)

[33]
Mills S. 2010. National and regional tourism planning-Methodologies and case studies. Tourism Management, 16(4): 183-205.

[34]
Papageorgiou M. 2016. Coastal and marine tourism: A challenging factor in marine spatial planning. Ocean & Coastal Management, 129(9): 44-48.

[35]
Qian L H, Wang S Q, Li Z S, et al. 2016. Research on spatial pattern of rockslide geological disaster for Yanji Area based on Ripley's K Function. Geomatics & Spatial Information Technology, 39(1): 55-57. (in Chinese)

[36]
Rahmafitria F, Pearce P L, Oktadiana H, et al. 2020. Tourism planning and planning theory: Historical roots and contemporary alignment. Tourism Management Perspectives, 35: 100703. DOI: 10.1016/j.tmp.2020.100703.

DOI

[37]
Ripley B D. 1976. The second-order analysis of stationary point processes. Journal of Applied Probability, 13(2): 255-266.

DOI

[38]
Ripley B D. 1977. Modelling spatial patterns. Journal of the Royal Statistical Society: Series B (Methodological), 39(2): 172-192.

[39]
Risteskia M, Kocevskia J, Arnaudov K. 2012. Spatial planning and sustainable tourism as basis for developing competitive tourist destinations. Procedia-Social and Behavioral Sciences, 44: 375-386.

DOI

[40]
Stephen L, Smith J. 1989. Tourism analysis. New York, USA: Longman Group UK Ltd.

[41]
Sun Y Y, Hou G L. 2021. Analysis on the spatial-temporal evolution characteristics and spatial network structure of tourism eco-efficiency in the Yangtze River Delta urban agglomeration. International Journal of Environmental Research and Public Health, 18(5): 2577. DOI: 10.3390/ijerph18052577.

DOI

[42]
Weidenfeld A, Butler R W, Williams A M. 2010. Clustering and compatibility between tourism attractions. International Journal of Tourism Research, 12(1): 1-16.

DOI

[43]
Wu H J, Zhao G J, Wu Y Y. 2008. Research on spatial layout planning of regional tourism: A case study of Liaoning Province. Tourism Forum, 19(4): 45-48, 101. (in Chinese)

[44]
Wu Q, Li X G, Wu L, et al. 2017. The spatial pattern and development of the tourism resources in Wuling Mountainous Region of Hubei. Journal of Natural Science of Hunan Normal University, 40(2): 17-24. (in Chinese)

[45]
Xi J C, Ge Q S, Chen S K, et al. 2004. Tourism resource population: Conception, spatial structure, exploiting potentiality: A case study of the Han Buddhism Temple tourism resource. Resources Science, 26(1): 91-98. (in Chinese)

[46]
Xu J W. 2009. On the construction of Hainan International Tourism Island. Market Modernization, (3): 202-203. (in Chinese)

[47]
Xu X Q, Zhou S H, Ling G. 2002. Layout analysis of large retail stores in Guangzhou. Urban Planning, 26(7): 23-28. (in Chinese)

[48]
Yang W, Liu H L, Zhao W J. 2010a. GIS-based evaluation, analysis and planning of tourism resources in Yanqing. Science of Surveying and Mapping, 35(3): 129-131. (in Chinese)

[49]
Yang Z Z, Guo L, Cai K X. 2010b. Introduction to the study of holiday-making: Providing references for the construction of Hainan International Tourism Island. Tourism Tribune, 25(9): 12-19. (in Chinese)

[50]
Yin Z J. 2010. Research on Hainan tourism marketing strategy based on the background of international tourism island construction. The New Orient, (2): 20-25. (in Chinese)

[51]
Zaragozí B, Trilles S, Gutiérrez A. 2021. Passive mobile data for studying seasonal tourism mobilities: An application in a Mediterranean Coastal destination. ISPRS International Journal of Geo-Information, 10(2): 98. DOI: 10.3390/ijgi10020098.

DOI

[52]
Zhang J H, Zhao Y. 2004. Analysis on the spatial structure of tourism resources in the South of Anhui Province. Geography and Geo-Information Science, 20(1): 99-103. (in Chinese)

[53]
Zhang J P, Chang X L, Cao Y Y. 2007. GIS-based spatial analysis of tourism resources in Yantai-Weihai region. Science of Surveying and Mapping, 32(6): 182-184. (in Chinese)

[54]
Zhang L Y, Liu W. 2010. European-Book review cultural heritage protection and revelation to China on cultural resources for tourism: Patterns, process and policies. World Regional Studies, 19(3): 168-176. (in Chinese)

[55]
Zhong X D, Zhao Y. 2009. SWOT analysis of Hainan building an international tourist island. E-Business Journal, (6): 52-55. (in Chinese)

[56]
Zhou J Q, He W J. 2009. Five problems to be solved urgently in the construction of Hainan International Tourism Island. The New Orient, (1): 79-82. (in Chinese)

[57]
Zhu R Q, Li H, Peng M. 2012. An analysis of the spatial structure of county territory tourism resource: A case study of Dingyuan County in Anhui Province. Journal of Shijiazhuang University, 14(3): 68-73. (in Chinese)

[58]
Zhu S Q, Xi L L. 2010. Enlightenment of foreign island tourism development experience on Hainan international tourism island construction. Journal of Hubei University of Economics: Humanities and Social Sciences, 7(5): 50-51. (in Chinese)

Outlines

/