Tourism Resource and Ecotourism

Research on Ecological Carrying Pressure in the Greater Dunhuang Region based on the Relationship between Supply and Consumption

  • WEN Xin , 1, 2, 3 ,
  • YAN Huimin , 1, 3, * ,
  • DU Wenpeng 1, 3
Expand
  • 1. Institute of Geographic Sciences and Natural Resources Research, Chinese Academy of Sciences, Beijing 100101, China
  • 2. Institute of Soil and Water Conservation, Chinese Academy of Sciences and Ministry of Water Resources, Yangling, Shaanxi 712100, China
  • 3. University of Chinese Academy of Sciences, Beijing 100049, China
* YAN Huimin, E-mail:

WEN Xin, E-mail:

Received date: 2021-08-20

  Accepted date: 2022-03-20

  Online published: 2022-10-12

Supported by

The Strategic Priority Research Program of Chinese Academy of Sciences(XDA20010202)

The National Key Research and Development Program of China(2016YFC0503505)

Abstract

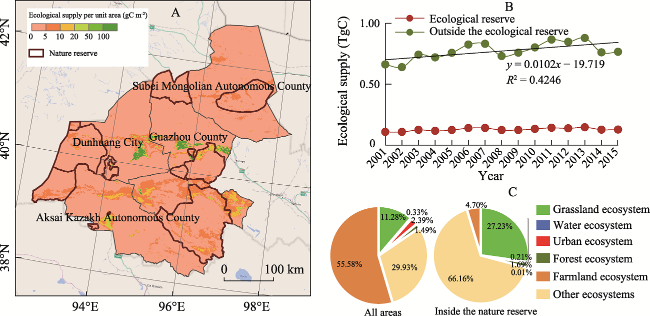
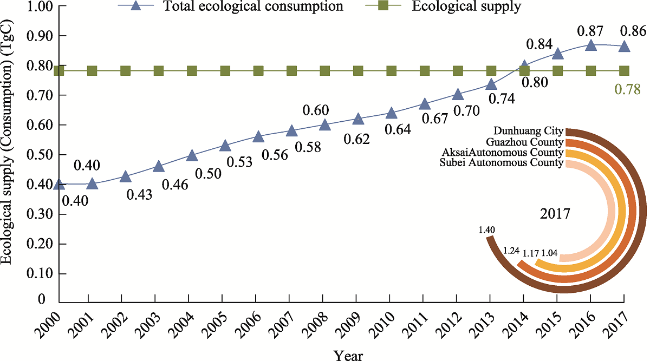
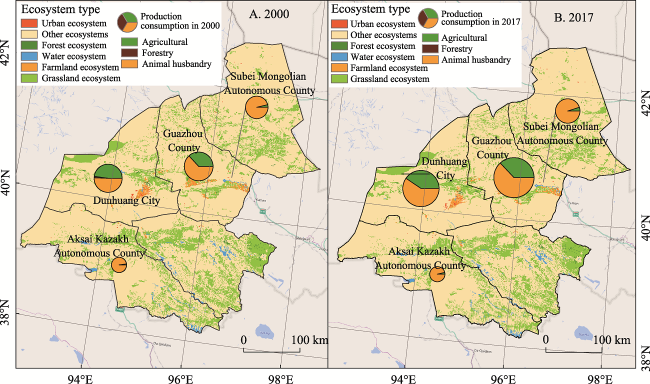
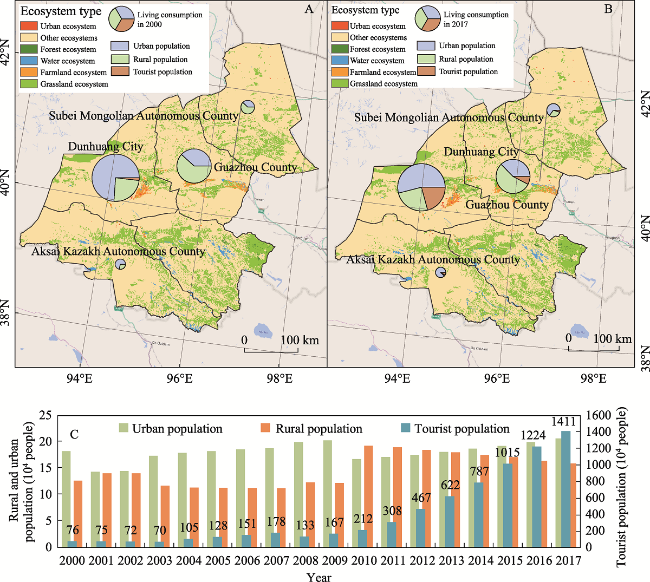
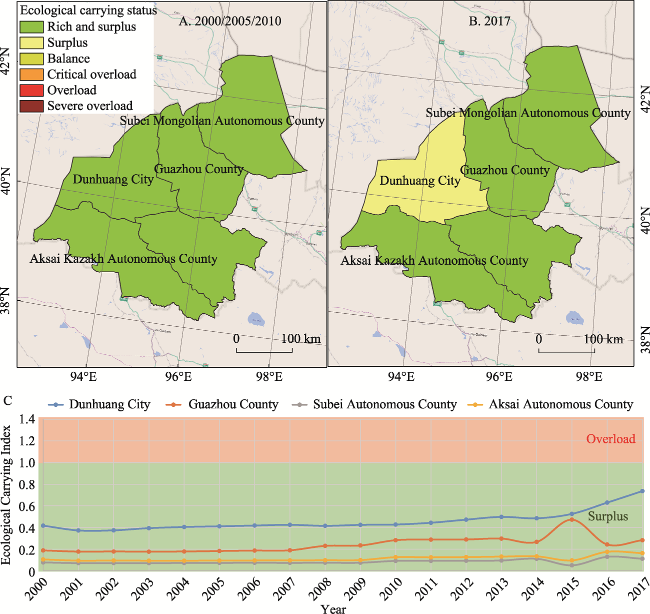
The Greater Dunhuang Region has experienced ecological degradation in the past 100 years caused by human factors such as ecological immigration, expansion of arable land, and the construction of reservoirs. At present, through the restoration of various ecological projects, the progress of ecological deterioration has slowed down. Ensuring that the development and construction of the Greater Dunhuang Region Cultural Tourism Economic Circle does not threaten ecological security is the top priority of the regional sustainable development plan. Based on the balance between supply and consumption of the ecosystem, this study assesses the pressure of ecological consumption in the Greater Dunhuang Region, and analyzes the patterns and trends in the ecological carrying status. The results reveal three important aspects of the ecological carrying pressure in this Region. (1) After 2000, the ecological supply in the Greater Dunhuang Region experienced a fluctuating growth trend. In the entire ecosystem, the farmland ecosystem provides more than 55% of the ecological supply, and areas with relatively high supply capacity are concentrated in a small number of valleys. (2) The Greater Dunhuang Region is under greater production pressure and there is less pressure from living consumption. The production consumption intensity has exceeded the ecological supply since 2014. The production and consumption structure of the Greater Dunhuang Region is dominated by animal husbandry production and consumption, accounting for more than 65% of the total production and consumption. (3) The Greater Dunhuang Region has been in a state of rich and surplus from 2000 to 2017. However, Dunhuang City turned into a surplus state in 2017 due to the pressure of the fast-growing tourist population. The Greater Dunhuang Region urgently needs to alleviate the ecological pressure through the development of eco-friendly industries. It is necessary to develop an ecological protection resource utilization model that focuses on the development of ecological and cultural services in pastoral areas to ease the pressure on the ecosystem from animal husbandry production.

Cite this article

WEN Xin , YAN Huimin , DU Wenpeng . Research on Ecological Carrying Pressure in the Greater Dunhuang Region based on the Relationship between Supply and Consumption[J]. Journal of Resources and Ecology, 2022 , 13(6) : 1048 -1057 . DOI: 10.5814/j.issn.1674-764x.2022.06.010

1 Introduction

From the founding of the People's Republic of China in 1949 to the end of the 20th century, as the population continued to increase, the scale of agricultural development continued to expand, resulting in the excessive use of water resources in the Greater Dunhuang Region and the continuous deterioration of its ecological environment (Ma, 2011; Zhang, 2016; Qi, 2017). From the end of the 20th century to the present, under the guidance of ecological protection policies, the deterioration of the ecological environment in the Greater Dunhuang Region has been reversed, and the state of the ecological environment has generally improved. Through joint operation of the upper and lower reaches of the Shule River reservoirs, optimization of dispatching, new and expanded water delivery channels, and new hydropower stations, the middle reaches of the Shule River are basically stable (Zhang, 2016).
The development goal of the development plan for the Greater Dunhuang Region in 2025 is to attract 7.03×10⁷ tourists. The rapid development of the tourism industry will inevitably have an impact on the industrial structure and ecological conditions. Therefore, understanding the dynamic change process of the ecosystem carrier in the Greater Dunhuang Region, and quantitatively analyzing the ecological pressure status in the Greater Dunhuang Region are of great significance in the formulation of policies for the sustainable development of the region's ecology and social economy.
Since Imhoff et al. (2004) published the results of a study on the global human consumption and occupation of terrestrial ecosystem net primary productivity in Nature in 2004, the ecosystem has been measured by Net Primary Production (NPP). Supply capacity, using NPP consumption to measure the human consumption and occupation of the ecosystem's productivity supply, and discussing the ecosystem's ability to support human production and life and its self-sustainability, has become one of the main methods for the ecological assessment of regional sustainable development (Haberl et al., 2007; Yan et al., 2012; Du et al., 2018), and has gradually developed into an important method for ecological carrying capacity assessment. This method is based on the balance of supply and consumption, and it focuses more on finding an ecological threshold for sustainable development, while NPP can be directly measured by remote sensing data. Therefore, “NPP consumption” has become an indicator of ecosystem consumption that can not only indicate the extent of human occupation of the ecosystem, but also reflect its spatial pattern. Judging the stress state of an ecosystem through the balance in the relationship between the supply and consumption of the ecosystem has become an important measure of ecological carrying capacity (Lobell et al., 2002; Jin, 2009; Liu, 2014).
This paper analyzes the ecological carrying capacity for the counties and cities in the Greater Dunhuang Region from 2000 to 2017 from the perspective of ecological supply-consumption balance. It describes the temporal and spatial evolution of ecological supply and ecological consumption in Dunhuang, and estimates the pressure of production and living activities on the supply capacity of ecological resources. This study aims to provide a basis for the sustainable regional planning under the circumstances of the rapid development of tourism and agriculture.

2 Data and methods

2.1 Study area and data sources

2.1.1 Study area

The Greater Dunhuang Region is located at the westernmost end of the Hexi Corridor in Gansu Province. With Dunhuang as the core, it includes Guazhou County, Aksai Kazakh Autonomous County and Subei Mongolian Autonomous County with a total area of 1.534×10⁵ km2. There are vast unused patches of land in the Greater Dunhuang area, which account for more than 60% of the total land area. The area of farmland is less than 17% of the total area, mainly distributed in the central valley. Grassland accounts for about 20% of the total area. The water area is less prominent, at less than 0.1%. The climate of the Greater Dunhuang Region is arid, the water shortage is serious (Ma, 2011; Zhang et al., 2016; Qi, 2017), and the ecological environment is fragile (Cheng, 2007). In its historical development, it has been affected by a variety of factors such as ecological migration, population growth, expansion of arable land, and the construction of reservoirs. The area of wetlands in the Greater Dunhuang Region has shrunk, and natural vegetation has been degraded year by year (Ma, 2011; Zhang, 2016; Qi, 2017).
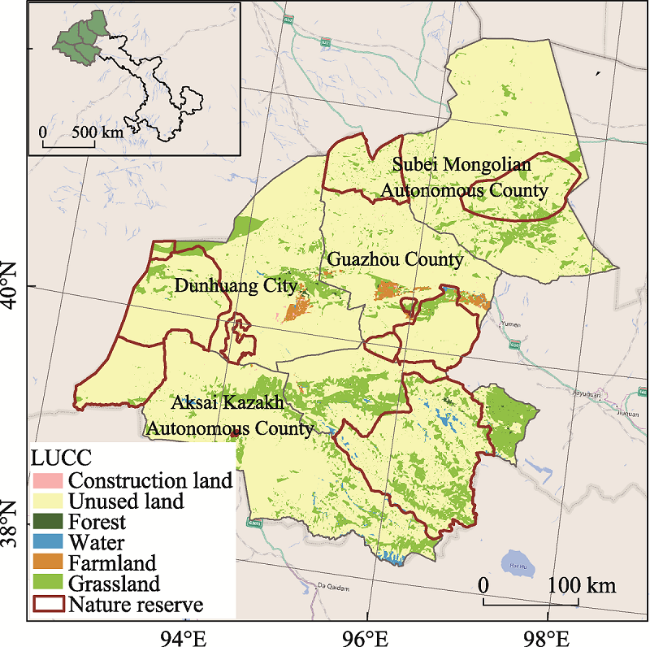
Fig. 1 Land use and land cover in the Greater Dunhuang Region

2.1.2 Data

The data used in this study include land use and land cover data (LUCC), ecosystem NPP, economic statistics, and ecological protection zone data. The NPP data is based on the 2000-2016 Gross Primary Production (GPP) data developed by Zhang et al. (2017) through the Vegetation Photosynthesis Model (VPM), and the NPP data calculated by the autotrophic respiration ratio has a spatial resolution of 500 m and a temporal resolution of 8 days. After pre- processing, such as data downloading and splicing, the total annual NPP was calculated and projected to the positive axis equal area cut conic projection to facilitate obtaining area statistics. The data unit was converted to gC m‒2 yr‒1.
Economic statistics came from the 2000-2017 Jiuquan City Statistical Yearbook, Dunhuang City Statistical Yearbook, Guazhou County Statistical Yearbook, Aksai Kazakh Autonomous County Statistical Yearbook, and Subei Mongolian Autonomous County Statistical Yearbook. These data mainly include the population, crop output, livestock inventory, and food consumption of the Greater Dunhuang Administrative Region and each of the counties and cities. The land use classification data came from LUCC 2015 land use data with a spatial resolution of 30 m. The data for the ecological protection area was the data of five national nature reserves (West Lake National Nature Reserve, Yangguan National Nature Reserve, Anxi Jihan Desert National Nature Reserve, Yanchi Bay National Nature Reserve, Annanba Wild Camel National Nature Reserve) and five provincial nature reserves (Yadan Geological Relics Provincial Nature Reserve, Tangdun Lake Provincial Nature Reserve, Mazong Mountain Ibex Provincial Nature Reserve, Large and Little Sugan Lake Provincial Nature Reserve) after vectorization.

2.2 Method

2.2.1 Ecological supply

The NPP supply (SNPP) was calculated as the multi-year average value of NPP from 2000 to 2017. NPP was estimated by a satellite-based model and VPM, which is based on the concept that leaves and canopy can be divided into chlorophyll-bearing and non-photosynthetic parts. VPM divides the proportion of photosynthetically active radiation absorbed by the vegetation canopy into the chlorophyll absorption part and the non-photosynthetic vegetation absorption part. Only the former is used for photosynthesis (Xiao et al., 2004a; Xiao et al., 2004b). The NPP obtained by the VPM model was then spatially superimposed with the LUCC data. There are 10 national and provincial nature reserves in the Greater Dunhuang area, and the ecosystem in the nature reserves cannot provide for production and living activities. Therefore, in this study, the above-ground ecological resources outside the protected area were supplied as NPP (SNPP).

2.2.2 Ecosystem consumption

Ecological consumption includes production consumption and living consumption. Production consumption (CNPPp) refers to the consumption of ecosystem supplies in the production process of agriculture, animal husbandry and forestry. Living consumption (CNPPl) refers to the consumption of food, meat, eggs, milk, fruits, vegetables and other necessities of life that consume the supply of the ecosystem.
(1) Production consumption (CNPPp)
For agricultural production consumption (Lobell et al., 2002; Shi and Fan, 2009; Xie et al., 2011; Zhu et al., 2014) (CNPPpa):
$CNP{{P}_{pa}}=\underset{i=1}{\overset{n}{\mathop \sum }}\,\frac{YI{{E}_{i}}\times \left( 1-M{{C}_{i}} \right)}{H{{I}_{i}}\times \left( 1-WA{{S}_{i}} \right)}\times FC$
where CNPPpa represents agricultural production consumption (gC); i represents the type of crop; YIEi represents the yield of crop i (g); MCi represents the water content of crop i (%); HIi represents the harvest coefficient of crop i; WASi represents the crop loss coefficient; FC represents the conversion coefficient between plant biomass and carbon content (gC g‒1), and the initial value of the model is set to 0.45.
For calculating the consumption of livestock production to the supply of the ecosystem (Imhoff et al., 2004; Imhoff and Bounoua, 2006) (CNPPpg), it is necessary to convert all types of livestock (in this research area mainly goats, sheep, camels, horses, and cattle) and poultry into standard sheep numbers (NUM):
$NUM=\underset{i\text{=1}}{\overset{n}{\mathop \sum }}\,{{N}_{i}}\times {{\eta }_{i}}$
where NUM represents the number of standard sheep (heads), Ni represents the number of various types of livestock, ηi represents the conversion coefficients between various types of livestock, and i represents the types of livestock (including: cattle, goat, sheep, horses, etc.).
Then, the consumption of animal husbandry production (CNPPpg) is calculated as follows:
$CNP{{P}_{pg}}=NUM\times GW\times GD\times \left( 1-MC \right)\times FC\times 1000$
where CNPPpg represents animal production consumption (gC); NUM represents the number of standard sheep (heads); GW represents the weight of hay (kg d‒1), the initial value in the model is set to 1.8 kg d‒1; GD represents the number of grass-grazing days (days), for the stock animal it is 365 days, for the slaughter animal it is 180 days; MC represents the moisture content of dried grass (%), the initial value in the model is set to 14%; and FC represents the conversion coefficient of plant biomass and carbon content (gC g‒1), the initial value in the model is set to 0.45.
For consumption of forestry production to ecosystem supply (Dixon et al., 1994) (CNPPpf):
$CNP{{P}_{pf}}=F\left( CUT \right)\times FC'$
where CNPPpf represents forestry production consumption (gC); CUT represents forest resource harvesting (m3); F(.) represents the conversion function of biomass and stock volume of different forest types; and $FC'$ represents the conversion coefficient between forest carbon storage and biomass (gC g‒1), and the initial value in the model is set to 0.5.
For the total production consumption (CNPPp):
$CNP{{P}_{p}}=CNP{{P}_{pa}}+CNP{{P}_{pf}}+CNP{{P}_{pg}}$
where CNPPp represents total production consumption (gC), and CNPPpa, CNPPpf and CNPPpg represent agricultural production consumption, forestry production consumption and animal husbandry production consumption (gC), respectively.
(2) Living consumption (CNPPl)
For domestic daily consumption of agricultural products (CNPPla):
$CNP{{P}_{la}}=\frac{FOOD\times \gamma \times 1-Mc\times Fc}{HI\times \left( 1-WAS \right)}$
where CNPPla represents the daily consumption of agricultural products, FOOD represents the consumption of agricultural products, γ represents the conversion coefficient, Mc represents the moisture content of the agricultural products, HI represents the agricultural harvest index, WAS represents the crop loss coefficient, and Fc represents the conversion coefficient between biomass and carbon content (gC g‒1), the initial value in the model is set to 0.45.
For living consumption of livestock products (CNPPls):
$\begin{align} & CNP{{P}_{ls}}=\frac{MEM\times \gamma \times \tau \times (1-Mc)\times Fc}{HI\times \left( 1-WAS \right)}+ \\ & \ \ \ \ \ \ \ \ \ \ \ \ \ \ \frac{MEM\times \varphi \times \omega \times (1-Mc)\times Fc}{HI\times \left( 1-WAS \right)} \\ \end{align}$
where CNPPls represents the daily consumption of livestock products, MEM represents the consumption of meat, eggs and milk, γ represents the conversion coefficient, τ represents the conversion ratio, φ represents the grass folding coefficient, ω represents the grass folding ratio, Mc represents the water content, HI represents the harvest index, WAS represents the loss coefficient of food crops, and Fc represents the conversion coefficient between biomass and carbon content (gC g‒1), with the initial value in the model set to 0.45.
For living consumption (CNPPl)
$CNP{{P}_{l}}=CNP{{P}_{la}}+CNP{{P}_{ls}}$
where CNPPl means daily living consumption, CNPPla means daily consumption of agricultural products, and CNPPls means consumption of livestock products.

2.2.3 Ecological carrying capacity and ecological pressure state

The state of ecological carrying pressure is characterized by the ecological pressure index, which is evaluated from the direct pressure of production consumption on the local ecosystem and the indirect pressure of residents' living consumption on the ecosystem.
(1) The pressure of production consumption on the ecosystem
Under the restriction of the ecological protection zone:
$IN{{X}_{p}}=\frac{CNP{{P}_{p}}}{SNPP}$
where INXp represents the production bearing pressure index without the constraints of the ecological protection zone; SNPP is the ecological supply without the constraints of the ecological protection zone, that is the ecological supply; and CNPPp represents the consumption of production.
(2) The pressure of residents' living consumption on the ecosystem
Under the restriction of the ecological protection zone:
$IN{{X}_{l}}=\frac{CNP{{P}_{l}}}{SNPP}$
where INXl represents the life bearing pressure index without the constraints of the ecological protection zone; SNPP is the ecological supply without the constraints of the ecological protection zone, that is the ecological supply; and CNPPl represents the consumption of life.
Under the restriction of the ecological protection zone:
$IN{{{X}'}_{l}}=\frac{CNP{{P}_{l}}}{SNP{{P}_{l}}}$
where INXl' is the life bearing pressure index under the constraints of the ecological protection zone; SNPPl is the ecological supply under the constraints of the ecological protection zone, that is the ecological supply; and CNPPl represents the consumption of life.
According to the bearing pressure index and the classification standard of ecological pressure status (Feng et al., 2008; Feng et al., 2014) (Table 1), the ecological pressure status of the Greater Dunhuang Region can be evaluated.
Table 1 Classification standard table for the ecological pressure state
Ecological Pressure State Index <0.6 0.6-0.8 0.8-1.0 1.0-1.2 1.2-1.4 >1.4
Ecological pressure state Rich and surplus Surplus Balance Critical overload Overload Severe overload

3 Results and analysis

3.1 Status of ecosystem supply

The multi-year average value of ecological supply in the Greater Dunhuang Region is 0.92 TgC, and the ecological supply in the ecological reserve is 0.14 TgC, accounting for approximately 14.70% of the total ecological supply. After 2000, due to the protection policies implemented by the government, the total ecological supply of Dunhuang from 2001 to 2017 showed a fluctuating growth trend. The ecological supply increased from 0.78 TgC to 0.90 TgC, for a growth rate of 15.38%. The ecological supply in the ecological reserve basically maintained a stable state of 0.11-0.15 TgC, and the protective effect of the ecological reserve was obvious. Among the entire ecosystem of the Greater Dunhuang Region, the farmland ecosystem provided more than 55% of the ecological supply, which shows the important position of the farmland ecosystem in the Greater Dunhuang Region. There was a lot of unused land in the reserve, and 66% of the ecological supply in the reserve was from other ecosystems (Fig. 2C).
Fig. 2 The structure, changes and spatial distribution of ecological supply in the Greater Dunhuang Region from 2001 to 2015.

3.2 Ecological consumption

3.2.1 Production consumption

The production consumption of Dunhuang and its “one city and three counties” showed a continuous growth trend. The total production consumption increased from 0.40 TgC to 0.86 TgC in 2017, for a growth rate of 116.14% (Fig. 3). The intensity of production consumption has exceeded the ecological supply since 2014 and the pressure of production consumption was very high. From 2000 to 2017, the total production consumption of the “one city and three counties” of Dunhuang showed a continuously increasing trend. The largest increases in Guazhou County and Dunhuang City were each more than doubled. In 2017, Dunhuang City, Guazhou County, Subei County and Aksai County exceeded the ecological supply in the region. Among them, the production consumption of Dunhuang City was 1.40 times of the ecological supply. Therefore, the production consumption pressure in the Greater Dunhuang Region is very high.
Fig. 3 The change trend of the production pressure index in the Greater Dunhuang Region from 2000 to 2017, and in 2017 by county.
The production consumption structure of Dunhuang is dominated by animal husbandry production consumption, which accounts for more than 65% of the total production consumption, while the agricultural production consumption accounts for between 20% and 35% of the total production consumption (Fig. 4). Among the counties, the proportions of animal husbandry production consumption in the two minority counties of Aksai County and Subei County were higher than 95% from 2000 to 2017. From the perspective of comparing 2000 and 2017, with the exception of Dunhuang's animal husbandry production consumption which accounted for an increase of over 8%, the production consumption structure of the other three counties remained basically unchanged.
Fig. 4 The proportions of agriculture, forestry and animal husbandry production consumption at the county level in the Greater Dunhuang Region.

3.2.2 Living consumption

From 2000 to 2017, the total living consumption of the “one city and three counties” of the Greater Dunhuang Region showed a fluctuating upward trend. The living consumption increased from 0.18 TgC in 2000 to 0.25 TgC in 2017, a growth rate of 41.31%, but it did not exceed the ecological supply, and the pressure of life consumption remained small. Due to the eating habits and food consumption structure of the population in each county, Subei County had the largest per capita living consumption, with a value of 1.04 MgC. Analyzed from the structure of living consumption, the living consumption of the Greater Dunhuang Region is dominated by the living consumption of the urban population and the living consumption of the permanent population. The living consumption of the tourist population has been increasing, reaching a maximum of 15.14% in 2017. The rapid increase in tourism consumption is due to the growing tourist population. The tourist population in the Greater Dunhuang Region increased from 7.57×10⁵ in 2000 to 1.41×10⁷ in 2017, so the tourist population increased by more than 17-fold (Fig. 5C). The tourism industry in Dunhuang is the most developed. The living consumption of the tourist population accounts for 20.81% of the total living consumption, and it is the county with the largest tourist population in the “one city and three counties”. From 2000 to 2017, the living consumption of the tourist population in Dunhuang City increased by 19.01%, while the living consumption of the tourist population in the other three counties accounted for less than 10% of the total living consumption.
Fig. 5 The urban population, rural population and tourist population living consumption at the county level in the Greater Dunhuang Region from 2000 to 2017.

3.3 Ecological pressure state

In general, based on the ecological supply, the Greater Dunhuang Region was in a state of surplus from 2000 to 2017 (Fig. 6C). As far as the counties are concerned, according to ecological supply, in 2000, 2005, 2010 and 2017, the ecological pressure status levels of Guazhou, Subei and Aksai states are all rich and surplus (Fig. 6A). In 2017, the state of ecological pressure in Dunhuang City became surplus (Fig. 6B), which was mainly due to the rapid growth of the tourist population in Dunhuang City. Therefore, it is necessary to take adaptive response measures as soon as possible, e.g., to promote the development of resource- saving consumption patterns, establish an intercommunication mechanism, and supplement the ecological resources in various regions in order to relieve the pressure on the consumption of local ecological resources due to the rapid growth of the tourist population in the “one city, three counties”.
Fig. 6 The changes and distribution of the ecological pressure status levels of the counties in the Greater Dunhuang
Region—based on ecological supply
The population carrying pressure in the Greater Dunhuang Region from 2000 to 2017 was relatively small, and the population carrying pressure was in a state of either rich and surplus or surplus. From 2000 to 2017, the production consumption pressure in Dunhuang City, Guazhou County and Aksai County was relatively high. The production consumption pressure of Dunhuang City and Guazhou County in 2014-2017 was critically overloaded, and the production consumption pressure of Aksai County was critically overloaded in 2013, 2014 and 2016. These levels show the need for remote resources to supply local production activities.
According to the estimation of production consumption pressure based on the ecological supply, the ecological consumption pressure in Subei County was relatively small. The production consumption pressure of Subei County from 2000 to 2017 was in a state of either rich and surplus, surplus or balance. The production consumption pressure in Dunhuang City, Guazhou County and Aksai County was relatively high. The production carrying pressure of Aksai County in 2000-2012, 2015 and 2017 was in a state of either rich and surplus or balance. In 2013, 2014, and 2016, the production consumption exceeded the ecological supply, and the production consumption pressure was in a critical overload state. Guazhou County and Dunhuang City were in a state of either surplus or balance from 2000 to 2013. In 2014-2017, production consumption exceeded the ecological supply, and production consumption pressure was critically overloaded. These levels show that the production activities in Aksai County, Guazhou County and Dunhuang City exceed the local ecological supply, and the resources of the off-site ecosystem need to be consumed to supply local production activities.

4 Discussion

From 2000 to 2017, the production consumption of the “one city and three counties” in Dunhuang, continued to increase, especially the production consumption of grassland animal husbandry, and the pressure of production consumption continued to increase. It is difficult for local resources to meet local production consumption, and adaptive response measures need to be taken to reduce the pressure due to livestock production consumption. Since 2014, the production consumption has been 0.80 TgC, which has exceeded the ecological supply, and production consumption pressure is very high. In the production consumption, animal husbandry production consumption accounts for more than 65% of the total production consumption, making it the main source of production consumption pressure. The production consumption of animal husbandry is putting increasing pressure on the ecosystem, and it is urgent to alleviate that ecological pressure through the development of eco-friendly industries.
At present, the development and utilization of tourism resources in grassland and pastoral areas is still lacking. It is necessary to transform the traditional ecological consumption model based on animal husbandry and breeding, to develop an ecological conservation resource utilization model that focuses on the development and utilization of the ecological and cultural service functions of pastoral areas, and to improve the efficiency in the use of ecological resources. These measures can provide a new source of livelihood for herders and ease the pressure on the ecosystem from animal husbandry production.
Pastoral tourism can provide new sources of livelihood for herders. It can be transformed from the traditional consumption-type direct use of ecological supply (livestock production) to the protection-type development and use of ecological system cultural services (such as folk landscape and production experience). In 2017, Dunhuang received 9.01×10⁶ tourists and the tourism revenue reached 9.28×10⁹ yuan, while the production consumption exceeded the ecological supply by 0.08 TgC (equivalent to about 3.80×10⁵ goats overgrazing). Therefore, it is necessary to attract about 7.50×10⁵ tourists to achieve the same economic benefits as reduced grazing.

5 Conclusions

This study estimates the pressure of human production and living activities on the supply capacity of ecological resources, and evaluates the ecological pressure status of the ecosystems of the counties and cities in the Greater Dunhuang Region from 2000 to 2017. The analysis produced three main results.
(1) After 2000, as affected by the protection policies implemented by the government, the ecological supply in the Greater Dunhuang Region from 2001 to 2017 showed a fluctuating growth trend. Within the total ecosystem in the Greater Dunhuang Region, the farmland ecosystem provides more than 55% of the ecological supply, and 66% of the ecological supply in the reserve is from other ecosystems.
(2) The pressure of production in the Greater Dunhuang Region is greater, and the production consumption intensity has exceeded the ecological supply since 2014. The production consumption is dominated by animal husbandry, accounting for more than 68% of the total consumption. Although the ecological problems, such as the dry-off of the Shule River Basin that occurred in the past few decades, have been improved since the end of the 20th century, the increasing pressure of livestock breeding in pastoral areas has brought more attention to the stress on the ecological environment of the grassland pastoral areas.
(3) The Greater Dunhuang Region was in a state of rich and surplus from 2000 to 2017. From 2000 to 2017, the tourist population in the Greater Dunhuang area increased by as much as 17-fold. In 2017, Dunhuang City's ecological pressure turned from rich into surplus, mainly due to the rapid growth of the tourist population in Dunhuang City.
With the rapid development of fragile ecosystem protection and the tourism population in the construction of ecological civilization, it is necessary to take early measures to promote the development of a resource-saving consumption model for the Greater Dunhuang Region, so as to alleviate the ecological pressure through the development of eco-friendly industries. In order to reduce the pressure from livestock production on the ecosystem, it is necessary to provide new sources of livelihood for the herders. It is also necessary to establish a supplementary exchange mechanism for off-site ecological resources. Only in these ways can the pressure from the rapid growth of the tourist population on the consumption of local ecological resources be relieved.
Table 3 Changes in population carrying pressure and production consumption pressure at the county scale of the Greater Dunhuang Region

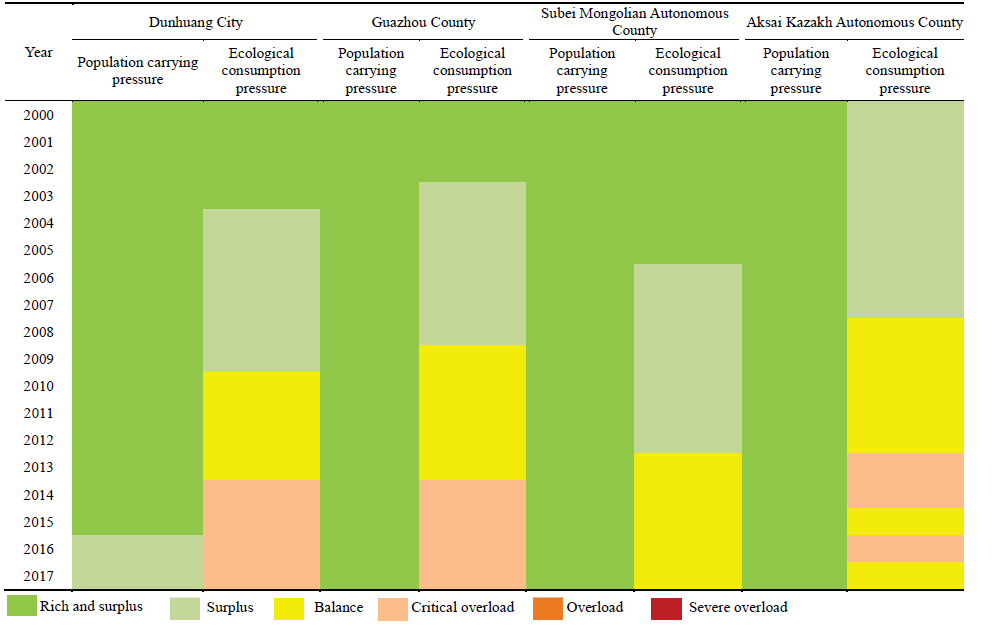
Note: Due to missing data for Guazhou County from 2005 to 2010, these data were obtained by SPSS interpolation analysis.

[1]
Cheng G. 2007. Research on the conservation and development of Greater Dunhuang. Diss., Lanzhou, China: Lanzhou University. (in Chinese)

[2]
Du W P, Yan H M, Yang Y Z, et al. 2018. Evaluation methods and research trends for ecological carrying capacity. Journal of Resources and Ecology, 9(2): 115-124.

DOI

[3]
Feng Z M, Yang Y Z, You Z. 2014. A study on the restriction and limitation of land resources in China's population distribution. Geographical Research, 33(8): 1395-1405. (in Chinese)

[4]
Feng Z M, Yang Y Z, Zhang J. 2008. Research on China's land resource carrying capacity based on the relationship between human and food: From county to country. Journal of Natural Resources, 23(5): 865-875. (in Chinese)

[5]
Haberl H, Erb K H, Krausmann F, et al. 2007. Quantifying and mapping the human appropriation of net primary production in earth's terrestrial ecosystems. Proceedings of the National Academy of Sciences of the USA, 104(31): 12942-12947.

DOI

[6]
Imhoff M L, Bounoua L. 2006. Exploring global patterns of net primary production carbon supply and demand using satellite observations and statistical data. Journal of Geophysical Research: Atmospheres, 111(D22). DOI: 10.1029/2006JD007377.

DOI

[7]
Imhoff M L, Lahouari B, Taylor R, et al. 2004. Global patterns in human consumption of net primary production. Nature, 429(6994): 870-873.

DOI

[8]
Jin L. 2009. Research on Ecological Suitability and Carrying Capacity of Dunhuang Tourism. Diss., Lanzhou, China: Lanzhou University. (in Chinese)

[9]
Lobell D B, Hicke J A, Asner G P, et al. 2002. Satellite estimates of productivity and light use efficiency in United States agriculture, 1982-1998. Global Change Biology, 8(8): 722-735.

DOI

[10]
Liu S S. 2014. Analysis of the carrying capacity of the tourism environment in Dunhuang. Diss., Lanzhou, China: Northwest Normal University. (in Chinese)

[11]
Ma L B. 2011. Study on the evolution and driving factors of the ecological environment of Dunhuang City. Diss., Lanzhou, China: Lanzhou University. (in Chinese)

[12]
Piao S L, Fang J Y, Ciais P, et al. 2010. The carbon balance of terrestrial ecosystems in China. China Basic Science, 458(7241): 1009-1013. (in Chinese)

[13]
Qi J H. 2017. Study on the ecological evolution of oasis in the Shule River Basin. Diss., Lanzhou, China: Lanzhou University. (in Chinese)

[14]
Shi P J, Fan H B. 2009. Research on the Population Carrying Capacity of Cultivated Land Resources in the Loess Hilly and Gully Region: A Case Study of Gansu Dingxi. Northwest Population, 30(6): 66-71. (in Chinese)

[15]
Song Z F, Xue Y. 2017. A major breakthrough in Dunhuang's ecological governance, the Dang River returned to the embrace of the Shule River. Gansu Daily, 2017-11-15(3). (in Chinese)

[16]
Xiao X M, Hollinger D, Aber J, et al. 2004a. Satellite-based modeling of gross primary production in an evergreen needleleaf forest. Remote Sensing of Environment, 89(4): 519-534.

DOI

[17]
Xiao X M, Zhang Q Y, Braswell B, et al. 2004b. Modeling gross primary production of temperate deciduous broadleaf forest using satellite images and climate data. Remote Sensing of Environment, 91(2): 256-270.

DOI

[18]
Xie G H, Wang X Y, Han D Q, et al. 2011. Harvest index and straw coefficient of non-cereal field crops in China. Journal of China Agricultural University, 16(1): 1-8. (in Chinese)

[19]
Yan H M, Liu J Y, Huang H Q, et al. 2012. The impact of urbanization and returning farmland to forests and grasses on the productivity of cultivated land in China. Acta Geographica Sinica, 67(5): 579-588. (in Chinese)

[20]
Zhang Y, Xiao X M, Wu X C, et al. 2017. A global moderate resolution dataset of gross primary production of vegetation for 2000-2016. Scientific Data, 4(1): 1-11.

[21]
Zhang Y W. 2016. Analysis of the impact of the changes in the Shule River on the Dunhuang West Lake Wetland. Diss., Beijing, China: Tsinghua University. (in Chinese)

[22]
Zhu X J, Wang Q F, Zheng H, et al. 2014. Research on the temporal and spatial variability of carbon consumption in the use of agricultural and forestry products in China's terrestrial ecosystems from 2001 to 2010. Quaternary Research, 34(4): 762-768. (in Chinese)

Outlines

/