Resource Use and Resource Economy

Spatio-temporal Dynamic Evolution and the Factors Impacting Eco-efficiency in Chengdu-Chongqing Economic Circle

  • LI Hongli , 1 ,
  • CHEN Yunping , 2, *
Expand
  • 1. Institute of Jiangxi Economic Development, Jiangxi Normal University, Nanchang 330224, China
  • 2. School of Finance, Jiangxi Normal University, Nanchang 330224, China
* CHEN Yunping, E-mail:

LI Hongli,E-mail:

Received date: 2021-08-25

  Accepted date: 2022-02-01

  Online published: 2022-09-09

Supported by

The National Natural Science Foundation of China(71774074)

The Social Science Foundation of Jiangxi Province(15WTZD09)

Abstract

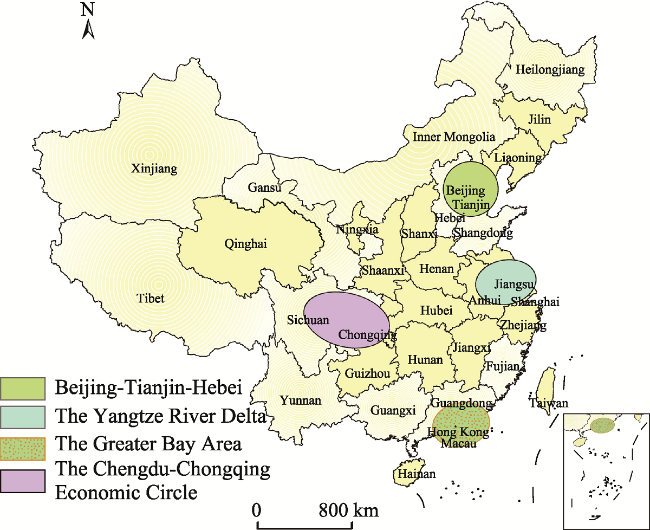
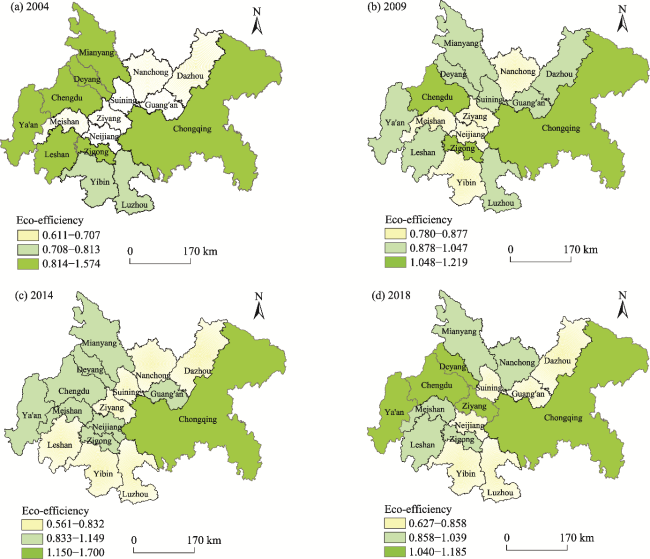
In response to the 14th National Five-year Plan of China and to better explore new strategies for promoting regional coordinated green development, the eco-efficiency values of Chengdu-Chongqing Economic Circle and the corresponding temporal analysis from 2004 to 2018 were assessed in this paper using the super-SBM model and Markov chain. Meanwhile, the spatial analysis of eco-efficiency was conducted by a geographically weighted regression model. Although eco-efficiency has risen at an increasing rate, the economic development of Chengdu-Chongqing Economic Circle was still ecologically ineffective. This means there is an urgent need to improve the efficiency of resource utilization and promote technological innovation. During the study period, the evolution of the eco-efficiency presented as a “π” shape, and was accompanied by the phenomenon of “club convergence”. There was also a strong tendency for eco-efficiency to maintain the original status quo, which indicates that it lacked sufficient momentum for improvement, so it was difficult to achieve a leapfrog transfer. Spatially, the eco-efficiency was distributed from northwest to southeast in a high-low-high manner. The spatial-temporal differences of eco-efficiency narrowed but the effect of agglomeration was relatively weak and there was a polarization trend. Further investigation suggests that the differences in the development level of urbanization, opening, technology, environmental regulation and advancement of industrial structure led to the spatial differences of eco-efficiency. Each city in the Economic Circle should make every effort to improve eco-efficiency accordingly, and thus to promote the green development of the whole region, so as to lay a foundation for driving the green and coordinated development of the central and western regions.

Cite this article

LI Hongli , CHEN Yunping . Spatio-temporal Dynamic Evolution and the Factors Impacting Eco-efficiency in Chengdu-Chongqing Economic Circle[J]. Journal of Resources and Ecology, 2022 , 13(6) : 986 -998 . DOI: 10.5814/j.issn.1674-764x.2022.06.004

1 Introduction

The report of the 19th National Congress of the Communist Party of China (CPC) shows that China's economy has shifted from a high-speed growth period to high-quality development stage. Within this context, the new development concept of innovation, coordination, green, opening and sharing was put forward. Green development has always been the important point of economic development, emphasizing that neither economic development nor environmental protection should be neglected. Therefore, promoting the construction of ecological civilization has become a crucial issue in China. According to the outline of the 14th Five-year Plan (CPC Central Committee and State Council, 2021a), Beijing-Tianjin-Hebei, the Yangtze River Delta, the Greater Bay Area and the Chengdu-Chongqing Economic Circle serve as the four major economic growth pillars among China's 19 urban agglomerations. Thus, it is a matter of course to investigate the degree of green development in those four regions, because this is one of important subtopics of economic development. Doing so will be beneficial for urging the green development of the remaining urban agglomerations, thereby improving the coordination of regional green development. However, the degree of green development in the Yangtze River Delta, Beijing-Tianjin-Hebei region, and the Greater Bay Area have often been measured and discussed, but similar studies of the Chengdu-Chongqing Economic Circle are rare although it is now gaining increasing attention. In 2016, Chengdu-Chongqing Economic Circle became China's fourth national economic circle (NDRC of China, 2016). In 2020, the review of The outline for the construction of Chengdu- Chongqing Economic Circle began on October 16, and it was officially issued on October 20, 2021 (CPC Central Committee and State Council, 2021b), which made the development of the Chengdu-Chongqing Economic Circle fairly important and a key national strategy of China. Therefore, it is reasonable to investigate the degree of green development in the Chengdu-Chongqing Economic Circle. Given that the future will be an era focusing on “internal circulation”, the strategic backup channels to be built in China are related to Chengdu-Chongqing, so it is crucial to enhance the level of China's inland opening and to lead the development of the western region. The policy makers can also draw lessons from studies of the inadequacies of the green development of Chengdu-Chongqing Economic Circle and the exploration of its influencing factors. These lessons will help it to catch up with the development of the Yangtze River Delta, Beijing-Tianjin-Hebei region and the Greater Bay Area, so as to coordinate and drive the development of the central and western regions and to promote the coordinated development of these regions.
Ecological efficiency (i.e., eco-efficiency) has been used as a proxy for the degree of green development by many scholars, and it is a measure of the degree of coordination of economic development, resource utilization and environmental protection (Sun et al., 2016). Eco-efficiency aims to optimize resource utilization, industrial investment and scientific technological development, while minimizing energy consumption and pollution emissions (Schmidheiny and Zorraquin, 1996). The concept of eco-efficiency was first raised in 1990, and it refers to the ratio of the economic value of economic activity output to environmental pollution. In 1992, it was further expanded to the extent that resource efficiency and environmental performance were included (World Business Council for Sustainable Development, i.e., WBCSD, 1996). In 1998, the OECD (Organization for Economic Co-operation and Development, 1998) developed a definition of eco-efficiency for application to organizations. Since then, eco-efficiency has been generally defined as the ratio of the economic value to the environmental impact of economic activities, and it involves both levels of macroeconomy and microeconomy, such as the business, industry, and regional levels. With the development of economy and society, the establishment of an eco-efficiency index system and the evaluation methods are becoming more and more sophisticated. In general, there are two main calculation methods: economic-environmental (economic value/environmental impact) and input-output (including unexpected output), which have adopted many methods such as the factor analysis method (Chen, 2008), data envelopment method (Yang, 2009), super efficiency DEA (Wang and Wu, 2011), SBM model (Chen et al., 2020, three phase DEA (Deng et al., 2011), directional distance function (Xu and Pan, 2020), etc. Since the modelling method can effectively avoid the subjectivity of weight assignments, it has become a popular way to measure eco-eff iciency. The perspective of this research is becoming more and more microscopic, from discussing the dynamic trend of eco-efficiency at the national level (Hu and Fu, 2016) to discussing the regional differences of eco-efficiency at the level of the different regions of China (Qu, 2018). As research has been ongoing, the evaluation of eco-efficiency has penetrated into all industry sectors, such as the chemical (Ma et al., 2015) and agricultural (Pan and Ying, 2013) industries.
The development of the concept of urban agglomeration has allowed the research on eco-efficiency to keep pace with the times, such as research on the eco-efficiency of four major regions along the eastern coastal area in China (Ren et al., 2019), or research on China's eight major urban agglomerations (Yu et al., 2021). For more detailed investigation, the MI index and Tobit model are widely used, such as for measuring the eco-efficiency of land used for building in Wuhan metropolitan area (Lu and Fang,2017) or exploring the impact of urbanization on eco-efficiency (Chen, 2016), the results of which are consistent with another study (Han et al., 2016).
It is noteworthy that the studies on eco-efficiency mainly focus on measuring the eco-efficiency value and its influencing factors in different regions or industry sectors. However, there are few studies that explore its evolutionary trend from the perspective of time and space, and the studies on eco-efficiency are mainly based on interprovincial data, with fewer involving the city level. Therefore, this paper applied a super efficiency SBM model to evaluate the eco-efficiency of Chengdu-Chongqing Economic Circle based on city level data, and the kernel density and Markov chain were used to estimate the development trend of eco-efficiency for exploring the spatiotemporal differences. Finally, a geographically weighted regression model (GWR) was employed to investigate the influencing factors of eco-efficiency differences and to put forward its path for improvement.

2 Methods

2.1 The super efficiency SBM model

This study adopted the super efficiency SBM model incorporating undesirable output (pollutant emission) as follows:
$\text{Min }{{\rho }_{SE}}=\frac{1+\frac{1}{m}\sum\limits_{i=1}^{m}{\frac{s_{i}^{-}}{{{x}_{ik}}}}}{1-\frac{1}{{{q}_{1}}+{{q}_{2}}}(\sum\limits_{r=1}^{{{q}_{1}}}{\frac{s_{r}^{+}}{{{y}_{rk}}}}+\sum\limits_{t=1}^{{{q}_{2}}}{\frac{s_{t}^{b-}}{{{b}_{tk}}}})}$
s.t.$\left\{ \begin{matrix} \sum\limits_{j=1,j\ne k}^{n}{{{x}_{ij}}{{\lambda }_{j}}-s_{i}^{-}\le {{x}_{ik}}} \\ \underset{j=1,j\ne k}{\overset{n}{\mathop \sum }}\,{{y}_{rj}}{{\lambda }_{j}}+s_{r}^{+}\ge {{y}_{rk}} \\ \underset{j=1,j\ne k}{\overset{n}{\mathop \sum }}\,{{b}_{tj}}{{\lambda }_{j}}-s_{t}^{b-}\le {{b}_{tk}} \\ \underset{j=1,j\ne k}{\overset{n}{\mathop \sum }}\,{{\lambda }_{j}}=1 \\ \lambda,{{s}^{-}},{{s}^{+}}\ge 0 \\ \end{matrix} \right.$
i =1, 2,…, m; r=1, 2,…, q1; t=1, 2,…, q2; j=1, 2,…, n (j $\ne k$)
In equation (1), m stands for the number of input indicators (i=1, 2, …, m), xik is the ith input of the kth DMU (decision-making unit), q1, q2 are the numbers of indicators of expected output and unexpected output, respectively (r=1, 2,…, q1; t=1, 2,…, q2); $s_{i}^{-}$, $s_{r}^{+},s_{t}^{b-}$ are slack variables of input, expected output and unexpected output, respectively; yrk is the rth expected output of the kth DMU, and btk is the tth unexpected output of the kth DMU. Within the formulas of constraint, j stands for each DMU; n is the number of DMUs, λj represents the strength variable; xj, yj and bj are the m-dimensional input variables of the jth DMU; x0, y0 and b0 signify input variables, output variables and unexpected output variables of DMU0, and the index of efficiency calculated by the super efficiency model is expressed as ${{\rho }_{SE}}$ which follows the rules:
If ${{\rho }_{SE}}<1$, then DMU is inefficient;
If ${{\rho }_{SE}}=1$, the DMU is efficient;
If ${{\rho }_{SE}}>1$, then DMU is efficient, and the higher the ρ, the more efficient.

2.2 Markov chain

A Markov chain is a set of discrete random variables with Markov properties. Let {Xn, n = 0, 1, 2,...} be a stochastic process that takes on a finite or countable number of possible values. If Xn = i, then the process is said to be in state i at time n. It was supposed that whenever the process is in state i, there is a fixed probability Pij that it will next be in state j. That is, it was supposed that
$P\left\{ {{X}_{n+1}}=j\text{ }\!\!|\!\!\text{ }{{X}_{n}}=i,{{X}_{n-1}}={{i}_{n-1}},\cdots,{{X}_{1}}={{i}_{1}},{{X}_{0}}={{i}_{0}} \right\}={{P}_{ij}}$
for all states i0, i1,……,in-1,i, j and all n≥0. Such a stochastic process is known as a Markov chain. Equation (2) may be interpreted as stating that, for a Markov chain, the conditional distribution of any future state Xn+1, given the past states X0, X1,..., Xn-1 and the present state Xn, is independent of the past states and depends only on the present state.
The value Pij represents the probability that the process will, when in state i, next make a transition into state j. Since probabilities are nonnegative and since the process must make a transition into some state, we have
${{P}_{ij}}\ge 0,\text{ }i,j\ge 0,\text{ }\underset{j=0}{\overset{\infty }{\mathop \sum }}\,{{P}_{ij}}=1,\text{ }i\text{=}0,1,\ldots $
Let P denote the matrix of one-step transition probabilities Pij, so that
$P=\left[ \begin{matrix} {{P}_{00}} & {{P}_{01}} & {{P}_{02}} & \cdots \\ {{P}_{10}} & {{P}_{11}} & {{P}_{12}} & \cdots \\ \cdots & \cdots & \cdots & \cdots \\ {{P}_{i0}} & {{P}_{i1}} & {{P}_{i2}} & \cdots \\ \cdots & \cdots & \cdots & \cdots \\ \end{matrix} \right]$
The Markov chain predicts the probability of future events by constructing a state transfer matrix. By applying it to eco-efficiency, Pij is assumed to be the probability of a city's eco-efficiency transferring from state i to state j. Here, the transfer probability Pij=nij/ni is estimated approximately by the frequency of transfer, in which nij represents the number of cities transferring from state i in year t to state j of year t+1, ni is the number of cities in state i during the sample investigation period, and Pij follows the rule of equation (3).
In this paper, the eco-efficiency is divided into four states, thus a 4×4 order state transfer probability matrix is constructed.

2.3 Geographically Weighted Regression

In this paper, a geographically weighted regression model (GWR) that considers the geographical spatial relationship was applied to analyze the influencing factors of eco-efficiency. The basic model is as follows:
$E{{E}_{i}}={{\beta }_{0}}\left( {{u}_{i}},{{v}_{i}} \right)+\sum\limits_{k=1}^{n}{{{\beta }_{k}}({{u}_{i}},{{v}_{i}}){{x}_{ik}}+{{\varepsilon }_{i}}}$
in which EEi represents the eco-efficiency value of city i, β0 is a constant term, (ui, vi) stands for the spatial location of city i, βk refers to the regression coefficient of the kth influencing factor of eco-efficiency in city i, xik is the kth influencing factor of eco-efficiency in city i, n is the number of spatial locations, and εi is the random error term of city i.

3 Data and indicators

3.1 Research region

The Chengdu-Chongqing Economic Circle covers 15 cities with a total area of 2.06×10⁵ km2 in Sichuan Province, including Chengdu, Deyang, Mianyang, Meishan, Ziyang, Suining, Leshan, Ya'an, Zigong, Luzhou, Neijiang, Nanchong, Yibin, Dazhou and Guang'an, and 31 counties in Chongqing. Since there are 38 counties in total in Chongqing, in order to unify the caliber of statistical data, the data of the 31 counties in Chongqing are replaced by the data of the whole Chongqing City. The research area is shown in Fig. 1.
Fig. 1 Map showing the location of the research area in China

3.2 Indicators for evaluating eco-efficiency

The indicator system was established including input variables, desirable output and undesirable output variables. The definitions of the specific input-output indicators are shown in Table 1, in which the calculation of capital stock referred to the practice of Zhang Jun (Zhang et al., 2004).
Table 1 Variables of input and output indicators
Grade 1 Grade 2 Definition of indicators
Inputs Labor force (I1) Number of social employees at the end of the year (104 person)
Capital (I2) The perpetual inventory method was used to calculate the capital stock to measure the capital investment, which is: Ki,t= Ki,t-1(1-δi,t) + Ii,t, where Ki,t and Ki,t-1 represent the stock of capital of city i in period t and t-1,respectively, δi,t stands for depreciation rate of city i in period t, and Ii,t is the total fixed assets investment of city i in period t (108 yuan)
Energy resource (I3) The consumption of energy, which is converted into 10000 tons of standard coal (104 t)
Desirable outputs GDP (O1) GDP of cities at constant prices from 2004 (108 yuan)
Greening coverage (O2) The greening coverage rate of built-up area (%)
Undesirable outputs Index of environmental pollution (UO1) Comprehensive index of industrial wastewater, waste gas and solid waste based on the entropy method.
For stability, continuity and availability of the data, this paper selected the data of 15 years from 2004 to 2018 from the China Statistical Yearbook, China Environmental Statistical Yearbook, China Urban Statistical Yearbook and China Energy Statistical Yearbook. The missing data were derived by the interpolation method.

3.3 Influencing factors of eco-efficiency

Regarding the influencing factors of eco-efficiency, many scholars have taken economy, science and technology, resources and so on into their considerations. Those studies have found that to upgrade the rationality of the economic structure, the development level of high-tech industries, the level of opening and increasing environmental protection investment contributed to the improvement of eco-efficiency in the Yangtze River (Dong, 2020). Taking Zhejiang Province as an example, another study found that the level of scientific and technological innovation, and the degree of financial agglomeration, were the key positive factors for improving eco-efficiency, and there was an obvious U-shaped relationship between urbanization level and eco-efficiency (Han et al., 2019). Referring to the previous experiences, this paper selected the following indicators shown in Table 2 based on the concept of urban eco-efficiency (Hu et al., 2018; Mickwitz et al., 2006) and the opinions from other articles (Yin et al., 2014; Yang and Deng, 2019).
Table 2 Influencing factors of eco-efficiency
Variables Indicators Definition of Indicators
Explained variable Eco-efficiency Based on the previous evaluation—EE
Control variables Industrial structure Refer to the calculation method of Fu Linghui (Fu, 2010)—IS
Technological level Removal rate of sulfur dioxide—Tech
Urbanization level Urban population / Local total population—Urban
Level of opening Actual utilization of foreign capital /Local GDP—Open
Environmental regulation Expenditure for environmental protection/ local fiscal expenditure—RE

3.4 Pearson test of inputs and outputs

The super SBM model requires that inputs and outputs are in the same direction, which means when the input increases, the output shall not decrease, and this is usually verified by the Pearson test. In this paper, Stata was used for testing, and the test results in Table 3 show that the inputs had a positive correlation with the positive outputs, and a negative correlation with the negative outputs. All coefficients passed the two tailed test at the 1% significance level. Therefore, the selected inputs and outputs met the principle of “the same direction”.
Table 3 The results of the Pearson test for inputs and outputs
Outputs/Inputs Labor force Capital Energy resource
GDP 0.881*** (0.0000) 0.993*** (0.0000) 0.959***
(0.0000)
Greening coverage 0.170*** (0.0085) 0.221*** (0.0006) 0.250***
(0.0001)
Index of environmental pollution -0.785*** (0.0000) -0.548*** (0.0000) -0.663*** (0.0000)

Note: The numbers without parentheses are the coefficients between inputs and outputs. The values within parentheses 0.0000<0.01, indicate that the positive/negative relationship is statistically significant at the level of 1%, which is denoted by ***.

4 Results and analysis

4.1 Time series analysis of eco-efficiency in the Chengdu-Chongqing Economic Circle

4.1.1 Evolution of eco-efficiency

With the help of Maxdea professional software, the annual eco-efficiency values and their decomposition for the Chengdu-Chongqing Economic Circle were obtained (Table 4 and Fig. 2). Overall, there was a slow upward trend of eco-efficiency in the Chengdu-Chongqing Economic Circle over the 15-year period. The evolution of eco-efficiency represented the shape of “π” rendered by the fluctuating and increasing period from 2004 to 2008, the stable transition period from 2009 to 2015, and the fluctuating and decreasing period from 2016 to 2018. However, it is noteworthy that the overall eco-efficiency values were lower than 1, indicating that it did not reach the frontier of effective production. The main reason for this is that during the research period, the Chengdu-Chongqing Economic Circle mainly focused on traditional industries, such as the coal and steel manufacturing sectors, so the industrial development caused great environmental pollution. In addition, the technology was not advanced yet, which can explain the low resource utilization efficiency that made the situation worse, so it had not reached the frontier of ecologically effective production. In terms of pure technical efficiency, there were only 6 years in a state of “effective”, suggesting that the resource utilization technology needs to be further developed and improved, but the pure technical efficiency was higher overall than the scale efficiency. Since the three indicators conform to the relationship of eco-efficiency = pure technical efficiency × scale efficiency, the high value effect of pure technical efficiency was offset by the low value effect of scale efficiency, which reduced the value of eco-efficiency as a whole. This relationship implies that the key to improving eco-efficiency in the Chengdu-Chongqing Economic Circle lies in improving scale efficiency to effectively reduce costs and improve production efficiency.
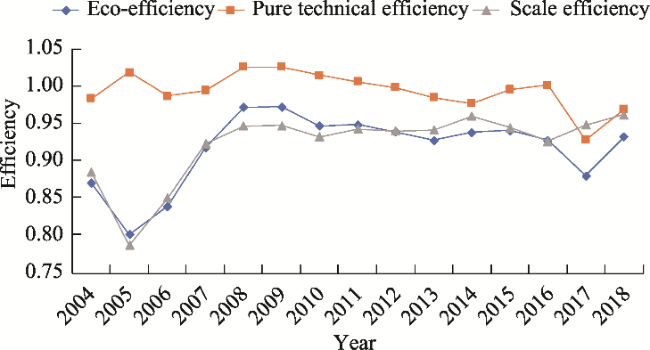
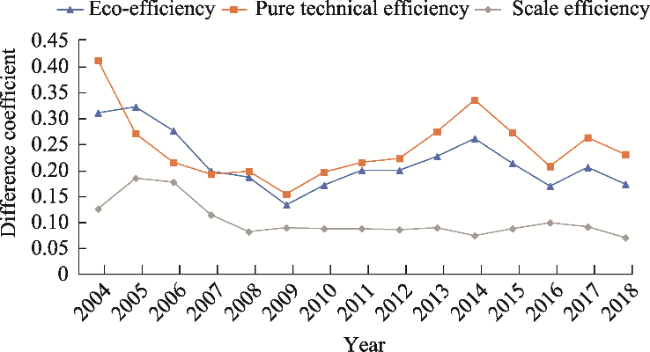
Table 4 Annual eco-efficiency values and their decomposition
Year Eco-efficiency Pure technical efficiency Scale efficiency
2004 0.870297 0.983623902 0.884786450
2005 0.801846 1.018703980 0.787123893
2006 0.839451 0.986933873 0.850564379
2007 0.918079 0.994288994 0.923352445
2008 0.971765 1.025956425 0.947179244
2009 0.972578 1.025964106 0.947965412
2010 0.946803 1.015201737 0.932625727
2011 0.948763 1.006303896 0.942819382
2012 0.939203 0.998493515 0.940619746
2013 0.927904 0.985206629 0.941836502
2014 0.938332 0.977123031 0.960300994
2015 0.941280 0.995825774 0.945225493
2016 0.927984 1.001682759 0.92642494
2017 0.880588 0.928576901 0.948320129
2018 0.932584 0.969394411 0.962027807
Fig. 2 Evolutionary process of eco-efficiency in the Chengdu- Chongqing Economic Circle from 2004 to 2018

4.1.2 Prediction and analysis of eco-efficiency evolution

In this paper, according to the quartile method, the eco-efficiency of 16 cities was divided into four adjacent but non-overlapping complete intervals: (0.5611, 0.7834], (0.7834, 0.9061], (0.9061, 1.0697], (1.0697, 1.7003], and the eco-efficiency transfer matrix of the Chengdu-Chongqing Economic Circle was calculated based on this system, as shown in Table 5.
Table 5 Eco-efficiency transfer probability matrix
State 1 2 3 4
1 0.6964 0.2143 0.0536 0.0357
2 0.1755 0.6491 0.1754 0.0000
3 0.0364 0.1636 0.6727 0.1273
4 0.0179 0.0000 0.1428 0.8393

Note: 1, 2, 3, 4 means state 1, state 2, state 3, and state 4, respectively. Taking the value of 0.2143 as an example, it means that the possibility of state 1 in the tth period transferring to state 2 in the (t+1)th period is 0.2143.

The values on the diagonal in Table 5 denote the probability that eco-efficiency will remain unchanged and the values outside of the diagonal show the probability of eco-efficiency transfers between different states. According to the transfer probability matrix, several conclusions can be drawn. There was a strong tendency for the eco-efficiency of the Chengdu-Chongqing Economic Circle to maintain the original status quo since the values on the diagonal are greater than those on the non-diagonal. It is obvious that the minimum value on the diagonal is 0.6491, which means the probability of maintaining the original state of eco- efficiency is at least 64.91%. Furthermore, the stability at both ends, i.e., the lowest level (state 1) and the highest level (state 4), is the greatest, because the probability of maintaining the original state at the lowest level is 69.64% while that of the highest level is 83.93%. This pattern indicates that there was a possibility for the eco-efficiency to converge to a low level and a high level, which is referred to as “club convergence”. For the overall picture, the eco-efficiency of the Chengdu-Chongqing Economic Circle tended to shift slightly to a low level, implying that there was insufficient momentum for the Chengdu-Chongqing Economic Circle to improve its eco-efficiency. Regarding state 2 and state 3, it is clear that the probability of state 2 transferring to state 1 (0.1755) is slightly greater than transferring to state 3 (0.1754), and the probability of state 3 transferring to state 2 (0.1636) is greater than transferring to state 4 (0.1273). Therefore, it was difficult for the eco-efficiency to achieve leapfrog development, suggesting that the evolution was a stable and gradual process. Based on this matrix, the transition probability between adjacent states is greater than that between non-adjacent level states. For example, the transition probability from state 1 directly to state 3 is only 0.0536, while that from state 1 to state 2 is 0.2143, which is four times as much.

4.2 Analysis of the spatial differences of the eco-efficiency

4.2.1 Analysis of the differences of eco-efficiency among cities

The eco-efficiency of each city is shown in Table 6. Due to the limitation of words number of this paper, only the results for 2004, 2009, 2014, 2019 are displayed. All indicators in the table satisfy the equation: eco-efficiency = pure technical efficiency × scale efficiency.
Table 6 List of eco-efficiency values for cities in the Chengdu-Chongqing Economic Circle
Period DMU Eco-efficiency score Pure technical efficiency score Scale efficiency score Scale effect score Period DMU Eco-efficiency score Pure technical efficiency score Scale efficiency score Scale effect score
2004 Chengdu 1.574 2.276 0.691 Increasing 2009 Chengdu 1.144 1.161 0.985 Increasing
2004 Dazhou 0.611 0.638 0.957 Increasing 2009 Dazhou 1.042 1.049 0.993 Decreasing
2004 Deyang 1.051 1.053 0.998 Decreasing 2009 Deyang 1.045 1.045 1.000 Decreasing
2004 Guang'an 0.667 0.790 0.845 Increasing 2009 Guang'an 1.002 1.007 0.995 Increasing
2004 Leshan 1.044 1.106 0.944 Increasing 2009 Leshan 1.026 1.032 0.994 Increasing
2004 Luzhou 0.813 1.010 0.805 Decreasing 2009 Luzhou 0.939 1.001 0.938 Increasing
2004 Meighan 0.685 0.782 0.875 Increasing 2009 Meishan 0.780 1.014 0.769 Increasing
2004 Mianyang 1.080 1.082 0.998 Decreasing 2009 Mianyang 1.027 1.033 0.994 Increasing
2004 Neijiang 0.677 1.020 0.663 Increasing 2009 Neijiang 0.793 0.832 0.953 Increasing
2004 Nanchong 0.695 0.697 0.997 Decreasing 2009 Nanchong 0.788 0.816 0.965 Decreasing
2004 Suining 0.634 0.721 0.879 Increasing 2009 Suining 1.047 1.049 0.998 Decreasing
2004 Ya'an 1.155 1.600 0.722 Increasing 2009 Ya'an 1.028 1.479 0.696 Increasing
2004 Yibin 0.768 0.786 0.976 Increasing 2009 Yibin 0.830 0.832 0.998 Increasing
2004 Chongqing 1.108 1.108 1.000 Constant 2009 Chongqing 1.219 1.228 0.993 Decreasing
2004 Ziyang 0.707 0.733 0.965 Increasing 2009 Ziyang 0.877 0.903 0.971 Increasing
2004 Zigong 1.236 1.284 0.963 Increasing 2009 Zigong 1.114 1.118 0.996 Increasing
Mean 0.870 0.984 0.885 - Mean 0.973 1.026 0.948 -
2014 Chengdu 1.105 1.107 0.999 Increasing 2018 Chengdu 1.070 1.071 0.998 Decreasing
2014 Dazhou 0.561 0.562 0.998 Decreasing 2018 Dazhou 0.627 0.633 0.989 Increasing
2014 Deyang 1.031 1.039 0.993 Increasing 2018 Deyang 1.074 1.074 1.000 Decreasing
2014 Guang'an 1.013 1.015 0.998 Decreasing 2018 Guang'an 0.806 0.830 0.971 Increasing
2014 Leshan 0.820 0.845 0.970 Increasing 2018 Leshan 0.906 0.954 0.949 Increasing
2014 Luzhou 0.787 0.791 0.994 Increasing 2018 Luzhou 0.773 0.777 0.996 Increasing
2014 Meishan 1.003 1.005 0.998 Increasing 2018 Meishan 1.018 1.033 0.986 Increasing
2014 Mianyang 1.004 1.008 0.997 Increasing 2018 Mianyang 1.007 1.008 1.000 Decreasing
2014 Neijiang 1.053 1.071 0.984 Increasing 2018 Neijiang 0.858 0.932 0.921 Increasing
2014 Nanchong 0.734 0.750 0.979 Decreasing 2018 Nanchong 1.010 1.021 0.989 Decreasing
2014 Suining 0.832 0.865 0.961 Increasing 2018 Suining 0.757 0.805 0.940 Increasing
2014 Ya'an 1.149 1.633 0.704 Increasing 2018 Ya'an 1.185 1.652 0.717 Increasing
2014 Yibin 0.806 0.811 0.994 Increasing 2018 Yibin 0.762 0.769 0.991 Increasing
2014 Chongqing 1.700 1.938 0.877 Increasing 2018 Chongqing 1.185 1.190 0.996 Increasing
2014 Ziyang 0.801 0.813 0.985 Increasing 2018 Ziyang 1.077 1.080 0.997 Increasing
2014 Zigong 1.058 1.072 0.987 Increasing 2018 Zigong 1.039 1.041 0.997 Decreasing
Mean 0.938 0.977 0.960 - Mean 0.933 0.969 0.962 -
In terms of eco-efficiency, Chengdu, Deyang, Mianyang, Ya'an, Zigong and Chongqing were all ecologically effective in the selected years. Based on the average eco- efficiency of each city (Fig. 3), the top five cities were Chongqing (1.305), Chengdu (1.175), Ya'an (1.131), Zigong (1.120) and Deyang (1.046), while cities in the central region, such as Suining, Guang'an Dazhou and Meishan, were in the state of ecological inefficiency, and the gap between the ecologically effective cities and the ineffective cities was wide.
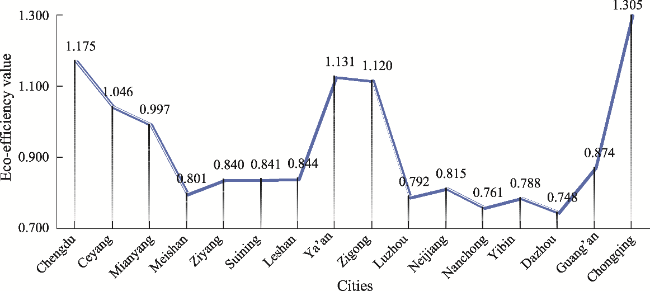
Fig. 3 Average eco-efficiency values of cities in the Chengdu-Chongqing Economic Circle
Regarding technical efficiency, there were 9, 12, 9 and 9 effective cities in 2004, 2009, 2014 and 2018, respectively, among which Chengdu, Deyang, Mianyang, Ya'an, Chongqing and Zigong were always technically effective. However, there was still a large number of cities using technical elements ineffectively, therefore some room for improvement of the management structure remained.
Regarding scale efficiency, only 1, 1, 0 and 2 cities reached effectiveness in 2004, 2009, 2014 and 2018, respectively, suggesting that the current allocation structure needed to be improved because the allocation of input factors in the Chengdu-Chongqing Economic Circle was still unreasonable. It was feasible for cities with diminishing economies of scale to enhance their allocation structure and to optimize their utilization of resources, while the cities with increasing economies of scale could further expand their production scale.

4.2.2 Spatial distribution pattern of the eco-efficiency

To analyze eco-efficiency visually, the eco-efficiency distribution map was drawn by using the natural fracture method to divide the eco-efficiency into three sections with the help of ArcGIS. Cities with the highest eco-efficiency are in the third level. Due to space limitations, only the eco-efficiency distribution maps for 2004, 2009, 2014 and 2018 are shown in Fig. 4. In order to better analyze the process of eco-efficiency evolution in the Chengdu- Chongqing Economic Circle, the difference coefficients of the eco-efficiency in each year were calculated using the following formula:
$SD=\frac{\sqrt{\sum\limits_{i=1}^{n}{\frac{{{(E{{E}_{i}}-\overline{EE})}^{2}}}{n}}~}}{\overline{EE}}$
where SD stands for the difference coefficient for measuring the convergence or variability of eco-efficiency, $E{{E}_{i}}$ is the eco-efficiency value of ith city, $\overline{EE}$ represents the average eco-efficiency, and n is the number of cities. The greater the SD value, the greater the divergence and the more unbalanced the development of eco-efficiency among cities. The SD values of the eco-efficiency from 2004 to 2018 are shown in Fig. 5. This analysis leads to several conclusions.
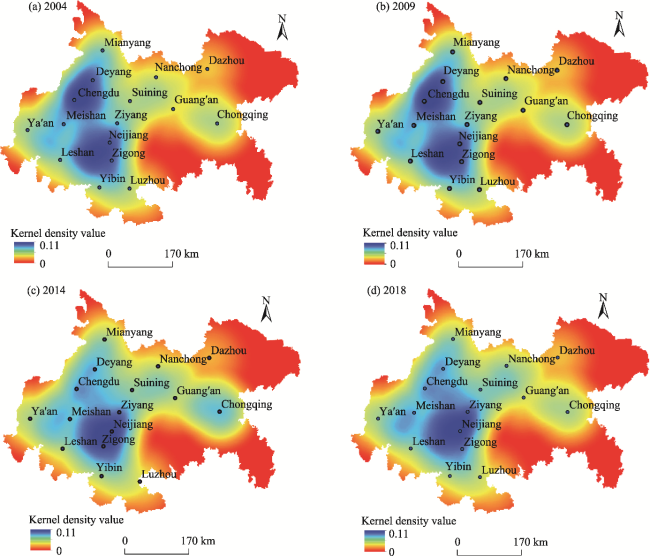
Fig. 4 Distribution of eco-efficiency in 2004, 2009, 2014, and 2018.
Fig. 5 Variations in the coefficient trends of the Chengdu- Chongqing Economic Circle from 2004-2018
(1) Eco-efficiency was distributed from northwest to southeast in a high-low-high pattern. There were two high eco-efficiency areas, one covered Chengdu, Ya'an, Deyang and Mianyang and the other one was Chongqing. Specifically, Chongqing has always been in the highest level, while the cities located from northeast to southwest, such as Nanchong, Suining, Neijiang, Yibin and Luzhou, have always been in the second level and were ecologically ineffective.
The rank of several cities has changed slightly, such as Meishan and Ziyang which migrated from the first level to the second, while Luzhou declined from the second level to the first. However, Chengdu, Ya'an, Deyang and Mianyang changed dramatically. They were clearly in the third level in 2004 and the second level in 2014, whereas their efficiency values were mixed between the third and second levels in 2009 and 2018. Note that the change in the spatial distribution pattern was slight, but the polarization trend remained fixed. The key to solving the polarization difference is to improve the eco-efficiency of cities from the northeast to southwest.
(2) Note that the difference coefficient of eco-efficiency and pure technical efficiency shows a “W” trend in Fig. 5, which means the evolutionary steps of eco-efficiency and pure technical efficiency in the Chengdu-Chongqing Economic Circle were becoming more and more synchronized. Meanwhile, the scale efficiency difference coefficient remained stable since 2008 after a short decline, indicating that there was a relatively steady trend in the Chengdu-Chongqing Economic Circle in terms of scale development. From another point of view, it is noteworthy that the difference coefficient of eco-efficiency decreased by 14%, from 0.31 in 2004 to 0.17 in 2018, and the difference coefficient of pure technical efficiency fell by 18%, from 0.41 in 2004 to 0.23 in 2018. In other words, the spatial divergence of eco-efficiency was becoming more narrow.

4.2.3 Cluster effect analysis of eco-efficiency in the Chengdu-Chongqing Economic Circle

The eco-efficiency kernel density of the Chengdu-Chongqing Economic Circle was analyzed at intervals of 5 years (Fig. 6). The agglomeration distribution pattern of eco-efficiency in the Chengdu-Chongqing circle has not changed greatly during the study period. In 2004, the agglomeration area was triangular with Mianyang, Meishan and Yibin as the apex, while it expanded to an irregular diamond shape in 2009 taking Mianyang, Meishan, Yibin and Suining as the four vertices. However, the area became smaller in 2014 and 2018, as the irregular diamond took Deyang, Meishan, Yibin and Ziyang as its four vertices. Specifically, there were two main agglomeration areas, one was the area of Chengdu and Deyang, and the other was the area of Zigong, Neijiang and Ziyang, while the remaining areas within the diamond were the result of a radiation driving effect of these two main agglomeration areas. On the other hand, the density values of the other areas outside the diamond were relatively low, implying that the distribution of eco-efficiency was scattered, which indicates that each city developed separately to a large degree, hence the radiation effect of economic development was not strong. One possible reason for this weak effect was the long distance between the cities, which made it hard for Chengdu and Neijiang to radiate to Nanchong, Guang'an and Dazhou. In addition, there were certain administrative barriers between provinces given the historical situation, so it was difficult for Chongqing to radiate to the cities near it.
Fig. 6 Kernel density of eco-efficiency in 2004, 2009, 2014, and 2018.
The kernel density curve in Fig. 7 shows that the eco-efficiency of the Chengdu-Chongqing Economic Circle developed a polarization trend, which means the Matthew effect was obvious there. Most cities were located in the left bimodal area where the low values of eco-efficiency were concentrated at about 0.75 and the high values were concentrated at about 1.15, while only a handful cities fell within a peak area on the right where the high value was at about 1.5 and they were totally ecologically effective. High value cities such as Chengdu, Chongqing and Zigong have always been in a high efficiency state, while low value areas such as Dazhou, Guang'an and Ya'an have not changed significantly.
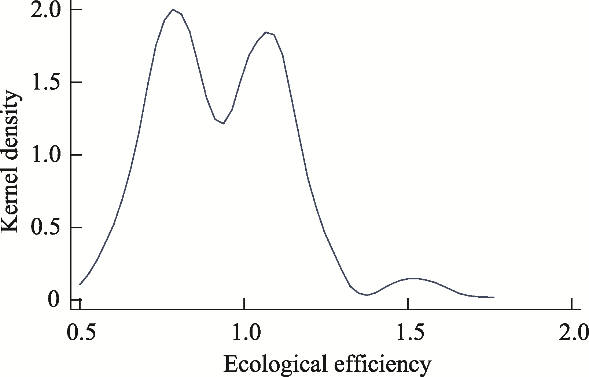
Fig. 7 Curve of eco-efficiency and kernel density
From the overall picture, one possible explanation for why the high-value areas did not radiate and drive the development of low-value areas was the lack of any corresponding policy to carry out cooperation and communication between the cities. In the course of the developmental history of the Chengdu-Chongqing Economic Circle, they often acted and developed separately in their own way, and managers lacked the awareness of regional development and cooperation. Therefore, the Chengdu-Chongqing Economic Circle did not achieve alignment among all the cities in terms of the evolution of eco-efficiency from 2004 to 2018, so there was still polarization of the eco-efficiency.

4.3 Geographically weighted regression

Two cross-sectional sets of data for the beginning and the ending year of the study were used for a geographically weighted regression analysis of eco-efficiency, and a detailed analysis was carried out according to the regression results (Fig. 8).
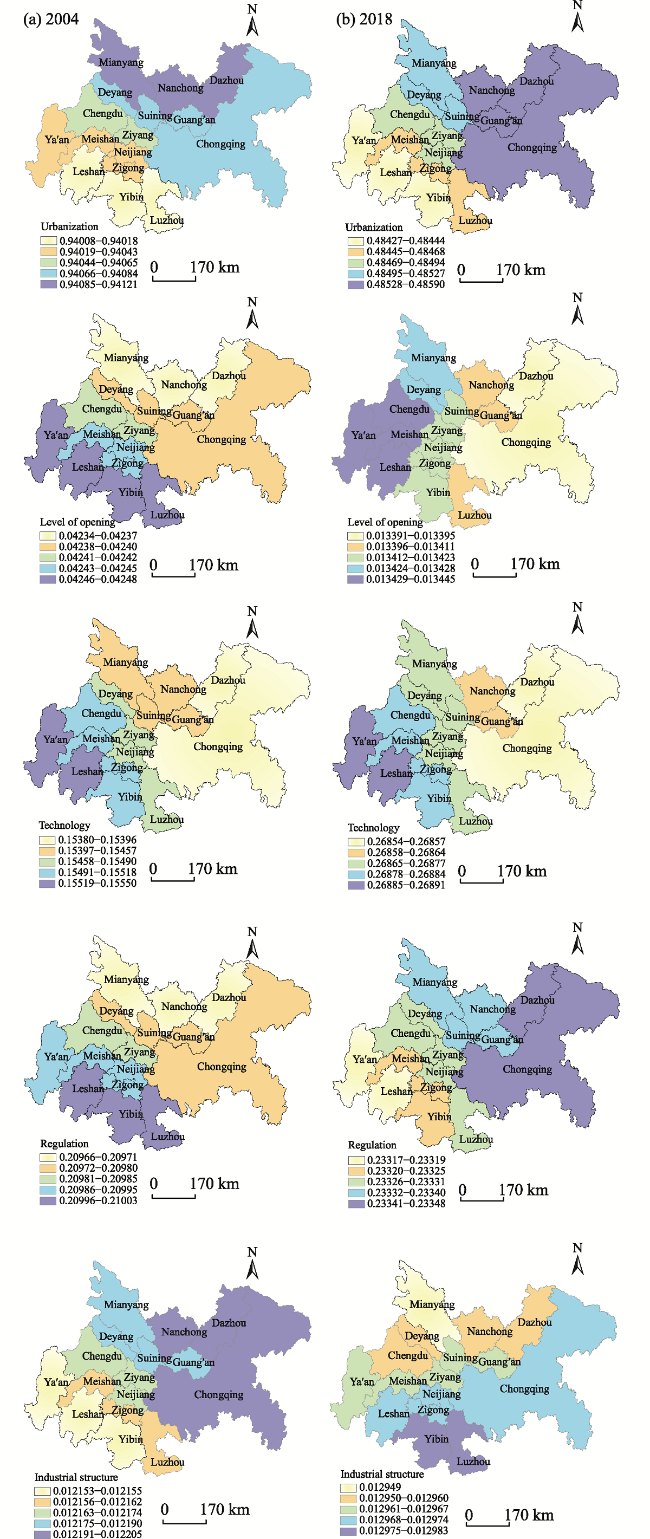
Fig. 8 Spatial distribution of regression coefficients of ecological efficiency using the GWR Model in the Chengdu- Chongqing Economic Circle in 2004 and 2018
This analysis led to several conclusions. From the overall perspective, the levels of urbanization, opening, technology, environmental regulation and advanced industrial structure had a significant positive impact on eco-efficiency. These five factors led to the uneven regional distribution of eco-efficiency. In the follow-up development, the policy makers of each city should remedy the shortcomings, so as to promote the coordinated regional development of eco-efficiency and thus drive the development of surrounding areas and improve the quality of economic development. The analysis of these individual factors leads to more specific conclusions.
(1) The urbanization level had a significant positive impact on eco-efficiency during the study period with the impact degree increasing from southwest to northeast, and this trend was consistent with the distribution of the urbanization level. The environmentally-friendly urbanization strategy of improving the ecological environment and resource utilization efficiency implemented by the Chengdu-Chongqing Economic Circle and the original ecologically sound environmental foundation may explain this conclusion.
(2) The level of opening had a positive impact on the eco-efficiency, and the degree of influence increased from northeast to southwest at the very early stages, but it gradually increased from east to west at the end of the study period. This trend is the opposite of the distribution pattern of the opening level. One possible explanation is that because of the fairly low opening-up level of western cities, when the opening-up level is increased by a modest percentage, the improvement of ecological efficiency is more obvious than that of the central and eastern cities. In other words, the opening-up level elasticity of ecological efficiency is higher.
(3) The technological level had a significant impact on ecological efficiency, and the degree of impact gradually increased from east to west, which is exactly the same as the distribution of technological level. Meishan, Mianyang and Ya'an are gradually developing towards high-tech industries, such as new display devices, integrated circuit chip design and other industries. Most of these industries generate little pollution and impose only a light burden on the ecological environment, which indicates that the rest of the cities have an urgent need to improve their industrial structures.
(4) Environmental regulation exerted a positive impact on eco-efficiency, and the degree of impact increased from northeast to southwest at the beginning, but this trend was reversed at the end of the study period. With the increasing proportion of environmental expenditure in local financial expenditure, it is reasonable that eco-efficiency would be improved. The proportions of environmental expenditure in Chongqing, Mianyang and Dazhou were gradually increasing, and more attention was paid to environmental protection, resulting in the widening of the gap of eco-efficiency between regions.
(5) The advancement of industrial structure had a positive impact on ecological efficiency, and the change in its impact degree was the same as that of environmental regulation. In the early stage of economic development, traditional industries were the mainstay and they exerted a heavy burden on the environment. However, Mianyang, Chongqing and Yibin carried out industrial structure transformation and subsequently developed service industries and high-tech industries, which resulted in reducing the pollution degree and lightening the ecological burden, thus their eco-efficiency improved quickly.
Based on these trends, the corresponding development suggestions are shown in Table 7.
Table 7 Development suggestions for each city in the Chengdu-Chongqing Economic Circle
Development suggestions
Improve urbanization Level up opening Innovate technology Enforce environmental regulations Optimize the industrial structure
Chongqing
Chengdu
Zigong
Luzhou
Deyang
Mianyang
Suining
Neijiang
Leshan
Nanchong
Meishan
Yibin
Guang'an
Dazhou
Ya'an
Ziyang

5 Conclusions and suggestions

5.1 Conclusions

For the Chengdu-Chongqing Economic Circle as a whole, there was a slow upward trend of the eco-efficiency over the 15-year study period with its evolution representing the shape of “π”, but it was ecologically ineffective. The Markov chain transfer probability matrix shows that there was a strong tendency for the eco-efficiency to maintain the original status quo, and obviously there was a phenomenon of “club convergence”, but the momentum for promoting the eco-efficiency was insufficient and it was difficult to achieve a leapfrog transfer. In terms of spatial differences, eco-efficiency was distributed from northwest to southeast in a high-low-high pattern. During the study period, the spatial-temporal difference of eco-efficiency narrowed but the clustering effect was scattered and there was a polarization trend. Applying a GWR model to analyze the reasons for the eco-efficiency differences showed that the different development levels of urbanization, opening, technology, environmental regulation and advancement of industrial structure were the factors leading to the spatial differences of eco-efficiency. Each city in the Economic Circle should make an effort to improve their eco-efficiency accordingly, and thus to promote the green development of the whole region.

5.2 Suggestions

(1) The governments should remove the administrative barriers among cities, which would promote the integration of resources. Relying on the traffic systems of Chengdu and Chongqing, it should take advantage of the radiating and driving power of Chongqing and Chengdu to promote the outward release of industries and improve the resource radiation capacity, and for this reason, strengthening the economic and political communications between cities is very important.
(2) To optimize the industrial structure, there is an urgent need to develop diversified hierarchical industries and enrich the industrial types. Taking 5G development as an opportunity to build a new industrial layout, it should promote the integration of 5G with other industry sectors, such as new energy vehicles, AI industry, biomedicine, aerospace and Internet of things industries. In addition, the headquarters of high-tech industries should be encouraged to settle in the Chengdu-Chongqing Economic Circle by tax preferential policies, talent introduction policies and other measures, and large and medium-sized enterprises should be encouraged to implement measures such as equity incentive plan to attract all kinds of high-level talents to flow into the Chengdu-Chongqing Economic Circle.
(3) To increase investments in scientific research and establish more supporting policies for innovative enterprises and emerging industries, it would be helpful to establish high-tech industrial zones in Chengdu, Chongqing and Mianyang and to increase the R & D expenditure supporting the construction of national laboratories and scientific research platforms by integrating and making good use of innovative resources such as universities, scientific research institutes and the R & D departments of enterprises.
(4) To formulate and implement environmentally friendly urbanization policies, it should accelerate the construction of urban infrastructure, change the current situation of independent development among cities such as by promoting communication between cities on some infrastructure jobs (like water conservancy and the power grid) and by strengthening the co-construction and sharing of public services. Furthermore, to design and improve the inter-regional ecological protection compensation mechanism, increase the fiscal transfer payments of areas where serious environmental pollution occurs, and improve the legal system for restricting the behavior of enterprises. Finally, a series of environmental punishment standards should be quantified through taxation and other means to improve the entry threshold of enterprises.
[1]
Cai X H, Ru Y Y. 2016. Will local government infrastructure investment inhibit enterprise technological innovation-Empirical research based on the data of Chinese manufacturing enterprises. Management World, 11: 32-52. (in Chinese)

[2]
Chen A. 2008. An empirical analysis of regional eco-efficiency evaluation and influencing factors in China: A case study of provincial data from 2000 to 2006. Chinese Journal of Management Science, 16(S1): 566-570. (in Chinese)

[3]
Chen H, Wang H K, Qin S. 2020. Green efficiency of grain production in Heilongjiang from the perspective of water footprint: Based on three-stage SBM-Malmquist index analysis. Resources and Environment in the Yangtze Basin, 29(12): 2790-2804. (in Chinese)

[4]
Chen Z L. 2016. Eco-efficiency, urbanization and Spatial Spillover-A study based on Spatial Panel Dobin Model. Management Review, 28(11): 66-74. (in Chinese)

[5]
CPC Central Committee and State Council. 2021a. Outline of national Comprehensive Three-dimensional Transportation Network Planning, [2021] 08. https://www.mot.gov.cn/2021zhengcejd/zongheltjtwghtj/index.html. (in Chinese)

[6]
CPC Central Committee and State Council. 2021b. Outline of Construction Planning of Chengdu-Chongqing Economic Circle, [2021]31. http://www.gov.cn/xinwen/2021-10/21/content_5643875.html. (in Chinese)

[7]
Deng B, Zhang X J, Guo J H. 2011. Research on regional eco-efficiency based on three-stage DEA model. China Soft Science, 1: 92-99. (in Chinese)

[8]
Dong B. 2020. Calculation and influencing factors of eco-efficiency of provinces and cities in the Yangtze River Economic Belt. Journal of Wuhan University of Technology (Social Science Edition), 2: 121-130. (in Chinese)

[9]
Fu L H. 2010. Empirical Study on the relationship between the upgrading of China's industrial structure and economic growth. Statistical Research, (8): 79-81.

[10]
Han J Y, Zhou H L, Yu Y G. 2019. Analysis on regional differences and influencing factors of eco-efficiency in Zhejiang Province: Based on super efficiency DEA model. Science and Technology and Management, 3: 23-29. (in Chinese)

[11]
Han Y H, Huang L X, Wang X B. 2016. Has the optimization and upgrading of industrial structure improved eco-efficiency? Research on Quantitative Economy and Technical Economy, 33(4): 40-59.

[12]
Hu B, Fu Y T. 2016. Measurement of eco-efficiency and empirical analysis of spatial differences in China based on SBM model and spatial autocorrelation. Resources and Environment in Arid Areas, 30(6): 6-12. (in Chinese)

[13]
Hu Y N, Peng J, Liu Y X, et al. 2018. Research progress of regional eco-efficiency. Acta Ecologica Sinica, 38(23): 8277-8284. (in Chinese)

[14]
Liang B, Ji H. 2020. How does unemployment insurance affect job search efforts-Evidence from “China time use survey”. Economic Research, 55(3): 179-197. (in Chinese)

[15]
Liu Q R, Chen T. 2020. How export behavior affects enterprise environmental performance. China Industrial Economy, 1: 99-117. (in Chinese)

[16]
Lu Y C, Fang S M. 2017. Analysis on temporal and spatial evolution and influencing factors of urban construction land eco-efficiency in Wuhan metropolitan area based on SBM-DEA and Malmquist model. Resources and Environment of the Yangtze River Basin, 26(10): 1575-1586. (in Chinese)

[17]
Ma S J, Hu S Y, Chen D J, et al. 2015. A case study of a phosphorus chemical firm's application of resource efficiency and eco-efficiency in industrial metabolism under circular economy. Journal of Cleaner Production, 87: 839-849.

DOI

[18]
Mickwitz P, Melanen M, Rosenstr M U, et al. 2006. Regional eco-efficiency indicators: A participatory approach. Journal of Cleaner Production, 14(18): 1603-1611.

DOI

[19]
National Development and Reform Commission of China. 2016. Notice on the issuance of Chengdu-Chongqing Urban Agglomeration Development Plan, [2016]910. (in Chinese)

[20]
OECD (Organization for Economic Cooperation and Development). 1998. Eco-efficiency. Paris, France: OECD: 7-11.

[21]
Pan D, Ying R Y. 2013. Agricultural eco-efficiency evaluation in China based on SBM model. Acta Ecologica Sinica, 33(12): 3837-3845. (in Chinese)

DOI

[22]
Qu X E. 2018. Regional differentials and influence factors of eco-efficiency in China: An empirical analysis based on the perspective of spatio-temporal differences. Resources and Environment in the Yangtze Basin, 27(12): 2673-2683. (in Chinese)

[23]
Ren Y F, Fang C L, Lin X Q, et al. 2019. Evaluation of the eco-efficiency of four major urban agglomerations in coastal Eastern China. Journal of Geographical Sciences, 29(8): 1315-1330.

DOI

[24]
Schmidheiny S, Zorraquin F J L. 1996. Financing change:The financial community,eco-efficiency,and sustainable development. Cambridge, USA: MIT Press, 1996: 211.

[25]
Sun X, Zhao X, Song M L. 2016. Eco-efficiency evaluation and convergence analysis of Yangtze River economic belt. Journal of South China Agricultural University (Social Science Edition), 15(5): 1-10. (in Chinese)

[26]
Wang E X, Wu C Y. 2011. Spatial-temporal differences of provincial eco-efficiency in China based on super efficiency DEA model. Chinese Journal of Management, 8(3): 443-450. (in Chinese)

[27]
WBCSD. 1996. Eco-efficient leadership for improved economic and environmental performance. Geneva, Switzerland: World Business Council for Sustainable Development:: 3-16.

[28]
Xu M B, Pan Y C. 2020. The impact of environmental regulation on industrial green productivity in China: An analysis based on dynamic spatial panel model. Journal of Industrial Technological Economics, 39(12): 54-61. (in Chinese)

[29]
Yang B. 2009. Research on regional eco-efficiency in China from 2000 to 2006: An empirical analysis based on DEA method. Economic Geography, 29(7): 1197-1202. (in Chinese)

[30]
Yang Y, Deng X Z. 2019. The spatial-temporal evolutionary characteristics and regional differences in affecting factors analysis of China's urban eco-efficiency. Scientia Geographical Sinica, 39(7): 1111-1118. (in Chinese)

[31]
Yin K, Wang R S, An Q X, et al. 2014. Using eco-efficiency as an indicator for sustainable urban development: A case study of Chinese provincial capital cities. Ecological Indicators, 36: 665-671.

DOI

[32]
Yu B B. 2015. Economic growth effect of industrial structure adjustment and productivity improvement-Analysis based on China's urban dynamic spatial panel model. China Industrial Economy, 12: 83-98. (in Chinese)

[33]
Yu W, Zhang P, Ji Z H. 2021. A study on regional differences, distribution dynamics and convergence of eco-efficiency in Chinese urban agglomerations. Journal of Quantitative and Technical Economics, 38(1): 23-42. (in Chinese)

[34]
Zhang J, Wu G Y, Zhang J P. 2004. The estimation of China's provincial capital stock: 1952-2000. Economic Research Journal, 39(10): 35-44. (in Chinese)

Outlines

/