Assessing Impact of Restoration on Livelihood

The Evaluation of Urban Green Space Landscape Changes and Ecosystem Services in Beijing

  • XIAO Yu , 1, 2, * ,
  • GAN Shuang 3 ,
  • HUANG Mengdong 1, 2 ,
  • LIU Jia 1, 2 ,
  • MAO Hui 2, 4 ,
  • ZHANG Changshun 1, 2 ,
  • QIN Keyu 1, 2 ,
  • XIE Gaodi 1, 2
Expand
  • 1. University of Chinese Academy of Sciences, Beijing 100049, China
  • 2. Institute of Geographic Sciences and Natural Resources Research, Chinese Academy of Sciences, Beijing 100101, China
  • 3. Graduate School of Media and Governance, Keio University, Fujisawa 2520882, Japan
  • 4. College of Resources, Sichuan Agricultural University, Ya’an, Sichuan 611130, China
*XIAO Yu, E-mail:

Received date: 2021-11-12

  Accepted date: 2022-04-19

  Online published: 2022-07-15

Supported by

The National Natural Science Foundation of China(41971272)

The Guangxi Science and Technology Major Project(AA20161002-3)

The Strategic Priority Research Program of Chinese Academy of Sciences(XDA20020402)

Abstract

As a very important part of the urban ecosystem, the urban green space system plays an active role in maintaining the urban ecosystem stability, providing ecosystem services, and improving the quality of the urban environment. In order to deal with the problems brought about by the deterioration of the urban ecological environment, it is necessary to study and analyze the spatial distribution pattern, evolutionary characteristics and ecosystem services of urban green space to maximize its ecological benefits and comprehensive functions. In this study, we took Beijing urban area as an example, and based on the spatial distribution data of urban green space and remote sensing data, we first calculated the urban green space type transition matrix, landscape pattern index and ecosystem services. Then, we analyzed the changes in urban green space landscape patterns, ecosystem services and their spatial distributions from 2000 to 2020, and studied the interactive relationships between landscape changes and changes in ecosystem services. The results showed three key findings. (1) Beijing’s urban green space construction has achieved remarkable results from 2000 to 2020. The area of green space has increased by 77.41%, mainly from cultivated land and construction land. (2) From 2000 to 2020, the amounts of dust retention, SO2 absorption, NO2 absorption, cooling and humidification, carbon fixation and oxygen release, and rainwater runoff reduction in Beijing's urban green space have shown continuous increases in general. (3) There is a close relationship between urban green space landscape changes and green space ecosystem services, and total area (TA) has the highest correlation with ecosystem services. Except for rainwater runoff reduction, the correlation coefficients between TA and ecosystem services are all higher than 0.85. This research can provide theoretical guidance for optimizing Beijing's green space and determining how to maximize the effect of green space for improving the ecological environment, and ultimately provide a scientific basis for the construction of Beijing's ecological environment.

Cite this article

XIAO Yu , GAN Shuang , HUANG Mengdong , LIU Jia , MAO Hui , ZHANG Changshun , QIN Keyu , XIE Gaodi . The Evaluation of Urban Green Space Landscape Changes and Ecosystem Services in Beijing[J]. Journal of Resources and Ecology, 2022 , 13(5) : 897 -911 . DOI: 10.5814/j.issn.1674-764x.2022.05.014

1 Introduction

The urban green space system is a stable and lasting urban green environmental system formed by the interconnection and combination of various urban green spaces. With the acceleration of urbanization, ecological and environmental problems have become increasingly prominent, and people’s demand for green plants has become more and more obvious. Urban landscaping can not only produce good ecological benefits, but it can also bring beautiful visual enjoyment to people. Therefore, as the only living infrastructure in the city, the urban landscape plays an irreplaceable role in improving the ecological environment.
In recent years, as the government has been attaching greater importance to ecological security and people continue to pursue high-quality living environments, researchers have conducted a large number of studies on the functions of urban green space ecosystems. Studies have shown that urban green space has a certain cooling effect on the underlying surface, and the increase in green space can alleviate the urban heat island effect (Ca et al., 1998; Ashie et al., 1999; Kikegawa et al., 2006). For example, Gluch et al. (2006) studied the thermal environment of Salt Lake City from different scales of communities and regions and showed that different land covers have different cooling effects. Urban green space also has the ability to trap dust, and the effect varies with different species, different types of green space, and different functional areas of green space (Fu et al., 2000, Zhang et al., 2003; Wang et al., 2006). Kang et al. (2003) studied the dust-retaining effect of the 20 main greening tree species in Shaanxi, and found that the dust-retaining ability of shrub species is stronger than heather, boxwood and Pittosporum vulgare, while Forsythia and Begonia are weak. Zhao et al. (2002) demonstrated that in the urban green space system, the amount of dust retention in the arbor green space is higher than in herbaceous plants, and the amount of dust retention in lawn vegetation is the smallest. Chen et al. (2006) measured the dust retention capacity of the garden vegetation in the Wugang industrial area from the perspective of the green space in the industrial area, focusing on the serious pollution in the Wugang industrial area, and quantitatively studied the dust retention effect of the garden green space. The photosynthesis of green space plants absorbs CO2 and releases O2, which makes the urban green space play an important role in maintaining the balance of urban atmospheric CO2 and O2. Studies have shown that at least 150 m2 of forests are needed to meet a person’s demand for O2 in a year (Leng and Su, 2001). The green space purifies the air by absorbing SO2 and other toxic gases, secreting volatile substances with bactericidal effects, and blocking dust (Meredith and Hites, 1987; Trapp et al., 2001; Sun, 2003). In addition, the purification abilities of different vegetation types vary. Luo et al. (2000) studied SO2 purification by 32 species of trees and found that the ability of willow to absorb SO2 and accumulate S is the strongest, followed by early willow, ginkgo, bauhinia, and rose with lower abilities. The increase in green land cover can reduce surface runoff, thereby saving drainage facilities (Zhang et al., 2003). Gill et al. (2007) conducted a simulation study in Greater Manchester and found that a 10% increase in green space coverage in residential areas could reduce surface runoff by 4.9%, and an additional 10% of similar green space coverage could reduce surface runoff by 5.7%.
At present, the research on the urban green space landscape pattern mostly focuses on the optimization of the urban green space landscape pattern (Wei et al., 2018), the dynamics of temporal and spatial evolution (Yang et al., 2020; Hu et al., 2021), the driving mechanism of its evolution (Luo, 2017), and so on. With the maturity and innovation of GIS spatial analysis capabilities, green space data extraction and landscape pattern research based on remote sensing images have become a major trend. Based on remote sensing images, Yang et al. (2020) studied the changes in the green space landscape pattern driven by the construction of the national ecological garden city in Xuzhou in 2004 and 2014. Ge (2020) took the urban green space in the central urban area of Yanqing as the research object, and analyzed the changes in the landscape pattern of urban green space in 2010 and 2018. Qigelhen et al. (2019) analyzed the dynamic changes of the green space landscape pattern in the central urban area of Urumqi in 2008, 2013 and 2017 based on Landsat remote sensing images from the two aspects of the transition matrix and the landscape pattern index.
In summary, many studies have been conducted on the ecological environment of urban green space, and a large body of valuable research results have been obtained. However, the existing research still lacks sufficient consideration of space-time scale issues, so there is a lack of continuous time and full consideration of spatial heterogeneity.
Beijing has a highly concentrated population and high- intensity economic activities. It has a strong demand for ecological services and exerts great pressure on the ecological environment. This study takes Beijing as an example. Based on the spatial distribution data of urban green space and remote sensing data, this study first analyzes the changes of landscape quantity and the landscape spatial pattern, then analyzes the changes of the green space landscape index, evaluates the green space ecosystem services, and finally analyzes the relationship between green space landscape change and ecosystem services. This research can provide theoretical guidance for optimizing Beijing’s green space and determining how to maximize the effect of green space for improving the ecological environment, and ultimately provide a scientific basis for the construction of Beijing’s ecological environment.

2 Study area

Beijing is located in the northwest of the North China Plain (115°25°-117°35°E, 39°28°-41°05°N), with a total land area of 1.68×10⁴ km2. It encompasses 16 districts, including Dongcheng, Xicheng, Chaoyang, Fengtai, Shijingshan, Haidian, Mentougou, Fangshan, Tongzhou, Shunyi, Changping, Daxing, Huairou, Pinggu, Miyun, Yanqing. The climate is a warm-temperate continental monsoon climate, with a dry and windy spring and a hot and rainy summer. The annual average precipitation is 595 mm, with the precipitation concentrated in June-September. The terrain is high in the northwest and low in the southeast. There are more than 160 rivers in Beijing, which belong to the five major water systems of the Haihe River Basin, the Bei Canal, Daqing River, Yongding River, Ji Canal and Chaobai River. There are 85 reservoirs with a total storage capacity of 9.4×10⁹ m3. Most of them are distributed in the northern and western mountainous areas.

2 Data and methods

2.1 Data sources

The green space data for 2000, 2005, 2010, 2015 and 2020 were obtained as 10-m resolution land use data from the Institute of Remote Sensing and Digital Earth, Chinese Academy of Sciences. The urban LAI (Leaf Area Index) data for 2000, 2005, 2010, 2015 and 2020 were processed by the MODIS15A2 product, with a resolution of 500 m. The urban NPP data for 2000, 2005, 2010, 2015 and 2020 are the NPP data of MOD17A3H with a resolution of 500 m. The pollutant concentration data for 2000, 2005, 2010, 2015 and 2020 came from the Beijing Municipal Environmental Status Bulletin. The temperature and precipitation data came from the China Meteorological Data Network (http://data.cma.cn). Population data came from WorldPop (www. worldpop.org). Beijing road data were obtained from OpenStreetMap.

2.2 Research methods

2.2.1 Calculation of the urban green space landscape changes in Beijing

The urban green space landscape can be evaluated by the following indicators:
Total Patch Area (TA): The total area of a landscape.
Number of Patches (NP): The total number of patches in a landscape.
Splitting Index (SPLIT): SPLIT is equal to the square of the total landscape area divided by the sum of the square of the patch area. When the landscape consists of a single patch, the SPLIT increases as the landscape becomes more subdivided into smaller patches. The formula is:
$SPLIT=\frac{T{{A}^{2}}}{\underset{i=1}{\overset{m}{\mathop{\mathop{\sum }^{}}}}\,\underset{j=1}{\overset{n}{\mathop{\mathop{\sum }^{}}}}\,a_{ij}^{2}}$
where SPLIT is the Splitting Index; i =1,…, m, is the patch type; j =1,…, n, is the number of patches; aij is the area of the j-th patch of the i-th patch type (m2); and TA is the total landscape area.
Mean Patch Fractal Dimension Index (FRAC_MN): FRAC_MN is the weighted average of the fractal dimension of a single patch in the landscape component based on the area. It is used to measure the complexity of the patch boundary, the value ranges between 1 and 2, and the larger the value, the more complex the shape of the patch boundary. The formula is:
$FRAC=\frac{\underset{i=1}{\overset{m}{\mathop{\mathop{\sum }^{}}}}\,\underset{j=1}{\overset{n}{\mathop{\mathop{\sum }^{}}}}\,\frac{2\ln (0.25{{P}_{ij}})}{\ln ({{a}_{ij}})}}{N}$
where FRAC is Mean Patch Fractal Dimension Index; i=1,…, m, is the patch type; j=1,…, n, is the number of patches; Pij is the perimeter of the j-th patch of the i-th patch type (m); aij is the area of the j-th patch of the i-th patch type (m2); and N is the total number of patches in the landscape.
Shannon’s Diversity Index (SHDI): SHDI is the proportion of each green space patch area multiplied by its natural logarithm, which then takes a negative value. With the increase of SHDI, the structure of the patches tends to be more complex. The formula is:
$SHDI=-\underset{i=1}{\overset{m}{\mathop{\mathop{\sum }^{}}}}\,{{P}_{i}}\times \ln ({{P}_{i}})$
where SHDI is Shannon’s Diversity Index; m is the total number of landscape types; and Pi is the proportion of the area of landscape type i.

2.2.2 Calculation of ecosystem services of the urban green space in Beijing

This study evaluates the services of Beijing’s urban green space ecosystem by evaluating six services: dust retention, SO2 absorption, NO2 absorption, cooling and humidification, carbon fixation and oxygen release, and rainwater runoff reduction. The main research methods for each of these ecosystem services are as follows.
(1) Dust retention
${{Q}_{dij}}=\frac{LA{{I}_{ij}}\times {{q}_{di}}\times 12}{1000}$
In the formula, Qdij is the annual dust retention per unit area of the j-th grid of the i-th green space (g m-2); LAIij is the leaf area index of the j-th grid of the i-th green space; qdi is the dust retention capacity per unit leaf area within each rainfall interval of the i-th green space [g m-2 (2.5 week)-1] (Chen et al., 1998).
(2) SO2 absorbed
${{Q}_{sij}}=\frac{LA{{I}_{ij}}\times {{q}_{si}}\times 2\times 0.9}{1000}$
In the formula, Qsij is the annual SO2 absorption per unit area of the j-th grid of the i-th green space (g m-2); LAIij is the leaf area index of the j-th grid of the i-th green space; qsi is the sulfur absorption capacity per unit leaf area of the i-th green space (g m-2) (Luo et al., 2000); 2 is the molecular weight conversion of sulfur to SO2 (i.e., 64/32=2); and 0.9 refers to 90% sulfur in the leaves which comes from the direct absorption of atmospheric SO2 by the leaves.
(3) NO2 absorbed
${{Q}_{nij}}=\frac{LA{{I}_{ij}}\times {{q}_{ni}}\times 3.29}{1000}$
In the formula, Qnij is the annual NO2 absorption per unit area of the j-th grid of the i-th green space (g m-2); LAIij is the leaf area index of the j-th grid of the i-th green space; qni is the NO2-N absorption capacity per unit leaf area of the i-th green space (g m-2) (He et al., 2012); and 3.29 is the coefficient for converting NO2-N to NO2.
(4) Humidification and cooling
The amount of humidification is mainly calculated by the amount of transpired water. The formulas are as follows:
${{Q}_{w}}=\sum\limits_{j=1}^{n}{\sum\limits_{i=1}^{m}{{{Q}_{wij}}\times b}}$
${{Q}_{wij}}=LA{{I}_{ij}}\times {{q}_{wi}}\times 210$
In the formula, Qw is the annual transpiration of the green space (kg); b is the grid area (m2); Qwij is the annual transpiration per unit area of the j-th grid of the i-th green space (kg m-2); LAIij is the leaf area index of the j-th grid of the i-th green space; qwi is the daily transpiration capacity per unit leaf area of the i-th green space (kg m-2) (Chen, 1998); and 210 is the average annual growth days of vegetation in the Beijing area.
The amount of cooling is mainly expressed by heat absorption. The formulas are as follows:
${{Q}_{h}}=\sum\limits_{j=1}^{n}{\sum\limits_{i=1}^{m}{{{Q}_{hij}}\times b}}$
${{Q}_{hij}}={{Q}_{wij}}\times 2453$
In the formula, Qh is the annual transpiration heat absorption of the green space (kJ); b is the grid area (m2); Qhij is the annual transpiration heat absorption per unit area of the j-th grid of the i-th green space (kJ m-2); Qwij is the annual transpiration per unit area of the j-th grid of the i-th green space (kg m-2); and 2453 (kJ kg-1) is the heat of vaporization of water at 20 ℃.
(5) Carbon fixation and oxygen release
The amounts of carbon fixation and oxygen release are mainly calculated by the photosynthesis equation. The formulas are as follows:
${{Q}_{C{{O}_{2}}}}=\sum\limits_{j=1}^{n}{\sum\limits_{i=1}^{m}{{{Q}_{\text{C}{{\text{O}}_{2ij}}}}\times b\times {{10}^{-4}}}}$
${{Q}_{{{O}_{2}}}}=\sum\limits_{j=1}^{n}{\sum\limits_{i=1}^{m}{{{Q}_{{{\text{O}}_{2ij}}}}\times b\times {{10}^{-4}}}}$
${{Q}_{C{{O}_{2ij}}}}=NPP\times 1.63/0.44$
${{Q}_{{{O}_{2ij}}}}=NPP\times 1.19/0.44$
In the formula, ${{Q}_{C{{O}_{2}}}}$ is the total amount of CO2 fixation of the green space vegetation (t); ${{Q}_{{{O}_{2}}}}$ is the total amount of O2 released by the green space vegetation (t); ${{Q}_{C{{O}_{2ij}}}}$ is the fixed amount of CO2 of the j-th grid vegetation of the i-th green space type (g CO2 m-2); ${{Q}_{{{O}_{2ij}}}}$is the amount of O2 released by the j-th grid vegetation of the i-th green space type (g O2 m-2); b is the grid area (m2); NPP is net primary productivity (g C m-2); and 0.44 is the conversion factor for converting NPP(C) to organic matter. 1.63 and 1.19 are respectively taken from the photosynthesis equation. According to the photosynthesis equation, every 1.00 g of dry matter produced can fix 1.63 g of CO2 and release 1.19 g of O2.
(6) Rainwater runoff reduction
Rainwater runoff reduction is calculated by comparing the difference between the reduction in rainfall runoff from green areas and the reduction in rainfall runoff from the impervious layer. The formulas are as follows:
$RWS=\sum\limits_{j=1}^{n}{\sum\limits_{i=1}^{m}{RW{{S}_{ij}}\times b\times 0.001}}$
$RW{{S}_{ij}}=({{\gamma }_{h}}-{{\gamma }_{ij}})\times RM$
In the formula, RWS is the amount of rainwater retained in the green space (m3); RWSij is the annual rainwater retained per unit area of the j-th grid of the i-th green space (mm); b is the grid area (m2); RM represents the rainfall in the flood season (mm), and according to the actual situation of the rainy season in Beijing, June to September is selected as the evaluation time period; ${{\gamma }_{h}}$is the runoff coefficient of the impervious layer; and γij is the runoff coefficient of the j-th grid green space of the i-th green space type.

3 Results and analysis

3.1 Changes in the urban green space landscape

This study mainly analyzes the changes in the urban green space landscape of Beijing from 2000 to 2020 regarding three aspects: the quantity and distribution of urban green space, changes in the spatial pattern of urban green space, and the urban green space landscape index.
In terms of the quantity and distribution of urban green space in Beijing, the urban green area in 2000, 2005, 2010, 2015 and 2020 were 703.45, 986.67, 717.85, 860.36, and 1248.03 km2, respectively, and the corresponding green area coverage was 21.78%, 30.55%, 22.23%, 26.64% and 38.65%. From the perspective of changing trends, the area of green space and the rate of green space coverage both show fluctuating upward trends from 2000 to 2020. Both measures increased rapidly in 2000-2005 and 2015-2020, while their trends of increase in 2010-2015 were relatively slow. In addition, the area of green space and the rate of coverage of green space decreased from 2005 to 2010. The green space area and the rate of green space coverage in 2010 were similar to those in 2000. It can be seen that the construction of urban green space from 2000 to 2020 has achieved remarkable results, with the area of green space increasing by 77.41%, of which the area of forest land green space has increased by 72% and the area of grassland has increased by 98% (Fig. 2).
Fig. 1 Location of the study area
Fig. 2 Beijing urban green areas and green space coverage rates in 2000, 2005, 2010, 2015, and 2020.
In terms of spatial distribution, the spatial distribution of urban green space in Beijing is divided into three parts: mountainous area, plain area and urban area. The mountainous green space in northwestern Beijing is dominated by forests. The area of green space in this region was relatively stable from 2000 to 2020 without significant changes. The green space in the plain area mainly refers to the green space outside the sixth ring road and the new urban area. In terms of time, the overall green area of the region was relatively small in 2000, and forest land and grassland were only scattered in dots. In 2005, the green area increased to a certain extent; in 2010, it was greatly reduced; in 2015, the eastern green area increased, mainly due to the increase in grassland area; and in 2020, the green area in the plain area showed a very significant increase, with both forest land and grassland. It is evenly distributed in the plain area in the form of lines or dots. The urban green space is forest land, grassland, etc. in mature built-up areas, of which the forest land is mainly distributed on both sides of large parks and roads. The spatial distribution and area changes in this area were relatively stable from 2000 to 2015, and the green area was mainly forest land, showing a linear distribution along roads or a dotted distribution of parks and green spaces. In 2020, the urban green area increased significantly, mainly on both sides of the roads (Fig. 3).
Fig. 3 The distribution of urban green space in Beijing urban areas in 2000, 2005, 2010, 2015, and 2020.
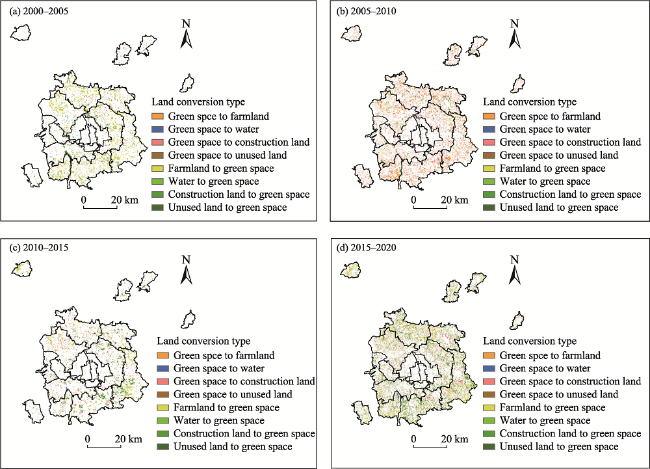
Regarding the transformation of the urban green space pattern, this study analyzed the mutual conversion between urban green space types in Beijing through the transposition matrix of urban green space types. The increase in green area was mainly from cultivated land from 2000 to 2005. A total of 219.63 km2 of cultivated land was converted into forest land and grassland, accounting for 76.58% and 47.30% of the converted areas of forest land and grassland, respectively, which were concentrated in the north, east, and south of the urban-rural transition zone. At the same time, 60.82 km2 of green space was transferred out, mainly for construction land, scattered in the entire urban-rural transition zone. On the whole, the policy of returning farmland to forest and grassland implemented by Beijing in 2002 has achieved remarkable results. The area of urban green space transferred from 2005 to 2010 was lower than that transferred during 2000-2005. Construction land was the main source of the increase in the green area. The transferred area is 70.27 km2, mainly in the inner area of the central city. Compared with 2000-2005, the transferred area of green space has increased significantly. The total transferred area is 460.23 km2, of which 51.31% was converted to construction land and 29.50% was converted to cultivated land. Forest land is the main type of green space transfer, and it is mainly converted into construction land and cultivated land. The transfer areas are 119.30 km2 and 106.18 km2, respectively, and they are concentrated in the urban-rural transition zone and the new urban area. From 2010 to 2015, the transferred-in area of urban green space increased. The total transferred-in area of green space is 260.45 km2, mainly from construction land and cultivated land, which accounted for 45.03% and 38.63% of the total transferred-in area of green space, respectively. Among the two, the cultivated land is mainly converted to forest land, and most of the construction land is converted to grassland. At the same time, some of the green space was transferred out, mainly to construction land, and accounting for 66.67% of the total green space transferred out. Among the contributing types, the areas of forest land and grassland converted to construction land are 46.36 km2 and 34.62 km2, respectively. Spatially, the transformation of each category is mainly distributed in the northern, eastern and southern parts of the urban-rural transition zone and the new urban area. From 2015 to 2020, the transferred-in area of urban green space has increased significantly, and the total transferred-in area of green space reached 698.55 km2. This was mainly from construction land and cultivated land, which accounted for 47.94% and 30.22% of the total area of green space transferred. Among these two, the total areas of converted forest land and grassland are 469.81 km2 and 228.74 km2, respectively. At the same time, the transfer area of urban green space has also increased to 310.88 km2. Construction land is the main type of green space transfer. The areas of forest land and grassland converted to construction land are 72.58 km2 and 62.02 km2, respectively, accounting for 54.51% and 34.86% of the total forest land and grassland transfer areas. The transformations of the different regions are mainly distributed in the urban-rural transition zone and the new urban area (Fig. 4).
Fig. 4 The spatial distribution of land conversion types in Beijing urban areas for 2000-2005, 2005-2010, 2010-2015 and 2015-2020.
Urban green space has slowed the environmental degradation caused by the rapid urbanization in urban development. The spatial pattern of green space is a direct manifestation of the transformation of the urban environment by humans. Therefore, quantitative research on the pattern of green space can provide a scientific basis for urban greening. This study evaluates the trend of urban green space change from the connectivity and fragmentation of the green space pattern, and selects the Total Patch Area (TA), the Number of Patches (NP), the Splitting Index (SPLIT), the Mean Patch Fractal Dimension (FRAC_MN) and Shannon’s Diversity Index (SHDI) as the five indexes for quantitatively expressing the current situation and changes in the green space pattern.
From 2000 to 2020, TA increased from 703.45 km2 to 1248.03 km2, an increase of 77.41%. TA reflects the size of the green space patch, which indicates that the urban green space landscape in Beijing was getting larger and larger during the study period. NP reflects the number of green patches in the city. From 2000 to 2010, the number of green patches in Beijing decreased from 11326 to 6451, indicating that the degree of patch fragmentation was gradually recovering. However, by 2020, the number of patches gradually increased, and had increased to 57913 blocks, which shows that the green landscape patches were gradually fragmenting from 2010 to 2020, mainly due to the establishment of multiple country parks and wetland parks in Beijing at this stage. FRAC_MN reflects the complexity of the patch boundary. FRAC_MN did not change very much from 2000 to 2005, indicating that the green patch shape did not change much during this period. From 2005 to 2020, FRAC_MN decreased at first and then increased, which indicates that during this period, the shape of the green patch became more complicated, then simpler, and finally more complicated again. SPLIT reflects the connectivity of the greenbelt ecosystem. From 2000 to 2020, SPLIT increased from 25.4006 to 267.6366, an increase of 953.66%, indicating that the types of focal patches were reduced and subdivided into smaller patches. SHDI reflects the complexity and stability of urban green space patches. From 2000 to 2015, SHDI continued to increase from 0.5215 to 1.6448, indicating that the landscape types in the study area tended to be diversified; and the landscape diversity in 2020 was 1.3928, a decrease of 15.32% compared to 2015, indicating a slight decrease in landscape diversity at this stage, but the overall landscape types still tended to be diversified from 2000 to 2020 (Table 1).
Table 1 Green space landscape pattern index values in 2000, 2005, 2010, 2015 and 2020.
Year TA NP FRAC_MN SPLIT SHDI
2000 70345.13 11326 1.1106 25.4006 0.5215
2005 98666.59 13871 1.1107 47.1498 0.5826
2010 71784.66 6451 1.0989 99.0199 1.4990
2015 86035.83 8093 1.0960 141.8411 1.6448
2020 124802.65 57913 1.1119 267.6366 1.3928
Overall, the miniaturization of green space landscape patches and the interlacing and interspersing of different green space types in Beijing from 2000 to 2020 have made the green space landscape patterns more diversified and complicated, and the green space patch shapes have become increasingly irregular and complicated. From 2000 to 2010, the fragmentation of the green space landscape gradually decreased, while the connectivity of green space patches continued to increase from 2000 to 2020. This is mainly because Beijing’s green space landscape changes were strongly affected by human activities. In 2000-2005, due to the reconstruction of a large number of green spaces for the 2008 Beijing Olympic Games, the degree of fragmentation of the green space landscape pattern increased significantly. In 2005-2010, the green space reconstruction activities decreased, and at the same time the partially broken green spaces disappeared, the fragmentation of the green landscape declined, and the types became concentrated in artificial forests and artificial grasslands. The fragmentation of the landscape then increased after 2010, mainly due to the fact that Beijing has built small and micro green spaces in the central area, and the types of land use have been abundant.

3.2 Changes in urban green space ecosystem services

This study evaluated the six ecosystem services of dust retention, SO2 absorption, NO2 absorption, cooling and humidification, carbon fixation and oxygen release, and rainwater runoff reduction in Beijing urban green space in 2000, 2005, 2010, 2015 and 2020. The results show that from 2000 to 2020, the amounts of dust retention, SO2 absorption, NO2 absorption, cooling and humidification, carbon fixation and oxygen release, and rainwater runoff reduction in Beijing’s urban green space all continued to grow. However, there was a decrease in 2010, mainly due to the decrease in urban green area in that year, and after 2010, it continued to increase once again.
From 2000 to 2020, the amount of dust retention increased from 7.22×10⁴ t to 15.04×10⁴ t, an increase of 108% (Table 2). In terms of spatial distribution, dust retention is low in the central urban area and less distributed; while it is more distributed in the urban-rural transition zone, especially in the northwestern region, which is significantly higher than other regions. The dust retention of the new city is low, and the distribution is also less diffuse, but more than that of the central city (Fig. 5).
Table 2 The amounts of green space ecosystem services in Beijing urban areas from 2000 to 2020
Type 2000 2005 2010 2015 2020
Dust retention (102 t) 722.09 929.10 669.46 1001.77 1504.20
SO2 absorption (t) 1784.87 2204.17 1586.82 2241.82 3751.63
NO2 absorption (t) 806.84 1013.51 723.37 1048.06 1715.94
Humidification (106 t) 684.78 861.97 618.33 1142.72 1440.17
Cooling (1012 kJ) 1679.76 2114.41 1516.76 2803.09 3532.73
Carbon fixation (104 t) 29.63 65.98 46.43 74.76 114.09
Oxygen release (104 t) 21.63 48.17 33.90 54.58 83.29
Rainwater runoff reduction (106 t) 258.23 292.15 288.67 361.81 344.28
Fig. 5 Spatial distribution of dust retention from 2000 to 2020
From 2000 to 2020, SO2 absorption increased from 1784.87 t to 3751.63 t, an increase of 110% (Table 2). In terms of spatial distribution, SO2 absorption is low in the central urban area and less distributed; while it is more distributed in the urban-rural transition zone, especially in the northwestern region, which is significantly higher than other regions. The SO2 absorption of the new city is low, and the distribution is also less diffuse, but more than that of the central city (Fig. 6).
Fig. 6 Spatial distribution of SO2 absorption from 2000 to 2020
From 2000 to 2020, NO2 absorption increased from 806.84 t to 1715.94 t, an increase of 113% (Table 2). In terms of spatial distribution, NO2 absorption is low in the central urban area and less distributed; while it is more distributed in the urban-rural transition zone, especially in the northwestern region, which is significantly higher than other regions. The NO2 absorption of the new city is low, and the distribution is also less, but more than that of the central city (Fig. 7).
Fig. 7 Spatial distribution of NO2 absorption from 2000 to 2020
From 2000 to 2020, humidification increased from 6.85×10⁸ t to 14.40×10⁸ t, an increase of 110% (Table 2). In terms of spatial distribution, humidification is low in the central urban area and less distributed; while it is more distributed in the urban-rural transition zone, especially in the northwestern region, which is significantly higher than other regions. The humidification of the new city is low, and the distribution is also less, but more than that of the central city (Fig. 8).
Fig. 8 Spatial distribution of humidification from 2000 to 2020
From 2000 to 2020, the amount of cooling increased from 1.68×10¹⁵ kJ to 3.53×10¹⁵ kJ, an increase of 110% (Table 2). In terms of spatial distribution, cooling is low in the central urban area and less distributed; while it is more distributed in the urban-rural transition zone, especially in the northwestern region, which is significantly higher than other regions. The cooling of the new city is low, and the distribution is also less, but more than that of the central city (Fig. 9).
Fig. 9 Spatial distribution of cooling from 2000 to 2020
From 2000 to 2020, the amount of CO2 fixation increased from 29.63×10⁴ t to 1.14×10⁶ t, an increase of 285% (Table 2). In terms of spatial distribution, CO2 fixation is low in the central urban area and less distributed; while it is more distributed in the urban-rural transition zone, especially in the northwestern region, which is significantly higher than other regions. The CO2 fixation of the new city is low, and the distribution is also less, but more than that of the central city (Fig. 10).
Fig. 10 Spatial distribution of carbon fixation from 2000 to 2020
From 2000 to 2020, the amount of O2 released increased from 21.63×10⁴ t to 83.29×10⁴ t, an increase of 285% (Table 2). In terms of spatial distribution, O2 released is low in the central urban area and less distributed; while it is more distributed in the urban-rural transition zone, especially in the northwestern region, which is significantly higher than other regions. The O2 released of the new city is low, and the distribution is also less, but more than that of the central city (Fig. 11).
Fig. 11 Spatial distribution of oxygen release from 2000 to 2020
From 2000 to 2020, the amount of rainwater runoff reduction increased from 1.81×10⁸ t to 4.30×10⁸ t, an increase of 136% (Table 2). In terms of spatial distribution, rainwater runoff reduction is low in the central urban area and less distributed; while it is more distributed in the urban-rural transition zone, especially in the northwestern region, which is significantly higher than other regions. The rainwater runoff reduction of the new city is low, and the distribution is also less, but more than that of the central city (Fig. 12).
Fig. 12 Spatial distribution of rainwater runoff reduction from 2000 to 2020

3.3 The relationship between urban green landscape changes and ecosystem services

With the changes in the green space landscape, the functional quantity and spatial distribution of the green space ecosystem services have also changed correspondingly. In order to understand the relationships between them, this study calculated the Pearson correlation coefficients between the green space landscape indexes and ecosystem services from 2000 to 2020 (Table 3). The results show that TA has the highest correlation with ecosystem services as a whole. Except for the correlation coefficient with rainwater runoff reduction of 0.583, the correlation coefficients between TA and other ecosystem services are all higher than 0.85. Among them, TA is most strongly related to NO2 absorption, as the correlation between them is the highest, reaching 0.957. This shows that the changes in the ecosystem services are mainly affected by the changes in the green area, and these changes increase with the increase of the green area. FRAC_MN has the lowest correlations with ecosystem services, and the correlation coefficients are all below 0.45, indicating that the changes in ecosystem services have little correlation with the shape of the green patches. Among the ecosystem services, the rainwater runoff reduction is negatively correlated with FRAC_MN, and the correlation coefficient is -0.378, indicating that the rainwater runoff reduction will decrease as the complexity of the green patch shape increases to a certain extent. From the perspective of ecosystem services, dust retention, NO2 absorption, carbon fixation, and oxygen release have the highest correlations with TA. The increase in ecosystem services is mainly affected by changes in the green area. The larger the green area, the greater the amounts of dust retention, NO2 absorption, carbon fixation and oxygen release; and the correlation between SO2 absorption and NP is the highest, indicating that the change is mainly affected by the number of green patches. The more patches, the more SO2 is absorbed by the green. Cooling and humidification and SPLIT have the highest correlations, indicating that both cooling and humidification gradually increase with the fragmentation of the green landscape. Compared with other ecosystem services, rainwater runoff reduction and SHID have the strongest correlation, with a correlation coefficient of 0.757, indicating that rainwater runoff reduction is mainly affected by the diversity of green landscapes. The richer the landscape, the greater the rainwater runoff reduction. An increase in the area of a single type of green space does not significantly increase the amount of rainwater runoff reduction.
Table 3 Correlation coefficients between green space landscape indexes and ecosystem services
Type TA NP FRAC_MN SPLIT SHDI
Dust retention 0.955 0.917 0.362 0.881 0.309
SO2 absorption 0.955 0.957 0.445 0.869 0.250
NO2 absorption 0.957 0.948 0.424 0.873 0.266
Humidification 0.874 0.800 0.164 0.878 0.433
Cooling 0.874 0.800 0.164 0.878 0.433
Carbon fixation 0.942 0.830 0.174 0.907 0.469
Oxygen release 0.942 0.830 0.174 0.907 0.469
Rainwater runoff reduction 0.583 0.413 -0.378 0.781 0.757

Note: Significance level is 0.05.

4 Discussion

Urban green space refers to the vegetation space built by making full use of natural conditions, landform characteristics, basic planting (natural vegetation) and zonal garden plants within the built-up area. This study includes forest and grassland. Urban green space has played an important role in improving the urban atmospheric environment and ensuring urban ecological safety. Building a good urban green space landscape pattern and maximizing its ecosystem services is an important way to achieve sustainable urban development. Taking Beijing as an example, this paper conducts a quantitative analysis of the urban green space landscape pattern changes, evaluates the urban green space ecosystem services and their temporal and spatial change patterns, and finally evaluates the impact of urban green space landscape changes on their ecosystem services. From 2000 to 2020, Beijing’s green area and green area coverage have shown an overall upward trend, indicating that the construction of urban green space in this stage has achieved significant results. From 2000 to 2005, as affected by the policy of returning farmland to forests and grassland, the area of cultivated land was transformed into green space. From the perspective of the green landscape index, the landscape pattern of Beijing’s green landscape has become more diversified and complex from 2000 to 2020, mainly due to strong human influences. The 2008 Beijing Olympics led to the renovation of a large number of green spaces, resulting in a significant increase in the fragmentation of the green landscape pattern, and subsequent green space reconstruction activities decreased so the fragmentation of the green landscape was reduced, and the types became concentrated in artificial forests and artificial grasslands. After 2010, Beijing began to construct small and micro green spaces in the central area, and the types of land use were abundant, which increased the fragmentation of the landscape at this stage. This study of the relationship between changes in Beijing’s urban green space landscape and ecosystem services found that the changes in ecosystem services are mainly affected by changes in green space and are positively correlated. Therefore, the changing trends of various ecosystem services in Beijing’s green space from 2000 to 2020 are directly affected by the change in the green area.
Based on this study, it is now known that the number of green spaces in Beijing is increasing, and the quality is gradually improving. Green space has a certain role in improving the quality of the atmospheric environment. For the entire study area, the green space has played an important role in reducing PM2.5 and stagnant dust, absorbing SO2 and NO2, as well as cooling and humidifying. In order to optimize Beijing’s green space and maximize its role in improving the atmospheric environment, this study puts forward three suggestions.
(1) With the continuous development of cities, rural land has begun to be transformed into urban land, and the farmland and other natural vegetation have been continuously transformed into construction land and artificial green space. This process may lead to a reduction in the green area. Therefore, in the future construction of green space, it should be built with a relatively complex community structure, the proportion of arbor in the green space should be increased, and the quality of the green space ecosystem should be improved.
(2) The increasing trend of NP indicates that the spatial distribution of urban green space is gradually becoming more fragmented and scattered, and the urban area of Beijing lacks large green spaces. In the future construction of green space, it is necessary to retain the existing large-scale green space, limit the erosion of the existing large green space in the further expansion of the city, and avoid the further reduction and fragmentation of the large green space.
(3) In order to maximize the effect of green space on the improvement of the atmospheric environment, in addition to considering landscape aesthetics, the construction of green space should also consider the purification effect of different green spaces on the atmospheric environment. For example, tree species such as redbud, locust tree and crape myrtle should be added to provide green space with dust retention capacity; new green space should be dominated by mixed forests, dense shrubs, and artificial forests with a canopy density of more than 85%, to play the role in reducing PM2.5. In addition, the newly built green space should include arbor species so it can play a role in cooling and humidifying.
Finally, there are also some shortcomings in this research. Due to the limitations of available data, it lacks continuous time research and any research on the mechanism of greenbelt ecological environment function. These deficiencies still need to be improved in future research.

5 Conclusions

(1) From 2000 to 2020, the construction of urban green space has achieved remarkable results. The area of urban green space has increased from 703.45 km2 to 1248.03 km2, an increase of 77.41%. From 2000 to 2020, the increase in the area of urban green space has mainly come from cultivated land and construction land, mostly in the urban-rural transition zone and new urban areas. The analysis of the landscape pattern index shows that the scope of the urban green space landscape in Beijing is becoming larger and larger, the patches are gradually fragmenting, green space reconstruction activities are more active, and the overall landscape types are still diversifying.
(2) From 2000 to 2020, the amounts of dust retention, SO2 absorption, NO2 absorption, cooling and humidification, carbon fixation and oxygen release, and rainwater runoff reduction of urban green space in Beijing have shown continuous increases in general. In terms of space, as affected by the spatial distribution of green space, these six ecosystem services are relatively low in the central urban area and less distributed; while they are more distributed in the urban-rural transition zone, especially in the northwestern region, which is significantly higher than other areas. The ecosystem services of the new city are relatively low, and the distribution is also less, but more than that of the central city.
(3) There is a close relationship between the landscape changes of urban green space in Beijing and the green space ecosystem services. On the whole, TA has the highest correlation with ecosystem services. Except for rainwater runoff reduction, the correlation coefficients between TA and ecosystem services are all higher than 0.85. These correlations show that the changes of ecosystem services are mainly affected by the change in the green area, and they increase with the increase in the green area. FRAC_MN has the lowest correlation with ecosystem services, and the correlation coefficients are all below 0.45, indicating that the changes in various ecosystem services have little correlation with the shape of the green patches.
[1]
Ashie Y, Thanh C V, Asaeda T. 1999. Building canopy model for the analysis of urban climate. Journal of Wind Engineering and Industrial Aerodynamics, 81(1-3): 237-248.

DOI

[2]
Ca V T, Asaeda T, Abu E M. 1998. Reductions in air conditioning energy caused by a nearby park. Energy and Buildings, 29(1): 83-92.

DOI

[3]
Chen F, Zhou Z X, Guo E X, et al. 2006. Dust-retention effect of ornamental green land in urban industrial area: A case study in Wuhan Iron and Steel Company workshop area. Chinese Journal of Ecology, 25(1): 34-38. (in Chinese)

[4]
Chen Z X, Su X H, Liu S Z, et al. 1998. Research on the ecological benefits of urban gardens and greening in Beijing (2). Chinese Landscape Architecture, 14(2): 51-54. (in Chinese)

[5]
Fu H N, Yan L Z, Zhang L Q, et al. 2000. Study on ecological structure of the ornamenfal plants community in Shanghai. Chinese Landscape Architecture, 16(2): 22-25. (in Chinese)

[6]
Ge D. 2020. The dynamic research on landscape pattern of urban green space and parks accessibility in Yanqing District. Diss., Beijing, China: Beijing Forestry University. (in Chinese)

[7]
Gill S E, Handley J F, Ennos A R, et al. 2007. Adapting cities for climate change: The role of the green infrastructure. Built Environment, 33(1): 115-133.

DOI

[8]
Gluch R, Quattrochi D A, Luvall J C. 2006. A multi-scale approach to urban thermal analysis. Remote Sensing of Environment, 104(2): 123-132.

DOI

[9]
He Y F, Tang L Y, Chen Y H, et al. 2012. Physiological properties of six types of plant leaves in Beijing and surrounding area. Journal of China Agricultural University, 17(3): 81-87. (in Chinese)

[10]
Hu F W, Hu X J, Luo Z W, et al. 2021. Dynamic analysis of landscape pattern of park green space in Shanghang County. Ecological Science, 40(2): 133-141. (in Chinese)

[11]
Kang B W, Liu J J, Wang D X, et al. 2003. Study on dust catching properties of major afforestation tree species in Shaanxi. Shaanxi Forest Science and Technology, (4): 54-56. (in Chinese)

[12]
Kikegawa Y, Genchi Y, Kondo H, et al. 2006. Impacts of city-block-scale countermeasures against urban heat-island phenomena upon a building’s energy-consumption for air-conditioning. Applied Energy, 83(6): 649-668.

DOI

[13]
Leng P S, Su S C. 2001. Landscape ecology. Beijing, China: China Meteorological Press.

[14]
Luo F. 2017. Study on temporal and spatial dynamics of urban green space landscape pattern and its driving forces in Taiyuan. Diss., Xi’an, China: Xi’an Technological University. (in Chinese)

[15]
Luo H Y, Li J Y, Liu Z. 2000. Effect of purifying SO2 in atmosphere by greening tree species. Journal of Beijing Forestry University, 22(1): 45-50. (in Chinese)

[16]
Meredith M L, Hites R A. 1987. Polychlorinated biphenyl accumulation in tree bark and wood growth rings. Environmental Science & Technology, 21(7): 709-712.

DOI

[17]
Qigelhen, He B Y, Huang L. 2019. Dynamic change of urban greenbelt landscape pattern based on GIS and fragstats—A case study of Urumqi, Xinjiang. Journal of Anhui Agricultural Sciences, 47(15): 72-77. (in Chinese)

[18]
Sun S P. 2003. Effect of virescence on inhalable particulate (PM10) and dustfalls in downtown of Beijing. Diss., Beijing, China: China Agricultural University. (in Chinese)

[19]
Trapp S, Miglioranza K S B, Mosbæk H. 2001. Sorption of lipophilic organic compounds to wood and implications for their environmental fate. Environmental Science & Technology, 35(8): 1561-1566.

DOI

[20]
Wang L, Ha S, Liu L Y, et al. 2006. Effects of weather condition in spring on particulates density on conifers leaves in Beijing. Chinese Journal of Ecology, 25(8): 998-1002. (in Chinese)

[21]
Wei X Y, Cai J H, Ye Y C, et al. 2018. Landscape pattern analysis and optimum design of park green space in Nanchang City, China based on GIS. Chinese Journal of Applied Ecology, 29(9): 2852-2860. (in Chinese)

[22]
Yang R Q, Yang X M, Xu D L. 2020. Study on change of urban green space landscape pattern driven by construction of eco-garden city. Journal of Guangxi Normal University (Natural Science), 38(6): 140-147. (in Chinese)

[23]
Zhang H, Li F R, Zhang T H, et al. 2003. Evaluation of ecological services of Populus simonii forest Heerqin sandy land. Chinese Journal of Applied Ecology, 14(10): 1591-1596. (in Chinese)

PMID

[24]
Zhang S C, Hui S B, Xie S C, et al. 2003. Rainwater utilization in Beijing. Beijing Water, (4): 20-22, 44. (in Chinese)

[25]
Zhao Y, Li S R, Yan Z P. 2002. The effect of greenland on absorbed dust and its assessment method. Journal of Huazhong Agricultural University, 21(6): 582-586. (in Chinese)

Outlines

/