Analyzing Livelihood

Assessment of Climate Suitability for Human Settlements in Tibet, China

  • LIN Yumei , 1, * ,
  • ZHU Fuxin 2 ,
  • LI Wenjun 1, 3 ,
  • LIU Xiaona 4
Expand
  • 1. Institute of Geographic Sciences and Natural Resources Research, Chinese Academy of Sciences, Beijing 100101, China
  • 2. The National Tibetan Plateau Data Center, Key Laboratory of Tibetan Environmental Changes and Land Surface Processes, Institute of Tibetan Plateau Research, Chinese Academy of Sciences, Beijing 100101, China
  • 3. University of Chinese Academy of Sciences, Beijing 100049, China
  • 4. Beijing Municipal Research Institute of Eco-Environment Protection, National Urban Environmental Pollution Control Engineering Research Center, Beijing 100037, China
*LIN Yumei, E-mail:

Received date: 2021-05-07

  Accepted date: 2021-07-17

  Online published: 2022-07-15

Supported by

The Second Tibetan Plateau Scientific Expedition and Research Program(2019QZKK1006)

The Strategic Priority Research Program of Chinese Academy of Sciences(XDA20010201)

The Strategic Priority Research Program of Chinese Academy of Sciences(XDA20010203)

The National Natural Science Foundation of China(41901086)

The National Natural Science Foundation of China(41901260)

The Beijing Natural Science Foundation(5204033)

Abstract

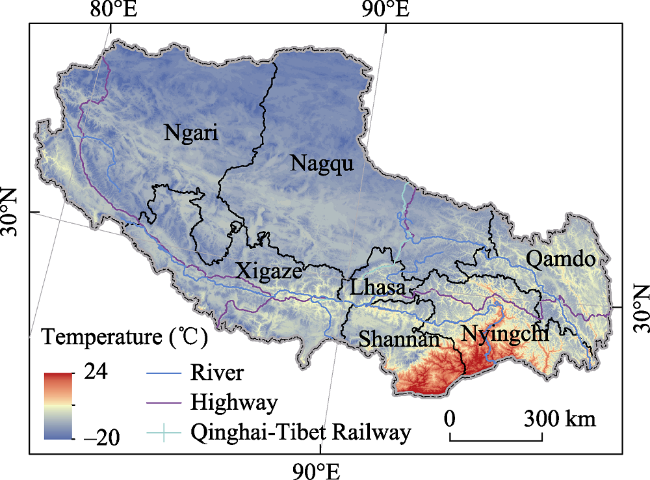
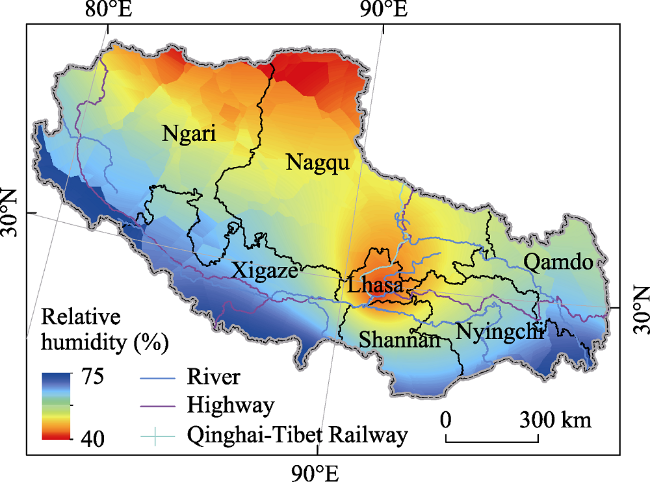
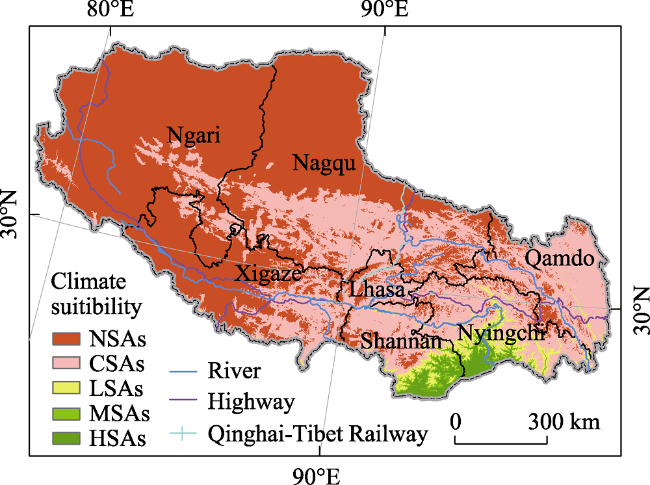
Climate is an important factor that affects the livability of a region. The climate suitability of a region’s environment for human settlement profoundly affects the regional socio-economic development and the population distribution. Tibet is an area that is sensitive to climate change. Given the impact of global climate change, the climate suitability of Tibet has undergone significant changes. In this study, the temperature humidity index (THI) values for Tibet were calculated, and the relationships between the population distribution and the THI were analyzed quantitatively. In this way, the zoning standards for climate suitability in Tibet were determined such that the climate suitability could be evaluated. The results show that the average annual temperature in the southeast of Tibet, where the population was densely distributed, was relatively high. The mean annual relative humidity showed a trend of gradually decreasing from south to north. Regions with a suitable climate, including the high suitability areas (HSAs), the moderately suitable areas (MSAs) and the low suitability areas (LSAs), accounted for only 7.90% of the total area but accommodated over 40% of the total population. The critically suitable areas (CSAs) accounted for 37.81% of the land area and 48.24% of the total population. Non-suitable areas (NSAs) were widely distributed in Tibet and accounted for 54.29% of the total area and 11.33% of the total population. The results of this study may provide a reference for guiding the reasonable distribution of population and promoting the optimization of the spatial planning in Tibet.

Cite this article

LIN Yumei , ZHU Fuxin , LI Wenjun , LIU Xiaona . Assessment of Climate Suitability for Human Settlements in Tibet, China[J]. Journal of Resources and Ecology, 2022 , 13(5) : 880 -887 . DOI: 10.5814/j.issn.1674-764x.2022.05.012

1 Introduction

The development of the economy and society have made people pay increasing attention to issues such as whether the living environment is comfortable or not (Li et al., 2012). A suitable human settlement not only helps to improve work efficiency, but also benefits people's physical and mental health. The status and changing trends of human settlements are affected by many factors such as the natural environment, the cultural and social environment, and the economic environment (Ma et al., 2014). Climate is an important factor of the natural environment that affects the regional human settlements, and climate suitability is an essential basis for the evaluation of regional livability (Cao and Wang, 2017). Since the 1980s, the climates of many countries and regions around the world have undergone significant changes (Porter et al., 2014). Changes in climatic conditions can affect the comfort of the human body to a considerable extent, thereby affecting the environmental livability of the region in question. Therefore, assessing the climate suitability of human settlements is of great significance for the comprehensive development of regional climate resources and the migration and flow of the populations.
Climate suitability assessments have been conducted since the 1920s. In 1923, Houghten and Yaglou proposed the effective temperature (ET) index (Houghten and Yaglou, 1923). This index reflects the comprehensive influence of temperature and humidity on human comfort, creating a precedent for the use of empirical models to evaluate climate suitability. Since then, with the development of biometeorology and the widespread application of computer technology, researchers have studied the human body’s perception of cold and heat based on heat balance. At present, a variety of physiological climatic indicators are used to evaluate the impact of climatic conditions on human comfort, such as the wind chill index (WCI) (Siple and Passel, 1945), the discomfort index (DI) (Epstein and Moran, 2006), the wind effect index (WEI) (Terjung, 1966), the temperature humidity index (THI) (Oliver, 1973), and the heat index (HI) (Rothfusz, 1990). Among them, the THI is the index which has been most widely adopted in many countries and regions around the world given that it is applicable to various environments, including cold, moderate, and hot environments (Francesca et al., 2011). Emmanuel (2005) used the THI to study the changes in climate comfort in Colombo, the capital of Sri Lanka, during the process of urbanization. Kong et al. (2020) used the THI to assess China’s climate suitability. Many studies have focused on the impacts of climate change (Vaneckova et al., 2011; Vezzulli et al., 2016; Mora et al., 2017) and urbanization (Emmanuel, 2005; Oleson et al., 2013) on human health based on temperature and humidity data, and these studies all show that the THI is an important bio-meteorological index for evaluating the impact of climate on human comfort.
As the “third pole in the world”, Tibet is located in the mid-latitudes of the northern hemisphere, on the southwestern border of China. It covers an area of about one-eighth of China’s total land area and has an average elevation of more than 4000 m. The harsh climate in some areas is one of the main factors that causes an uneven population distribution in Tibet. Tibet is one of the regions in China that is sensitive to ​​climate change. In recent years, the climate in this region has undergone significant changes (Liu et al., 2008; Wang et al., 2011; Li et al., 2015) which may cause changes in the pattern of climate suitability for human settlements. Studies have been conducted on climate comfort in Tibet in recent years (Cui et al., 2019; Zhong et al., 2020), although some studies (Zhong et al., 2020) focused mainly on the changing trend of the climate index rather than the zoning results of climate suitability. Thus, the spatial characteristics of climate suitability in Tibet in recent years have not been clarified. In addition, the climate suitability zoning standards adopted in a recent study (Cui et al., 2019) still followed the traditional standards that were applicable at different scales. There are currently no specific zoning standards for Tibet that have been determined according to the living habits and climate adaptation characteristics of the people in this region. In view of this deficiency, this study aims to: 1) Calculate the THI for Tibet based on multi-year climate data at the raster scale; 2) Analyze the relationship between the population density and the THI; 3) Use the results of that relationship to determine the climate suitability zoning standards for Tibet; 4) Assess the climate suitability of human settlements. The results of this study may provide a reference for promoting a reasonable population distribution in Tibet, and in so doing promote further urbanization.

2 Data and methods

2.1 Data sources and processing

The data used in this study were mainly climate and population data. Climate data included the multi-year mean temperature and relative humidity data. The population data refer to the population density data.
The temperature data were derived from the Climatologies at High Resolution for the Earth’s Land Surface Areas (CHELSA) dataset provided by the Swiss Federal Institute (Karger et al., 2017). The dataset includes the monthly mean temperature and precipitation, as well as the annual mean temperature and precipitation from 1979 to 2013 with a spatial resolution of 30 arc seconds (about 1 km). All CHELSA products use the geographic coordinate system of the WGS 84 horizontal datum, with degrees as the unit. The Swiss Federal Institute has cross-validated the dataset with weather station data from different regions over the years before releasing the dataset. ArcGIS technology was used to convert the spatial resolution of the data from 30 arc seconds to 1 km through resampling and the data for Tibet were obtained using the extract by mask tool.
Since the relative humidity is not included in the CHELSA dataset, we interpolated the gridded relative humidity based on the data from in-situ observations. The original relative humidity data used in this study came from the monthly climate dataset of meteorological stations from 1980 to 2017 provided by the National Meteorological Information Center of China. The monthly data for each station include the mean relative humidity data and station information such as latitude, longitude, and altitude. Based on this dataset, the multi-year mean relative humidity data for each station were calculated. Using ArcGIS technology, a kriging method was adopted to interpolate the relative humidity data of the stations into raster data at a resolution of 1 km × 1 km. Due to the lack of meteorological observation stations in the northwestern part of Tibet, we selected the relative humidity data from meteorological stations within Tibet and the surrounding countries and regions for interpolation to improve the accuracy of the raster data.
The population density data were derived from the Land-Scan 2015 dataset provided by the Oak Ridge National Laboratory in the United States (https://landscan.ornl.gov/). This dataset was derived from the census data of provincial administrative units around the world, which was decomposed into a population distribution database with a resolution of 30 arc seconds. A dataset for the population density at 1 km×1 km for regions throughout Tibet in 2015 was then compiled using ArcGIS technology.

2.2 Methods

2.2.1 THI model

It has been reported that since the temperature and relative humidity both directly impact the body heat exchange, the combination of these two parameters can best predict the times when climatic conditions will have a fatal impact on the human body compared to all the other combinations of the adopted climate parameters (Mora et al., 2017). In addition, the warming and humidification have been the most significant characteristics of the climate in Tibet (Liu et al., 2008; Wang et al., 2011). The THI is a classic index describing the human body’s comprehensive experience of environmental temperature and humidity, and it is an important indicator for measuring the suitability of the regional climate. Therefore, we selected THI, which is composed of temperature and relative humidity, to assess the climate suitability of the human settlements in Tibet. The formulae for the THI are as follows:
$THI=T-0.55\times (1-RH)\times (T-58)$
$T=1.8\text{t}+32$
where T denotes the mean air temperature in Fahrenheit (°F) measured throughout the assessment period, t denotes the mean air temperature in Celsius (℃), and RH is the mean relative air humidity.

2.2.2 Zoning criteria for climate suitability of the human settlements

Studies have shown that there are significant differences in the climate comfort ranges for people living in different regions of the world (Hartgill et al., 2011; Pallubinsky et al., 2015; Toy and Kantor, 2017; Pallubinsky et al., 2019). For example, people living in high-latitude and high-altitude areas are more adapted to cold climates, while people living in low-latitude and low-altitude areas are more adapted to hot climates. Previous studies adopted the same zoning criteria to assess the climate suitability of different regions (Tang et al., 2008; Zhong et al., 2020), which would neglect the differentiation of human comfort in different regions. In order to assess the climate suitability of human settlements in Tibet in a more scientific and rational way, the existing zoning criteria were revised according to the relationship between the population density and THI to obtain a new set of zoning standards for Tibet.

3 Results

3.1 Temperature analysis

Tibet is at a relatively high altitude and the Tibetan Plateau has an alpine climate. The raster data showed that the mean annual temperature in Tibet was between -20 ℃ and 24 ℃ and exhibited a spatial trend of decreasing from southeast to northwest (Fig. 1).
Fig. 1 Distribution of the annual mean temperature in Tibet
The regions with an annual mean temperature of less than -5 ℃ accounted for 32.84% of the total area of Tibet but only encompassed 3.15% of the total population (Fig. 2). These regions were distributed mainly in the northern Tibetan Plateau, the Gangdise Mountains, and the Himalayas. The regions with an annual mean temperature between -5 ℃ and 5 ℃ covered 59.84% of Tibet and comprised 60.03% of the total population. These regions were distributed mainly in most parts of central Tibet. The regions with an annual mean temperature greater than 5 ℃ accounted for 7.32% of the total area, and the corresponding proportion of population was 36.81%. These regions were distributed mainly in the low-elevation areas of southeastern Tibet and the valleys of the Yarlung Zangbo River, the Lhasa River, the Nianchu River, the Nujiang River, and the Lancang River. In general, the high-altitude areas in the northwest of Tibet had a low temperature throughout the year, which resulted in this region being sparsely populated. Most of the central area of this region had an annual mean temperature of around 0 ℃, whereas the southeastern area had a relatively high annual mean temperature and a relatively dense population.
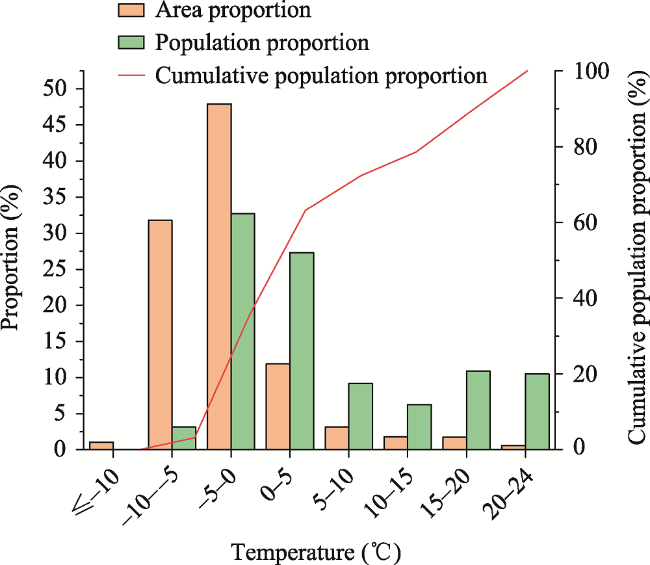
Fig. 2 The proportions of the area and population corresponding to the different temperature ranges and the cumulative population distribution curve for Tibet

3.2 Relative humidity analysis

The annual mean relative humidity in Tibet was between 40% and 75% (Figs. 3 and 4). The regions with an annual mean relative humidity of less than 50% accounted for 29.49% of the total area, mainly in the northern parts of Ngari and Nagqu, and Lhasa. This area supported 26.66% of the total population. Regions with an annual mean relative humidity of between 50% and 65% accounted for 59.60% of the total area and 56.14% of the total population. These regions were mainly distributed in the middle of Ngari and Nagqu, most parts of Xigaze, Shannan and Nyingchi, and the northern part of Qamdo. Regions with an annual mean relative humidity greater than 65% were distributed mainly in the Himalayas and surrounding areas on the southern border of Tibet. These regions accounted for 10.91% of the total area and 17.20% of the total population. The annual mean relative humidity in Tibet exhibited the general trend of a gradual decrease from south to north, and more than half of the population was distributed in areas with an annual mean relative humidity between 50% and 70%.
Fig. 3 Distribution of the annual mean relative humidity in Tibet
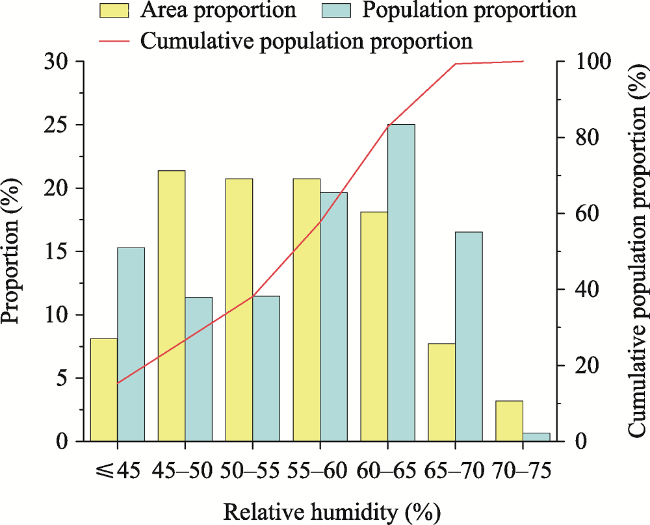
Fig. 4 The proportions of the area and population corresponding to different relative humidity ranges and the cumulative population distribution curve for Tibet

3.3 THI characteristics

The results for the THI showed significant spatial differences in the THI for Tibet (Fig. 5). For instance, the THI in the low-elevation area in the southeast was relatively low, while the THI in the high-elevation areas in the northwest was relatively high.
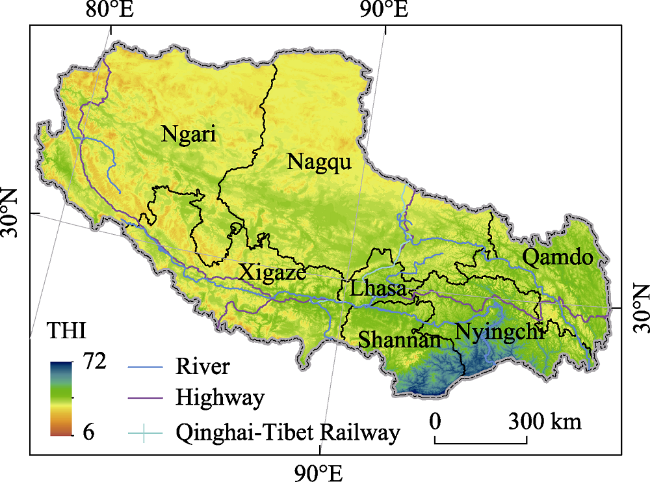
Fig. 5 Distribution of the THI in Tibet
The regions in the cold areas of Tibet with a THI of less than 35 accounted for 54.29% of the total area, but the population density was low, accounting for only 11.33% of the total population (Fig. 6). These regions were mainly located in parts of Ngari, Nagqu and Xigaze. Figure 6 shows that when the THI was higher than 35, the proportions of the population increased significantly. When the THI rose from 35 to 50, the cumulative proportion of the population rose from 11.33% to 71.03%. The regions with a THI between 35 and 50 accounted for 40.72% of the total area, and the proportion of the population was 59.70%. This population was located mainly in the central and eastern parts of Tibet, including the southern part of Nagqu, the eastern part of Xigaze, the northern parts of Shannan and Nyingchi, and most parts of Qamdo. The regions with a THI between 50 and 60 encompassed 2.63% of the total area and had 7.60% of the total population. These regions were located mainly in the southern parts of Shannan and Nyingchi. The regions with a THI between 60 and 72 accounted for only 2.35% of the area, but the population accounted for 21.37% of the total population. These regions were distributed mainly in the various river basins, Cona County in the southeast of Shannan, and Medog County and Zayu County in the south of Nyingchi.
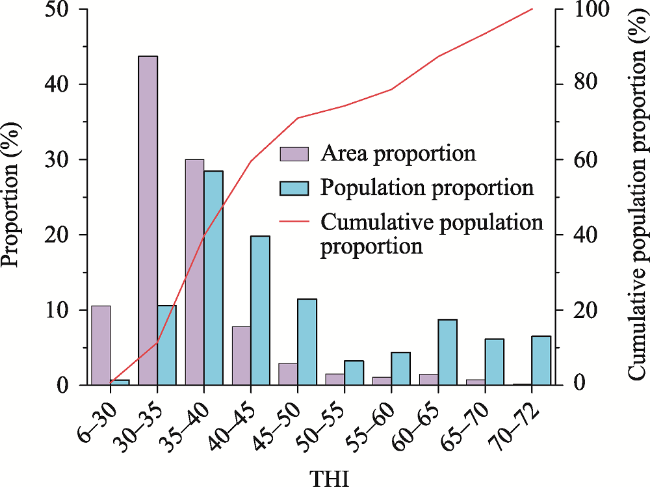
Fig. 6 The proportions of the area and population corresponding to different THI ranges, and the cumulative population distribution curve for Tibet.

3.4 Zoning criteria for climate suitability

In general, there were large areas in Tibet where the THI was less than 35, but the populations in these areas were sparse, indicating that these regions with an extremely cold climate were not suitable for long-term human habitation. Therefore, the regions with a THI of less than 35 were designated as non-suitable areas (NSAs) for human habitation. The areas with a THI between 60 and 72 accounted for only about one-fiftieth of the total area of Tibet, but the proportion of the population was more than one-fifth. These regions were densely populated, indicating that the climate in these regions was suitable for long-term human habitation. Therefore, the regions with a THI between 60 and 72 were classified as highly suitable areas (HSAs) for human habitation. For the other climate suitability types, including the critically suitable areas (CSAs), the low suitable areas (LSAs), and the moderately suitable areas (MSAs), the zoning criteria were determined by adjusting the standards used in existing studies (Tang et al., 2008; Zhong et al., 2020) based on the population density and the THI results from this study (Table 1).
Table 1 Climate suitability criteria for assessment of human settlements in Tibet
THI Body perception Climate suitability
≤35 Freezing cold NSA
35-45 Cold CSA
45-55 Slightly cold LSA
55-60 Chilly MSA
60-72 Cool or warm HSA
The NSA category refers to regions with a THI lower than 35, whereby the climate is extremely cold and it is not a suitable place for people to live. The CSA category refers to regions that are severely compromised as a result of the climatic conditions and are barely suitable for humans to live all year round. The CSA category is transitional, whereby the climate may or may not be suitable to live, and refers mainly to areas with a THI of between 35 and 45. The LSA has a THI of between 45 and 55 and is only moderately affected by climatic conditions so it is generally suitable for human living throughout the year. The MSA with a THI of between 55 and 60 is subject to certain climatic conditions, and these climatic conditions are moderately suitable for human habitation. The HSA with a THI of between 60 and 72 has superior climatic conditions and is most suitable for human habitation.

3.5 Climate suitability of the environment for human settlements

According to the zoning criteria, the climate suitability of regions in Tibet was assessed based on the raster data.
The assessment results (Fig. 7) showed that the HSAs, which had a highly suitable climate, occupied 2.35% of the total land area of Tibet, and were distributed mainly in Cuona County in the southeast of Shannan, in most of Medog County in the south of Nyingchi, and the valley area of the lower reaches of the Yarlung Zangbo River. Due to the favorable climate, the population density in the HSAs was relatively high, and accounted for 21.37% of the total population. The MSAs with a more suitable climate, which were distributed mainly around the HSAs, occupied 1.10% of the total land area and comprised 4.37% of the total population. The LSAs with a generally suitable climate were distributed mainly in the valleys of the Nu River and the southern section of the Lancang River, the central and southern regions of Shannan and Nyingchi, and the Yarlung Zangbo River Valley in the north of Nyingchi, and these regions accounted for 4.44% of the total area and 14.70% of the population. Overall, the regions with suitable climatic conditions (that is, the HSAs, MSAs and LSAs) accounted for 7.90% of the total land area of Tibet, distributed mainly in the southern areas of Nyingchi and Shannan. However, given their relatively comfortable climatic conditions, which are conducive to good productivity and a good quality of life, the population density was relatively high, accounting for more than 40% of the total population. The CSAs accounted for 37.81% of the total area and 48.24% of the total population, and were distributed mainly in the southeast of Ngari, the south of Nagqu, the east of Xigaze, the north of Shannan and Nyingchi, and most of Qamdo. The NSAs were widely distributed, accounting for 54.29% of the total area and 11.33% of the total population. They were distributed mainly in most parts of Ngari, northern Nagqu and northwestern Xigaze. Although the area of the NSAs was vast, the population density was relatively low due to the bitterly cold climate.
Fig. 7 Climate suitability assessment for human settlements based on the THI values in Tibet

4 Discussion

A climate suitability assessment of the human living environment in Tibet has been carried out on the premise that people would not resort to using additional equipment and facilities to protect themselves from the extreme hot and cold conditions, and the impact of contributions by science and technology to people’s resistance to adverse climatic conditions was not considered. Therefore, the findings of this study may be slightly pessimistic compared with the actual situation. Nevertheless, our study and previous research (Pubu et al., 2012; Yu et al., 2014) obtained similar results. Pubu et al. (2012) reported that the comfort index showed a decreasing distribution pattern from the southeast to the northwest, and areas with a comfortable climate were mainly located in the south of Shannan and Nyingchi. The results of Yu et al. (2014) showed that Nagqu belonged to the uncomfortable climate zone and Nyingchi belonged to the climate comfortable zone. These findings indicated that the results of this study could reasonably reveal the spatial distribution of the climate suitability in Tibet.
Using the results of the relationship between THI and population density to divide climate suitability zones is the highlight of this research, but this method still has shortcomings. In addition to climate, factors affecting population distribution include terrain, policy and other factors. Therefore, it is necessary to study the factors affecting population distribution in greater depth in subsequent research. In fact, the factors affecting the climate suitability of human settlements include radiation, wind speed, and vegetation coverage in addition to temperature and relative humidity (Kong et al., 2019). In subsequent research, we need to comprehensively consider the impacts of multiple factors on climate suitability according to the climatic characteristics of the study area.
In addition, in the context of global climate change, climate warming and frequent extreme weather events have caused the climate suitability of different regions to change, which indicates that the climatic suitability of each region is not static. Carrying out a dynamic evaluation or prediction of climate suitability in the future can enrich our understanding of regional climate suitability, and it can also provide a better scientific basis for realizing a reasonable distribution of the population in the regions and promote the optimization of spatial planning in the regions.

5 Conclusions

This study has calculated the THI values for the regions of Tibet at the grid scale based on the multi-year mean climate data, discussed the relationship between the population distribution and the THI, and comprehensively evaluated the climate suitability of human living environments in Tibet. This analysis leads to four main conclusions.
(1) The high-altitude areas in the northwestern part of Tibet had low temperatures throughout the year, resulting in a sparse population distribution. Most of the central areas had an annual mean temperature of around 0 ℃; however, the southeastern area of this region had a relatively high temperature and a relatively dense population.
(2) The annual mean relative humidity in Tibet showed a gradual decrease from south to north overall, and more than half of the population was distributed in areas with an annual mean relative humidity of between 50% and 70%.
(3) Tibet had a large area with a THI of less than 35, but this area was sparsely populated. In contrast, the area with a THI of between 60 and 72 accounts for only about one-fiftieth of the total land area of Tibet, but the population there was dense accounting for more than one-fifth of the total, thus indicating that the climate in this region is very suitable for long-term human habitation.
(4) The regions of Tibet with a suitable climate (the HSAs, MSAs and LSAs), mainly distributed in the south of Shannan and Nyingchi, accounted for 7.90% of the total land area, and the proportion of the population in these areas exceeded 40% of the total population. The CSAs accounted for 37.81% of the total area and supported 48.24% of the total population. The NSAs were widely distributed with an area accounting for 54.29% of the total and with a population accounting for 11.33% of the total population in Tibet.

This work was supported by Beijing Excellent Talent Training Funding Project. The authors gratefully thank the editors and anonymous reviewers for their comments that helped to improve this manuscript.

[1]
Cao W, Wang S. 2017. Evaluation of climate suitability for urban human settlement in Beijing-Tianjin-Hebei region. Journal of Glaciology and Geocryology, 39 (2): 435-442. (in Chinese)

[2]
Cui Q, Xin C, He T. 2019. Temporal and spatial distribution characteristics of climate comfort in Tibet from 1960 to 2015. Ningxia Engineering Technology, 18(3): 260-264, 270. (in Chinese)

[3]
Emmanuel R. 2005. Thermal comfort implications of urbanization in a warm-humid city: The Colombo Metropolitan Region (CMR), Sri Lanka. Building and Environment, 40(12): 1591-1601.

DOI

[4]
Epstein Y, Moran D S. 2006. Thermal comfort and the heat stress indices. Industrial Health, 44(3): 388-398.

PMID

[5]
Francesca R, Boris I P, Giuseppe R. 2011. Thermal environment assessment reliability using temperature-humidity indices. Industrial Health, 49(1): 95-106.

DOI

[6]
Hartgill T W, Bergersen T K, Pirhonen J. 2011. Core body temperature and the thermoneutral zone: A longitudinal study of normal human pregnancy. Acta Physiologica, 201(4): 467-474.

DOI

[7]
Houghton F C, Yaglou C P. 1923. Determining lines of equal comfort. Journal of the American Society Heating and Ventilation Engineers, 29: 163-176.

[8]
Karger D N, Conrad O, Böhner J, et al. 2017. Climatologies at high resolution for the Earth land surface areas. Scientific Data, 4: 170112. DOI: 10.1038/sdata.2017.122.

DOI

[9]
Kong F. 2020. Multi-temporal scale assessment of climate comfort of habitat environment and spatial differences in China. Journal of Arid Land resources and Environment, 34(3): 102-111. (in Chinese)

[10]
Kong Q, Zheng J, Fowler H J, et al. 2019. Climate change and summer thermal comfort in China. Theoretical and Applied Climatology, 137(1-2): 1077-1088.

DOI

[11]
Li B, Zhou W, Zhao Y, et al. 2015. Using the SPEI to assess recent climate change in the Yarlung Zangbo River Basin, South Tibet. Water, 7: 5474-5486.

DOI

[12]
Li C, Qiu Y Y, Li H. 2012. Evaluation of climate suitability of urban human settlements environment. Resources and Habitant Environmnt, (10): 59-61. (in Chinese)

[13]
Liu W, Guo Q, Wang Y. 2008. Temporal-spatial climate change in the last 35 years in Tibet and its geo-environmental consequences. Environmental Geology, 54(8): 1747-1754.

DOI

[14]
Ma R, Zhang W, Yu J, et al. 2014. Overview and prospect of research on human settlement of Chinese geographers. Scientia Geographica Sinica, 34(12): 1470-1479. (in Chinese)

[15]
Mora C, Dousset B, Caldwell I R, et al. 2017. Global risk of deadly heat. Nature Climate Change, 7(7): 501-506.

DOI

[16]
Oleson K W, Monaghan A, Wilhelmi O, et al. 2013. Interactions between urbanization, heat stress, and climate change. Climatic Change, 129: 525-541.

DOI

[17]
Oliver J E. 1973. Climate and man’s environment:An introduction to applied climatology. New York, USA: John Wiley & Sons, Inc.

[18]
Pallubinsky H, Schellen L, Kingma B R M, et al. 2015. Human thermoneutral zone and thermal comfort zone: Effects of mild heat acclimation. Extreme Physiology & Medicine, 4(S1): A7. DOI: 10.1186/2046-7648-4-S1-A7.

DOI

[19]
Pallubinsky H, Schellen L,van Marken Lichtenbelt W D. 2019. Exploring the human thermoneutral zone—A dynamic approach. Journal of Thermal Biology, 79: 199-208.

DOI PMID

[20]
Porter J R, Xie L, Challinor A, et al. 2014. Food security and food production systems. In: Field C B (ed.). Climate change 2014: Impacts, adaptation, and vulnerability. Cambridge, UK and New York, USA: Cambridge University Press: 485-533.

[21]
Pubu C, Zhuo G, Laba C, et al. 2012. Characteristics variation of human comfort index in Tibet region. Plateau and Mountain Meteorology Research, 32(4): 80-85. (in Chinese)

[22]
Rothfusz L P. 1990. The heat index “Equation” (or, more than you ever wanted to know about heat index). SR 90-23. Fort Worth, Texas: National Oceanic and Atmospheric Administration, National Weather Service, Office of Meteorology. https://wonder.cdc.gov/wonder/help/Climate/ta_htindx.PDF

[23]
Siple P A, Passel C F. 1945. Measurements of dry atmospheric cooling in subfreezing temperatures. Proceedings of the American Philosophical Society, 89(1): 177-199.

[24]
Tang Y, Feng Z, Yang Y. 2008. Evaluation of climate suitability for human settlement in China. Resources Science, 30(5): 648-653. (in Chinese)

[25]
Terjung W H. 1966. Physiologic climates of the conterminous United States: A bioclimatic classification based on man. Annals of the Association of American Geographers, 56(1): 141-179.

DOI

[26]
Toy S, Kantor N. 2017. Evaluation of human thermal comfort ranges in urban climate of winter cities on the example of Erzurum City. Environmental Science and Pollution Research, 24(2): 1811-1820.

DOI

[27]
Vaneckova P, Neville G, Tippett V, et al. 2011. Do biometeorological indices improve modeling outcomes of heat-related mortality? Journal of Applied Meteorology and Climatology, 50(6): 1165-1176.

DOI

[28]
Vezzulli L, Grande C, Reid P C, et al. 2016. Climate influence on Vibrio and associated human diseases during the past half-century in the coastal North Atlantic. Proceedings of the National Academy of Sciences of the USA, 113(34): E5062-E5071.

[29]
Wang G, Bai W, Li N, et al. 2011. Climate changes and its impact on tundra ecosystem in Qinghai-Tibet Plateau, China. Climatic Change, 106(3): 463-482.

DOI

[30]
You Z, Feng Z, Yang Y. 2020. Evaluation of human settlement environmental suitability in Tibet based on gridded data. Resources Science, 42(2): 394-406. (in Chinese)

[31]
Yu Z, Sun G, Feng Q, et al. 2014. Tourism climate comfort and risk for the Qinghai-Tibet Plateau. Resources Science, 36(11): 2327-2336. (in Chinese)

[32]
Zhong L, Yu H, Zeng Y. 2020. Impact of climate change on Tibet tourism based on tourism climate index. Journal of Geographical Sciences, 29(12): 2085-2100.

DOI

Outlines

/