Analyzing Livelihood

Research on the Patterns and Evolution of Ecosystem Service Consumption in Nepal

  • ZHANG Changshun , 1, 2 ,
  • LIU Chunlan , 3, * ,
  • ZHEN Lin 1, 2
Expand
  • 1. Institute of Geographic Sciences and Natural Resources Research, Chinese Academy of Sciences, Beijing 100101, China
  • 2. School of Resource and Environment, University of Chinese Academy of Sciences, Beijing 100049, China
  • 3. Beijing Municipal Research Institute of Eco-Environmental Protection, Beijing 100037, China
*LIU Chunlan, E-mail:

ZHANG Changshun, E-mail:

Received date: 2021-10-24

  Accepted date: 2022-03-14

  Online published: 2022-07-15

Supported by

The Strategic Priority Research Program of Chinese Academy of Sciences(XDA20010202)

The Science and Technology Major Project of Guangxi(AA20161002-3)

Abstract

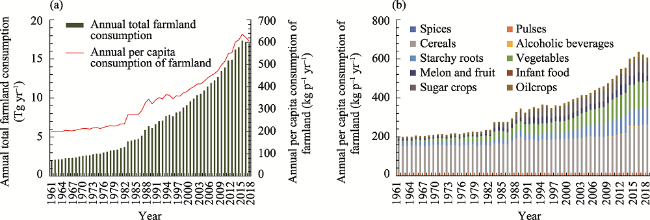
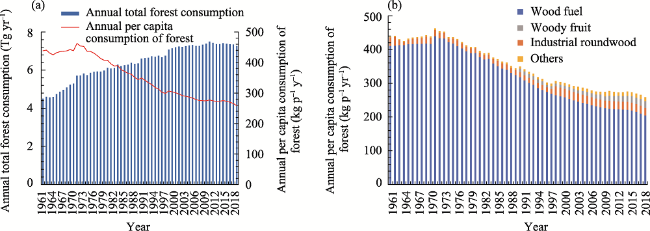
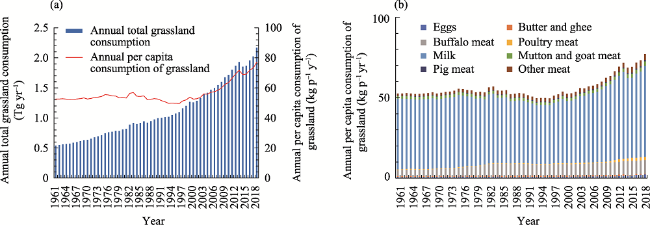
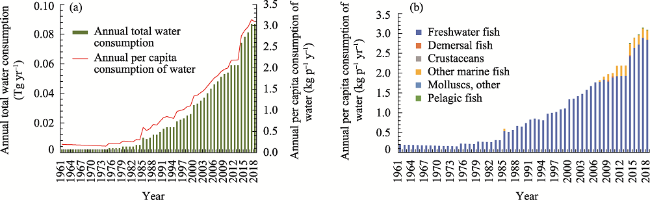
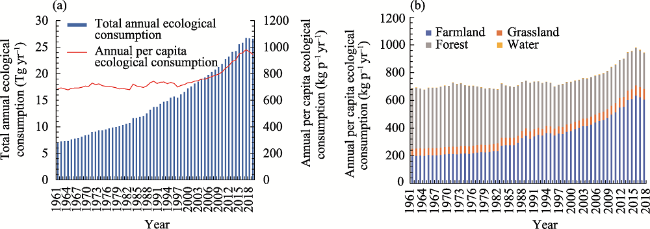
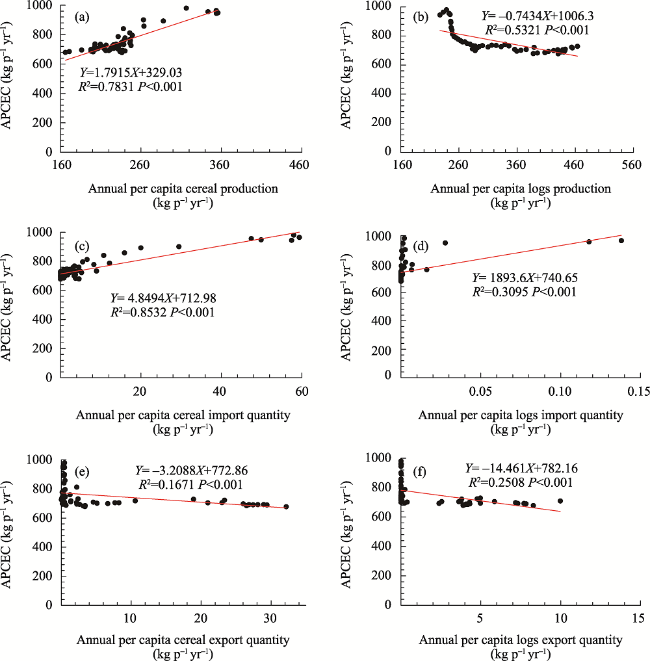
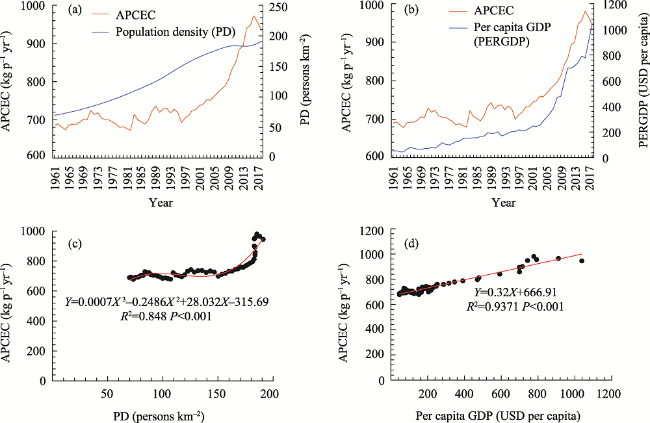
The study of ecosystem service consumption (ESC) in Nepal not only helps us to understand the intensity and management level of Nepal’s ecosystem utilization, but also provides scientific data support for the establishment and planning of China’s aid to Nepal. Based on the data of food consumption and forestry production and trade, this study dynamically investigated the consumption levels, structure and ecological consumption patterns of farmland, forest, grassland, water and the integrated ecosystem in Nepal and their main driving forces, using the physical quantity accounting method. The results showed that the total consumption of farmland, forest, grassland, water and the integrated ecosystem in Nepal from 1961 to 2018 exhibited a fluctuating increase, with average value of 7.26 Tg yr-1, 6.38 Tg yr-1, 1.10 Tg yr-1, 0.02 Tg yr-1 and 14.76 Tg yr-1, respectively. The annual per capita forest consumption roughly decreased, while the annual per capita consumption of farmland, grassland, waters and integrated ecosystems mostly increased with their growth rates accelerating. The corresponding ecological consumption patterns were the “Log-Cereal-Milk” mode during 1961-1984, the “Log-Cereal-Vegetable-Root-Milk-Sugar” mode during 1985-2007 and the “Log-Cereal-Vegetable-Root-Sugar-Fruit-Milk” mode during 2008-2018. This study indicated that the supply capacity of the ecosystem (production, import and export capacity) and socio-economic factors (population density, per capita GDP and religious beliefs) are the main driving forces that are restricting the evolution of Nepal’s ecological consumption pattern. Although Nepal’s dietary structure has improved significantly, there is still a large gap between it and the standard of a balanced diet. The supply capacities of fruits, meat, eggs, milk and aquatic products should be enhanced to meet people’s demand for a balanced diet. This study can provide data support for the establishment of China’s aid projects to improve Nepal’s livelihood.

Cite this article

ZHANG Changshun , LIU Chunlan , ZHEN Lin . Research on the Patterns and Evolution of Ecosystem Service Consumption in Nepal[J]. Journal of Resources and Ecology, 2022 , 13(5) : 870 -879 . DOI: 10.5814/j.issn.1674-764x.2022.05.011

1 Introduction

Ecosystem functions refer to the habitat, biological and ecosystem characteristics and processes of the ecosystems. Ecosystem services refer to various ecological products and services obtained by human beings directly or indirectly from ecosystem functions (Costanza et al., 1997), which are the material basis for the development of human society (Xie et al., 2008). Therefore, the history of human develop ment is really the history of human consumption of ecosystem services. Existing studies show that high-intensity predatory development and utilization has been one of the main factors leading to the degradation of regional ecosystems (Millennium Ecosystem Assessment, 2005), which makes the contradiction between maintaining the supply capacity of regional ecological services and increasing demand for ecological services become increasingly prominent (Vitousek et al., 1997). As a result, the human ecological footprint has already exceeded the ecological carrying capacity of the Earth (World Wildlife Fund, 2004). Although regional ecosystem services have been reused by human beings, the concept of ecosystem services was proposed only at the end of the last century, and the concept of ecosystem service consumption was put forward even later. However, with the development of China’s ecological civilization construction, the research on the value realization mechanism of ecological services has become a hotspot of regional governments (Zhang and Zhou, 2021), and ecosystem service consumption is becoming a new field of ecological research (Zhen et al., 2012).
Different groups have different understandings regarding the connotation of ecological service consumption. Chinese scholars Zhen et al. (2008) considered that ecological service consumption refers to the consumption, utilization and occupation of products and services provided by the ecosystem by human society, and it is the embodiment of the value of ecosystem services, which can be measured by material quality or value quantity indicators. Therefore, the consumption pattern of ecosystem services refers to the consumption characteristics such as the content, level, structure and trend of ecosystem service consumption in a certain region and in a certain period of time (Zhen et al., 2010a). Subsequently, Professor Zhen Lin’s team conducted a large number of practical studies on ecological service consumption in Inner Mongolia, Mongolia, Laos, Kazakhstan and other regions or countries (Zhen et al., 2010b; Zhen et al., 2012; Liang et al., 2019; Liang et al., 2020). The consumption pattern of ecosystem services in this study refers to the level and structure of direct consumption of ecological products such as food, energy and materials in Nepal during 1961-2018, and it excludes the consumption of reproduction, such as seed retention and feed materials, as well as the consumption of processing and utilization, waste and tourism.
In recent years, China has put forward a proposal to build a “China-Nepal-India” economic corridor, advocating that these three countries should build a three-dimensional interconnection network that spans the Himalayas to achieve common development and common prosperity. Nepal also hopes to become a bridge between China and India in order to deepen cooperation and promote regional cooperation. China has become Nepal’s second largest trading partner. Nepal has a special geographical location in the “Belt and Road”, and China provides various aids to Nepal’s livelihoods such as transportation, industry, medical care, education, but there is a lack of research on Nepal’s ecological consumption. Probing the level, structure, consumption pattern and evolution law of Nepal’s ecological consumption can provide scientific data support for the establishment of China’s assistance projects to improve people’s livelihood in Nepal.

2 Overview of Nepal and the research method

2.1 Overview of Nepal

Located in the northern part of the South Asian subcontinent, Nepal is a mysterious kingdom of snow-capped mountains and a country of famous temples. The land area is about 1.5×10⁵ km2 with a population of more than 26.6 million, and the capital is Kathmandu. Nepal is bordered by China’s Tibet region to the north and India to the east, west and south. The geographical environment of Nepal is complex, and the landforms of the whole territory are often divided into the northern high mountain area, the central hills and valley area, and the southern plain area. The complex landforms have created a diverse climate. The country can be divided into three climate zones: the northern high mountain zone, the central temperate zone and the southern subtropical zone. Nepal has distinct wet and dry seasons. The rainy season is from April to September each year, when the climate is muggy, with a lot of rain from June to August. The dry season is from October to March of the following year, when rainfall is scarce and the climate is dry (Wang, 2017). More than 90% of the population in Nepal depends on land resources for food and fuel. Its ecosystem is dominated by forests and farmland, of which the total forest area is about 5.8943 million ha, accounting for 39.94% of the country's land area, the total cultivated area is about 3.521 million ha, accounting for 23.86% of the total land area, and the grassland area is about 2.0638 million ha, accounting for 14.01% of the country’s land area (Deng, 2016).

2.2 Research method

In this study, the physical quantity was used for accounting. According to the data of food consumption in the food balance sheet for Nepal in FAO, the various types of food productive land use were first divided into four ecosystems: forest, farmland, grassland and water. Then these four ecosystems were further classified according to food types, of which farmland included corn, beans, vegetables, roots, fruit, seasoning, sugar, sugar crops, oil crops and vegetable oils; the grassland ecosystem included water beef, lamb, pork and other meat, poultry, eggs, butter, and milk; the water system included freshwater fish, ground fish, deep-sea fish, crustaceans, other fish, and other mollusks; and the forest ecosystem included woody fruit, woody oil, woody vegetable oil, tea and nuts. For other forest products, FAO data on forestry production and trade in Nepal were used to calculate the consumption of industrial logs, fuelwood, charcoal fiber, saw wood, fiber, paper and paperboard by using equation (1).
${{C}_{i}}={{Y}_{i}}+{{I}_{i}}-{{E}_{i}}$
where Ci is the total consumption of i product, Tg yr-1; Yi is the total productivity of i product, Tg yr-1; Ii is the total import quantity of i product, Tg yr-1; and Ei is the total export quantity of i product, Tg yr-1.
Then, before conducting the ecological consumption research on farmland, forest, grassland and water areas, the values for sugar, vegetable oil, and woody vegetable oil were converted into consumption of sugar crops, oil crops, and woody oil crops at an oil yield of 0.35, and the forest ecosystem consumption was classified into four categories: fuelwood, industrial logs, woody fruits, and others. The annual per capita ecological consumption (APCEC) was acquired as follows:
$APCE{{C}_{i}}=1.0\times {{10}^{9}}\times T{{C}_{i}}/N$
where APCECi is the annual per capita ecological consumption of i product, kg p-1 yr-1; TCi is the total ecological consumption of i product, Tg yr-1; N is the total population, person; and 1.0×10⁹ is the conversion coefficient.
Ecological consumption patterns are mainly divided according to the composition of annual per capita ecological consumption. Firstly, the ecological consumption patterns were divided into three categories: ≥75%, 55%-75% and ≤55%, according to the sum of log and cereal consumption ratios. Then, the ecological consumption patterns were named based on the type composition with the average proportion of ≥5% during the period.
Since cereals and fuelwood are the main sources of ecological consumption in Nepal, the driving force analysis mainly focused on the interrelationship between the annual per capita ecological consumption and the annual production, imports and exports of cereals and logs (industrial logs + fuelwood), population density and per capita GDP. All of the analysis and graphing steps were completed in Excel.

2.3 Data sources

Nepal’s Food Balance sheet was based on data from the Food Balance in FAOSTAT of FAO. Forestry production and trade were obtained from Forestry Production and Trade data in FAOSTAT of FAO (http://www.fao.org/faostat/en/#data/FO). Nepal’s population and per capita GDP data were from Kuaiyi Data (https://www.kylc.com/stats) in the Kuaiyi Finance Network.
Table 1 The sources of data for ecological consumption research in Nepal
Data name Data type Data source
Food balance Excel http://www.fao.org/faostat/en/#data
Forestry production and trade Excel http://www.fao.org/faostat/en/#data/FO
Population and per capita GDP Excel https://www.kylc.com/stats

3 Results

3.1 Consumption of ecosystem services

3.1.1 Variations in the consumption of farmland ecosystem services

During 1961-2018, the annual consumption of farmland in Nepal and the annual consumption per capita were 7.26 Tg yr-1 and 340.40 kg p-1 yr-1 (kg per person per year), respectively, with each showing a fluctuating trend of increase. Net increases of 7.3-fold and 2.1-fold occurred, respectively, from 2.04 Tg yr-1 and 198.70 kg p-1 yr-1 in 1961 to 17.03 Tg yr-1 and 606.14 kg p-1 yr-1 in 2018 (Fig. 1a). The annual farmland consumption per capita in Nepal showed three different periodic trends. There was a slow increase from 1961 to 1982, with an average annual growth rate of about 1.71 kg p-1 yr-1. From 1982 to 2008, there was a fluctuating increasing trend, and the annual farmland consumption per capita increased from 234.53 kg p-1 yr-1 to 459.37 kg p-1 yr-1 in the 26 years, with an average annual net increase of 8.65 kg p-1 yr-1. From 2008 to 2018, the annual farmland consumption per capita showed rapid growth, with an average net annual growth rate of 14.68 kg p-1 yr-1 (Fig. 1b).
Fig. 1 Variations in Nepal’s consumption of farmland ecosystem services during 1961-2018
The consumption of farmland in Nepal was dominated by cereal consumption. The average annual cereal consumption per capita was 171.37 kg p-1 yr-1, accounting for about 50.34% of the farmland consumption per capita. However, the proportion of cereal consumption fluctuated and decreased, from 72.99% in 1961 to 39.77% in 2018. Although the average proportions in the annual farmland consumption per capita for vegetables, roots and sugars were 16.18%, 12.12% and 9.08% respectively, which were lower than that of cereal, their proportions were increasing significantly (Fig. 1b).

3.1.2 Variations in the consumption of forest ecosystem services

During 1961-2018, the annual forest consumption of Nepal increased continuously, but the annual forest consumption per capita decreased with averages of 6.38 Tg yr-1 and 353.72 kg p-1 yr-1, respectively. The annual forest consumption increased from 4.50 Tg yr-1 in 1961 to 7.26 Tg yr-1 in 2018 for an annual net increase of 0.05 Tg yr-1, and the annual consumption per capita decreased from 438.39 kg p-1 yr-1 in 1961 to 258.51 kg p-1 yr-1 in 2018 for an average annual reduction of 3.16 kg p-1 yr-1 (Fig. 2a).
Fig. 2 Variations in Nepal’s consumption of forest ecosystem services during 1961-2018
The rate of change in the annual forest consumption per capita in Nepal varied among three different periods. From 1961 to 1975, the annual forest consumption per capita fluctuated and declined slowly, with a net annual change of -0.14 kg p-1 yr-1. From 1975 to 1997, the annual forest consumption per capita showed a rapid decline, at a rate of -5.98 kg p-1 yr-1. From 1998 to 2018, the annual forest consumption per capita of Nepal decreased slowly at an average rate of -2.42 kg p-1 yr-1, and the annual forest consumption increased slowly but tended to be stable. Forest consumption in Nepal was dominated by fuelwood con sumption, accounting for 91.11% of the total forest consumption on average (Fig. 2b).

3.1.3 Variations in the consumption of grassland ecosystem services

During 1961-2018, the annual grassland consumption in Nepal showed a fluctuating growth trend with an increasing rate, but the annual grassland consumption per capita showed slow growth at first, which then fluctuated downward, and finally increased with averages of 1.10 Tg yr-1 and 56.29 kg p-1 yr-1, respectively. Quantitatively, the annual grassland consumption increased from 0.54 Tg yr-1 in 1961 to 2.17 Tg yr-1 in 2018 for an annual net increase of 0.03 Tg yr-1, and grassland consumption per capita increased from 52.59 kg p-1 yr-1 in 1961 to 77.15 kg p-1 yr-1 in 2018, for an average annual increase of 0.43 kg p-1 yr-1 (Fig. 3a). The rate of change in the annual grassland consumption per capita in Nepal showed three different periods. There was a slow increase from 1961 to 1975 when the annual grassland consumption per capita increased slowly at an average rate of 0.21 kg p-1 yr-1. From 1975 to 1996, the annual grassland consumption per capita fluctuated and declined at an average rate of -0.28 kg p-1 yr-1. From 1996 to 2018, Nepal’s annual grassland consumption per capita fluctuated and increased at an average rate of 1.25 kg p-1 yr-1, and during this period, the growth rate of grassland consumption accelerated (Fig. 3b). The consumption of grassland in Nepal was dominated by milk consumption, accounting for about 76.53% of the total, but its proportion fluctuated and decreased from 83.70% in 1961 to 73.32% in 2018. Buffalo, lamb and egg consumption followed milk, accounting for 11.51%, 3.16%, and 1.81% of the grassland consumption on average, and their proportions in the annual grassland consumption per capita were slowly increasing.
Fig. 3 Variations in Nepal’s consumption of grassland ecosystem services during 1961-2018

3.1.4 Variations in the consumption of water ecosystem services

During 1961-2018, Nepal’s total annual water consumption and annual water consumption per capita both fluctuated and increased, with average values of 0.02 Tg yr-1 and 0.98 kg p-1 yr-1, respectively. The annual water consumption increased from 0.002 Tg yr-1 in 1961 to 0.09 Tg yr-1 in 2018, for an annual net increase of 15000 t yr-1, while the annual consumption per capita increased from 0.19 kg p-1 yr-1 in 2016 to 3.09 kg p-1 yr-1 in 2018, for an average net increase of 0.05 kg p-1 yr-1 (Fig. 4a). The annual water consumption per capita in Nepal showed four different periods of change. The rate of change in the annual water consumption per capita was -0.003 kg p-1 yr-1 from 1961 to 1974. From 1974 to 1984, water consumption per capita increased slowly, with an annual average growth rate of 0.01 kg p-1 yr-1. From 1994 to 2011, the annual growth rate of water consumption per capita in Nepal accelerated to 0.07 kg p-1 yr-1, and the growth rate continued to increase thereafter, with an average of 0.11 kg p-1 yr-1 during 2011-2018 (Fig. 4b). Water consumption in Nepal was dominated by freshwater fish consumption. The average annual freshwater fish consumption per capita was 0.94 kg p-1 yr-1, accounting for 95.43%, and its proportion remained stable for a long time before 2010. After 2010, the consumption of other marine fish and mollusks fluctuated and increased, while the consumption of freshwater fish fluctuated and decreased but remained dominant, accounting for about 90.06% of the water consumption on average (Fig. 4b).
Fig. 4 Variations in Nepal’s consumption of water ecosystem services during 1961-2018

3.1.5 Variations in the consumption of total ecosystem services

During 1961-2018, Nepal’s total ecological consumption fluctuated and increased, from 7.08 Tg yr-1 in 1961 to 26.54 Tg yr-1 in 2018, for a net increase of 19.46 Tg yr-1 or 2.75-fold. The ecological consumption per capita fluctuated and increased as well during 1961-2018. From 1961 to 1996, Nepal’s annual ecological consumption per capita increased slowly, with an annual average of 706.81 kg p-1 yr-1 and an average annual growth rate of 0.27 kg p-1 yr-1. From 1996 to 2018, the ecological consumption per capita in Nepal increased significantly, from 699.48 kg p-1 yr-1 in 1996 to 944.90 kg p-1 yr-1 in 2018, for a net increase of 245.42 kg p-1 yr-1 or 0.35-fold (Fig. 5).
Fig. 5 Variations in Nepal’s consumption of ecosystem services during 1961-2018

3.2 Consumption patterns of ecosystem services in Nepal

According to Nepal’s annual ecological consumption per capita and its compositional differences, the ecological consumption of Nepal from 1961 to 2018 can be divided into three periods and the main features of each mode are shown in Table 2 and Fig. 6. 1) From 1961 to 1984, the ecological consumption mode was that of “Log-Cereal- Milk”. During this period, ecological consumption was dominated by log consumption, but its proportion slowly decreased with an average value of 60.45%, followed by cereal consumption whose proportion fluctuated slowly, with an average value of 21.16%. The third component was milk consumption, for which the proportion decreased slowly with an average value of 6.18%, and the average consumption levels of other products were each less than 5.00%. 2) From 1985 to 2007, the ecological consumption mode was that of “Log-Cereal-Vegetable-Root-Milk-Sugar”. During this period, the annual ecological consumption per capita was still the highest for log consumption, but its proportion decreased significantly, with an average of 41.23%, while cereal consumption increased slowly, with an average of 23.94%. The consumption of vegetables, roots and sugars increased significantly, while the consumption of milk was slowly decreasing, and the consumption of these four types of products accounted for 7.71%, 5.37%, 5.36% and 5.33% of the annual ecological consumption per capita, respectively. 3) From 2008 to 2018, the ecological consumption mode can be expressed as “Log-Cereal-Vegetable-Root-Sugar- Fruit-Milk”. During this period, the annual per capita log consumption tended to be stable, while the consumption of cereals, vegetables, roots, milk, sugar and fruits continued to increase. Cereal consumption grew slowly, resulting in a slow increase in the proportion of cereal consumption in the ecological consumption per capita, with an average value of 23.60%. Vegetables, roots, fruits and sugars accounted for higher proportions of the annual ecological consumption per capita than milk (5.64%), with averages of 13.12%, 9.20%, 6.44% and 6.38%, respectively.
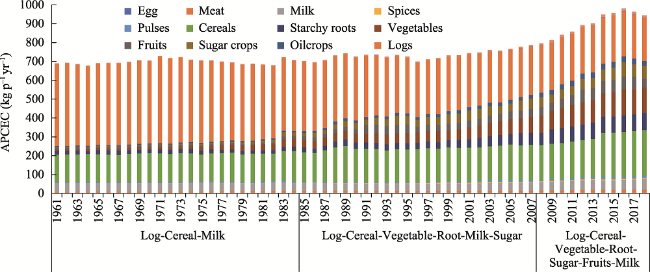
Table 2 Evolution of the ecological consumption patterns in Nepal
Consumption pattern Period APCEC (kg p-1 yr-1) Major features
Average Change rate
Log-Cereal-Milk 1961-1984 699.18 0.75 Log and milk consumption decreased slowly, and cereal consumption increased slowly
Log-Cereal-Vegetable- Root-Milk-Sugar 1985-2007 734.95 3.88 Cereal consumption increased rapidly, and vegetation, root and sugar consumption increased slowly, while log consumption decreased rapidly and milk consumption decreased slowly
Log-Cereal-Vegetable- Root-Sugar-Fruits- Milk 2008-2018 899.64 14.88 Vegetable, fruit, root and sugar consumption accelerated, and cereal and milk consumption increased slowly, while log consumption decreased rapidly

Note: APCEC, Annual per capita ecological consumption.

Fig. 6 Evolution of Nepal’s ecological consumption patterns
Table 3 Daily food intake in Nepal (Unit: g p-1 d-1)
Indexes Cereals and potatoes/roots Vegetables Fruits Meat Eggs Fish Milk
1961 449.1 21.6 21.6 21.3 2.1 0.5 120.6
2018 905.9 371.5 128.1 49.8 6.5 8.5 155.0
Average 578.3 145.1 77.3 33.3 2.8 2.7 118.1
Recommended food intake in China 250-400 300-500 200-350 40-75 40-50 40-75 300

3.3 Driving forces of ecological consumption

3.3.1 Supply capacity of ecosystem services

The results of correlation analysis showed that Nepal’s annual ecological consumption per capita had a very significant positive relationship with annual cereal production per capita (Y = 1.7915X + 329.03, R² = 0.7831, P<0.001), a very significant negative correlation with annual log production per capita (Y = -0.7434X + 1006.3, R² = 0.5321, P<0.001), and a very significant positive correlation with the annual cereal and log import volume with correlation coefficient R2 values of 0.8532 and 0.3095, respectively. The ecological consumption per capita had very significant negative correlations with the annual cereal and log export volumes, with correlation coefficient R2 values of 0.1671 and 0.2508, respectively (Fig. 7). These results indicate that the supply capacity of the regional ecosystem significantly affected the level and structure of Nepal’s ecological consumption, which in turn affected the evolution of Nepal’s ecological consumption pattern.
Fig. 7 Relationships between APCEC and supply factors of cereals and logs

3.3.2 Socioeconomic factors

From 1961 to 2018, the trend of Nepal’s annual ecological consumption per capita was basically consistent with that of GDP per capita, but slightly different from that of population density. With the growth of population density, the trend of annual ecological consumption per capita increased at first and then decreased and increased again (Fig. 8). The result of the regression analysis showed that there was a very significant cubic correlation between Nepal’s annual ecological consumption per capita and population density (Y = 0.0007X3-0.2486X2 + 28.032X-315.69, R² = 0.8480, P < 0.001). There was a very significant positive correlation between Nepal’s annual ecological consumption per capita and GDP per capita (Y = 0.32X + 666.91, R² = 0.93717, P < 0.001). In addition, Nepal is a country that believes in Hinduism. Since the Hindu do not eat yellow beef, the beef in Nepal should be buffalo. All of these considerations indicated that socio-economic factors had a significant impact on Nepal’s ecological consumption pattern.
Fig. 8 Relationships between APCEC and socioeconomic factors

4 Discussion

Because of the increase in agricultural investment and China’s chemical fertilizers, the supply capacity of Nepal’s ecosystem has been greatly improved (Meng, 2013), resulting in an increase in the annual ecological consumption per capita. The daily consumption per capita of cereals and potatoes increased from 449.1 g p-1d-1 (grams per person per day) in 1961 to 905.9 g p-1d-1 in 2018, while the daily consumption per capita of vegetables, fruits, meat, eggs, aquatic products, and milk increased from 21.6, 21.6, 21.3, 2.1, 0.5 and 120.6 g p-1 d-1 in 1961 to 371.5, 128.1, 49.8, 6.5, 8.5 and 155.0 g p-1 d-1 in 2018, respectively. However, compared with the food intake recommended by the Chinese Diet Pagoda (Chinese Nutrition Society, 2021) in 2018, only the daily intake of cereals and potatoes, vegetables and meat met the standard, and the other categories such as fruits, eggs, aquatic products and dairy products were not up to their recommended standards. In 1961, only the daily intake of corn and potatoes reached the standard, and the daily intake levels of the remaining foods were far below the standards. In the future, Nepal needs to continue to increase support for agriculture, forestry, animal husbandry and fishery, vigorously develop animal husbandry and fishery production, and appropriately increase the imports of livestock products and aquatic products to improve the supply capacity of ecosystem services and to meet the residents’ needs for a balanced diet.
In addition, fuelwood consumption accounted for a large proportion of Nepal’s forestry consumption, especially log consumption. Studies showed that Nepal’s carbon footprint in 2015 was about 40% of the world average (World Wildlife Fund, 2015), so since it has a relatively high forest coverage rate, this indicates that Nepal is now in a relatively sufficient ecological surplus. However, Nepal should adjust its energy structure, vigorously develop rural biogas, increase the proportion of renewable energy such as solar and hydropower, reduce fuelwood consumption, enhance the carbon sink capacity of the ecosystem, and achieve national carbon peaking and carbon neutrality.
Regarding the driving forces of ecological consumption, many studies have shown that the social economy and ecosystem supply capacity largely determine the regional ecological consumption pattern (Zhen et al., 2012; Wu, 2013; Liang et al., 2019; Liang et al., 2020). The analysis of the driving forces of Nepal’s ecological consumption patterns showed that the supply capacity of Nepal’s ecosystem has depended to a large extent on the production capacity of its ecosystem, especially the production capacity of major products such as cereals, fuelwood, dairy products, root tubers, vegetables, sugar and fruits. A regression analysis showed that Nepal’s annual per capita ecological consumption was extremely significantly correlated with annual cereal and log production per capita. In addition, as the economy improves, the import and export capacities of Nepal’s ecosystem have been increasing, and the increase in import capacity will continue to increase the supply capacity of the regional ecosystem, while the increase in export capacity will weaken the supply capacity of the regional ecosystem. This study found that Nepal’s annual ecological consumption per capita was extremely significantly positively correlated with the per capita annual cereal productions and inports, andlog imports, but extremely significantly negatively correlated with their exports, which indicated that the ecosystem’s supply capacity restricted the evolution of Nepal’s ecological consumption pattern. Similarly, the regression analysis also showed that there weresignificantly negative correlations between annual ecological consumption per capita and regional population density as well as GDP per capita, indicating that socio-economic factors had a significant impact on the evolution of Nepal’s ecological consumption pattern.

5 Conclusions

Based on the data of food consumption and forestry production and trade from the food balance sheet in the FAOSTAT database, this study examined the consumption levels, structure and ecological consumption patterns of cropland, forest, grassland, water and the integrated ecosystem in Nepal using the physical quantity accounting method, to reveal the main driving forces in the evolution of its ecological consumption pattern. This analysis leads to four main conclusions.
(1) During 1961-2018, the total consumption levels of farmland, forest, grassland, water area and the integrated ecosystem in Nepal all showed fluctuating increases, with annual averages of 7.26, 6.38, 1.10, 0.02 and 14.76 Tg yr-1, respectively. In addition to the fluctuating decrease in annual forest consumption per capita, the annual consumption per capita of farmland, grassland, water and the integrated ecosystems all fluctuated and increased, and their growth rates were increasing.
(2) In terms of ecosystem types, Nepal’s ecological consumption was dominated by farmland and forest ecosystems from 1961 to 2018. The annual farmland and forest consumption accounted for approximately 47.08% and 45.30% of the average ecological consumption, respectively. In terms of ecosystem types, the ecological consumption levels of farmland, forest, grassland and water areas were dominated by cereal, fuelwood, milk and freshwater fish, accounting for 52.33%, 91.11%, 76.58% and 95.43% of the corresponding per capita consumption, respectively.
(3) According to the composition of ecological consumption, Nepal’s ecological consumption was divided into three periods: 1961-1984, 1985-2007, and 2008-2018. The corresponding consumption patterns were the “Log-Cereal- Milk” mode, the “Log-Cereal-Vegetable-Root- Milk-Sugar” mode and the “Log-Cereal-Vegetable-Root-Sugar-Fruit- Milk” mode.
(4) The annual ecological consumption per capita was extremely significantly correlated with the annual production per capita, import and export volumes of log and cereal, the population density and GDP per capita, indicating that the supply capacity of the ecosystem and the socio-economic level were the main driving forces that restricted the evolution of the ecological consumption pattern in Nepal.
In the past 57 years, although Nepal’s food consumption level and dietary structure have significantly improved, there is still a large gap in meeting the balanced diet standard. The supply capacities of fruit, meat, eggs, milk and aquatic products should be improved to meet people’s demand for a balanced diet. The results of this study can provide data support for the formulation of China’s assistance projects to improve people’s livelihood in Nepal.
[1]
Chinese Nutrition Society. 2021. Scientific research report of dietary guidelines for Chinese residents. https://www.cnsoc.org/bookpublica/422120200.htmlin Chinese)

[2]
Costanza R, d’Arge R, Groot R d, et al. 1997. The value of the world’s ecosystem services and natural capital. Nature, 387(15): 253-260.

DOI

[3]
Deng W. 2016. South Asia geography-natural resources & environment. Chengdu, China: Sichuan Science and Technology Press. (in Chinese)

[4]
Liang Y H, Zhen L, Hu Y F, et al. 2020. Analysis of the food consumption mode and its influencing factors in Kazakhstan. Journal of Resources and Ecology, 11(1): 121-127.

DOI

[5]
Liang Y H, Zhen L, Jia M M, et al. 2019. Consumption of ecosystem services in Laos. Journal of Resources and Ecology, 10(6): 641-648.

DOI

[6]
Meng S. 2013. Agriculture in Nepal: Most advanced, most backward. Chinas Three Gorges, (10): 73-75. (in Chinese)

[7]
Millennium Ecosystem Assessment. 2005. Ecosystems and human well-being:Synthesis. Washington DC, USA: Island Press.

[8]
Vitousek P M, Mooney H A, Lubchenco J, et al. 1997. Human domination of earth’s ecosystems. Science, 277(5325): 494-499.

DOI

[9]
Wang Y. 2017. Religious buildings in Nepal. Nanjing, China: Southeast University Press. (in Chinese)

[10]
World Wildlife Fund. 2004. Living planet report 2004. Gland, Switzerland: WWF.

[11]
World Wildlife Fund. 2015. Living planet report—China 2015. https://webadmin.wwfchina.org/storage/content/press/publication/2015/Living%20Planet%20Report%20China%202015%20FIN.pdf

[12]
Wu R. 2013. Consumption of provisioning services and the influencing factors: A case study in Inner Mongolia grassland transect. Diss., Beijing, China: The University of Chinese Academy of Sciences.

[13]
Xie G D, Zhen L, Lu C X, et al. 2008. Supply, consumption and valuation of ecosystem services in China. Resources Science, 30(1): 93-99. (in Chinese)

[14]
Zhang L, Zhou Y. 2021. The path exploration of establishing and perfecting the value realization mechanism of ecological products. Acta Ecologica Sinica, 41(19): 7893-7899.. (in Chinese)

[15]
Zhen L, Liu X L, Li F, et al. 2010a. Consumption of ecosystem services and eco-compensation mechanism in ecological sensitive regions: Progress and challenges. Resources Science, 32(5): 797-803. (in Chinese)

[16]
Zhen L, Liu X L, Wei Y J. 2008. Consumption of ecosystem services: Models, measurement and management framework. Resources Science, 30(1): 100-106. (in Chinese)

[17]
Zhen L, Ochirbat B, Lv Y, et al. 2010b. Comparing patterns of ecosystem service consumption and perceptions of range management between ethnic herders in Inner Mongolia and Mongolia. Environmental Research Letters, 5(1): 15001-15011.

DOI

[18]
Zhen L, Yan H M, Hu Y F, et al. 2012. Consumption of ecosystem goods and services and its impact assessment. Resources Science, 34(6): 989-997. (in Chinese)

Outlines

/