Analyzing Livelihood

Estimation of the Tibetan Wild Ass Population in Gaize County of Chang Tang Plateau based on the Belt Transect Method and Random Forest Model

  • QIAO Tian , 1, 2 ,
  • XU Zengrang , 1, * ,
  • WEI Ziqian 3
Expand
  • 1. Institute of Geographic Sciences and Natural Resources Research, Chinese Academy of Sciences, Beijing 100101, China
  • 2. University of Chinese Academy of Sciences, Beijing 100049, China
  • 3. China Academy of Building Research, Beijing 100013, China
*XU Zengrang, E-mail:

QIAO Tian, E-mail:

Received date: 2021-11-01

  Accepted date: 2022-04-05

  Online published: 2022-07-15

Supported by

The Second Tibetan Plateau Scientific Expedition and Research Program, China(2019QZKK0603)

The National Natural Science Foundation of China(41971263)

The Joint Project between the National Natural Science Foundation of China and the Mongolian Foundation of Science and Technology(32161143025)

Abstract

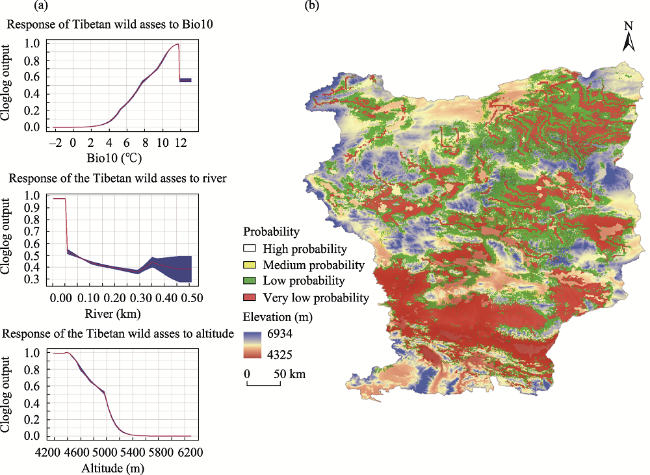
As a typical representative of the herbivorous wild animals in Chang Tang Plateau, the number of Tibetan wild asses has increased significantly in recent years. Clarifying the distribution, population, and size of its habitats is conducive to formulating the protection plan for wild animals and managing the conflict between people and wild animals in Chang Tang Plateau. Based on the distribution probability of Tibetan wild ass habitats and environmental factors, the number of Tibetan wild asses in Gaize County of Chang Tang Plateau was calculated by using the belt transect method and random forest model, and due to the uncertainty of the calculations, the results were corrected and analyzed. The results show that the living environment of Tibetan wild asses in Gaize County of Chang Tang Plateau is at 4400-4600 m above sea level, 350-400 m away from the river, and the average temperature in the warmest season is 10-12 ℃. The vegetation types of habitats are generally temperate tufted dwarf grass, dwarf semi shrub desert grassland, alpine grass, Carex grassland, alpine cushion dwarf semi shrub desert, among others. On the basis of studying the environmental preferences of Tibetan wild asses, the random forest model was corrected by using the data of the second scientific survey sample line of Qinghai-Tibet Plateau for three years. The approximate number of Tibetan wild asses in each of the different areas of Gaize County was obtained. The number of Tibetan wild asses in Gaize Town, Xianqian Township, Gumu Township, Chabu Township, Mami Township, Wuma Township and Dongcuo Township is 855, 3458, 2358, 1453, 743, 943 and 647, respectively. By studying the environmental preferences of Tibetan wild asses and analyzing the results of the belt transect survey, the random forest model can accurately estimate the number of Tibetan wild asses in Gaize County of Chang Tang Plateau.

Cite this article

QIAO Tian , XU Zengrang , WEI Ziqian . Estimation of the Tibetan Wild Ass Population in Gaize County of Chang Tang Plateau based on the Belt Transect Method and Random Forest Model[J]. Journal of Resources and Ecology, 2022 , 13(5) : 860 -869 . DOI: 10.5814/j.issn.1674-764x.2022.05.010

1 Introduction

Tibetan wild ass (Equus kiang) is a national first-class protected animal in China, and it is the largest of all wild asses. It looks like a mule, but it is larger. The local people often call it “wild horse” (Xu et al., 2020). It is native to Qinghai-Tibet Plateau and its surrounding areas, and is currently distributed in Western China, Nepal, Pakistan and northern India. Tibetan wild ass is the largest of all wild asses (Wang et al., 2021b). Its shape is similar to that of the Mongolian wild ass, with a body length of more than 2 m, a head and body length of 182-214 cm, tail length of 32-45 cm, shoulder height of 132-142 cm, and weight of 250-400 kg. Tibetan wild ass lives in groups (Shang et al., 2021), mostly composed of 5 or 6 small groups. However, the number of large groups is more than 10, and the largest group can reach hundreds of individuals. The small groups are led by a male ass. Tibetan wild ass walks in a continuous fashion, and only rarely in a disordered path. Within the group, the male takes the lead, the young asses are in the middle, and the females are in the end. Most of the roads traveled by Tibetan wild asses are transformed into an obvious “ass path”. There are a lot of feces in the places where it passes, so it is easy to identify their activity routes (Wu et al., 2020) which is helpful for carrying out sample line surveys (Zhang et al., 2020).
The whole terrain of Chang Tang Plateau is high in the northwest, low in the southeast, and mainly composed of low mountains, gentle hills and wide valleys in the lake basin. The average altitude is 4500 m, and the relative heights of peaks are generally between 200 and 500 m. This region has the highest altitude and the most typical plateau shape in Qinghai-Tibet Plateau. Although there are many lakes (Guo et al., 2021) in Chang Tang Plateau, the plateau climate is cold and dry, and the annual and daily temperature changes are great. The average temperature of the warmest month is 6-10 ℃ (Zhao et al., 2020), the average temperature of the coldest month is below -10 ℃, and the average annual precipitation is about 100-300 mm, decreasing from southeast to northwest. There are frequent strong winds in winter and spring. Gaize County has sufficient lighting conditions, with 2800 to 3400 hours of sunshine throughout the year, far exceeding the other regions at the same latitude (Zhu et al., 2019a). There are many plant species on Chang Tang Plateau, with more than 400 kinds of higher plants. Due to the high altitude and bad climatic conditions, the vegetation there is extremely fragile. Therefore, studies on the environmental preferences of Tibetan wild asses are of great significance to the habitat prediction and quantitative evaluation of Tibetan wild asses (Lu et al., 2015; Wu et al., 2019).
Many models are currently being used to estimate the scale of wildlife populations. Due to the particular characteristics of Chang Tang Plateau and Tibetan wild ass we must first study the preferences of Tibetan wild ass’s living environment, and divide the appropriate range of habitats according to those preferences before we can estimate the number of Tibetan wild asses in the next step. Carrying out a transect survey in suitable habitats of Tibetan wild asses to obtain observation point data is the basis of the operation model. The random forest (Liu et al., 2015; Zhang et al., 2021) can accurately establish the quantitative relationship between the environmental factors of the places Tibetan wild asses tend to occur and the size of the Tibetan wild ass population. According to the corrected transect survey data (Xiong and Xiong, 2004; Liu et al., 2020; Zhang et al., 2020), the random forest model can accurately predict the number of Tibetan wild asses in the study area.

2 Data and methods

2.1 Overview of the study area

The core area of Chang Tang Plateau is located in Naqu region on the north wing of the driest middle section of Karakoram Mountain, Akseqin area, which extends eastward to Heishi North Lake, Yanghu Lake, Baigobi and Ngokule on the south wing of the middle Kunlun Mountain and its arid area to the East. The average altitude is 4700-5200 m. The climate is complex and variable, but cold and dry as a whole. The average temperature of the warmest month is 3-6 ℃, the average temperature of the coldest month is lower than -20 ℃, and the annual average temperature is about -7- 11 ℃ (Lin et al., 1990; Du et al., 2020). There are many rivers and lakes in the region, and the vegetation is extremely sparse. The average vegetation coverage is only 1%-5%. The soil is basically Alpine desert soil (Zheng et al., 1990). Gaize County (Fig. 1) belongs to the hinterland of Chang Tang Plateau, bordering Nima County of Naqu region in the East, Cuoqin County and Zhongba County of Shigatse region in the south, Geji County and Ritu County in the west, and Yutian County of Xinjiang Uygur Autonomous Region across Kunlun Mountain in the North (Lou et al., 2021). Gaize County governs one town (Gaize Town) and six townships (Wuma Township, Xianqian Township, Mami Township, Dongcuo Township, Gumu Township, and Chabu Township). There is a resident committee and 47 administrative villages, and the government is stationed in Gaize Town. The total land area is 1.35×10⁵ km2, accounting for 31.6% of the total land area in Ali area, with an average altitude of more than 4700 m (Zhu et al., 2019b).
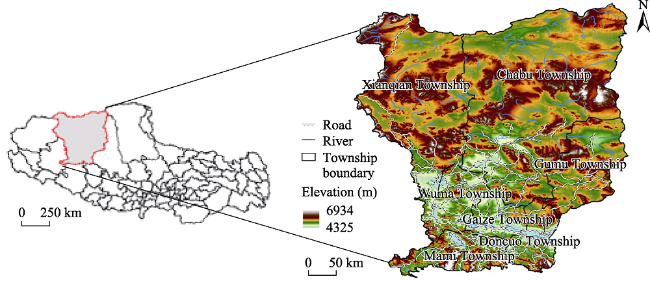
Fig. 1 Location of study area

2.2 Data sources and processing

2.2.1 Belt transect method

According to the living habits of Tibetan wild asses, combined with the terrain, vegetation and altitude of Chang Tang nature reserve, we conducted a sample line survey and collected the point data of Tibetan wild asses on Chang Tang Plateau from 2019 to 2021. The species, number and point locations of wild animals were observed and recorded. In the evening or later, the two groups of surveyors discussed and checked each other’s wildlife record points, and the number given for the wildlife populations at each point is the average of the values from the two groups.
When dealing with the distances between wildlife points and observation points, for the convenience of the calculations, the actual shoulder height of Tibetan wild asses is uniformly specified as 132 cm. The distance (d) between observation points and the wildlife points is calculated through the focal length, magnification and observation shoulder height of the telescope. When converting the longitude and latitude of observation points into the actual longitude and latitude of wild animals (Fig. 2), we must take the earth’s radius (R) of 6377.830 km and substitute it into the radian formula for the calculation. Finally, the number of Tibetan wild asses recorded during the transect survey is included in the density analysis to calculate the population density (D), which can be used to estimate the scale of Tibetan wild asses (Zheng et al., 2012; Wen et al., 2020).
$d=132\times s\times m/H$
$longb=longa+\frac{d\sin \sigma }{R\times \frac{\cos (lata)2\pi }{360}}$
$latb=lata+\frac{d\text{cos}\sigma }{R\times \frac{2\pi }{360}}$
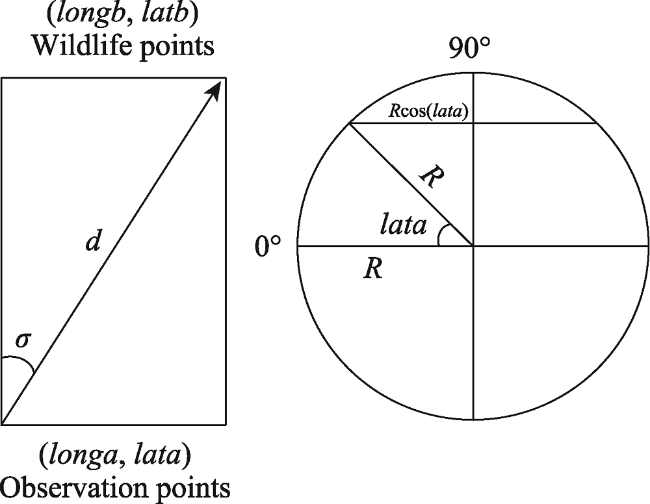
Fig. 2 Latitude and longitude conversions between wildlife points and observation points
where, d is the distance between two points a and b; s is the focal length, m is the magnification; H is the observation shoulder height; a is the location of the observation point; b is the location of the wildlife; σ is the observation angle; R is the average distance from the earth’s center to all points on the earth’s surface; longa represents the longitude of the point a; longb represents the longitude of the point b; lata represents the latitude of the point a and latb represents the latitude of the point b.
$D=\frac{n}{2\times w\times l}~$
where, n is the number of Tibetan wild asses; w is the width of the spline, and l is the length of the spline.

2.2.2 Questionnaire survey data

For three consecutive years in August of 2019-2021, we went to Gaize County to carry out a questionnaire survey on the Chang Tang Plateau wildlife. The survey method was a semi-structured interview. Before the survey, we had a discussion with the Forest and Grass Bureau of Gaize County, which allowed us to generally grasp the basic situation of each township in Gaize County, and adjust the questionnaire content and survey objects according to the actual situation. The survey respondents were the staff of the field protection monitoring station and local herdsmen. The main contents of the questionnaire were as follows: 1) Wildlife habitat preferences in Gaize County; 2) Changes of wildlife migration in Gaize County; 3) Whether wild animals in Gaize County have suffered from diseases that caused large-scale deaths; and 4) The conflict between wildlife and herdsmen in Gaize County. In the investigation over the three consecutive years, the number of Tibetan wild asses in Xianqian Township and Gumu Township were large in the accessible area, and the daily wildlife data within three years were obtained to improve the accuracy of the estimation of the population size of Tibetan wild asses in Gaize County.

2.3 Calculation of the Tibetan wild ass population and analysis

2.3.1 Prediction of the Tibetan wild ass habitat distribution

The maximum entropy MaxEnt species distribution model (Baikov et al., 2021) can accurately predict the distribution of wildlife habitats in Chang Tang Plateau (Xu et al., 2019). The model for a species is determined by a group of environmental or climatic layers (or “cover”), which refer to a group of grid elements in the landscape and a group of sample locations where the species has been observed. The model expresses the suitability of each grid cell as a function of the environmental variable values of that grid cell. A high value of this function (Fourcade et al., 2014; Wang et al., 2021a) on a specific grid cell indicates that the predicted grid cell has conditions suitable for the species. The calculation model is the probability distribution of all the grid elements. The selected distribution has the maximum entropy under some constraints, specifically its expectation for each feature (from the environmental layer) must be the same as the average value at the sample location.
Using $X\in \{{{x}_{1}},{{x}_{2}},{{x}_{3}},\cdots,{{x}_{n}}\}$ and y as discrete random variables, the probability distribution of X is $p({{x}_{i}})$, and the conditional entropy of y is as follows:
$\begin{align} & H(y\text{ }\!\!|\!\!\text{ }X)=\underset{i=1}{\overset{n}{\mathop \sum }}\,p({{x}_{i}})H(y\text{ }\!\!|\!\!\text{ }X={{x}_{i}}) \\ & \text{ }=-\underset{i=1}{\overset{n}{\mathop \sum }}\,p({{x}_{i}})p(y\text{ }\!\!|\!\!\text{ }{{x}_{i}})\text{lo}{{\text{g}}_{2}}p(y|{{x}_{i}}) \\ \end{align}$
The maximum entropy eigenvalue is the optimal solution under constraints $~f({{x}_{i}},y):$
$\underset{p\in C}{\mathop{\max }}\,H(p(y\text{ }\!\!|\!\!\text{ }x))=-\underset{i=1}{\overset{n}{\mathop \sum }}\,p({{x}_{i}})p(y\text{ }\!\!|\!\!\text{ }{{x}_{i}})\text{lo}{{\text{g}}_{2}}p(y|{{x}_{i}})$
$Subject to\underset{y}{\overset{{}}{\mathop \sum }}\,p(y\text{ }\!\!|\!\!\text{ }{{x}_{i}})=1$
where variable y in the model is the probability of species distribution, and X is a series of environmental variables, including climate, landform, vegetation, etc.

2.3.2 Prediction of the Tibetan wild ass population size

Although the maximum entropy MaxEnt model can estimate the habitat distribution of Tibetan wild asses, it is difficult to estimate the specific number and scale of the Tibetan wild ass population on a small scale. The random forest model is a self-learning data processing method developed by Breiman in 2001. It is a modern classification and regression technology. At the same time, random forest is also a combined self-learning technology (Breiman et al., 2001). The random forest model is based on the use of the classification tree algorithm to simulate and iterate, randomize the use of variables and data, generate several classification trees, and then summarize the results of the classification trees for discrimination. In the absence of data, such as the selection quality of environmental variables in Chang Tang Plateau, the random forest model is much better than the sample quality of Tibetan wild asses, and still has high accuracy (Li et al., 2013).
The random forest method mainly includes two processes (Gu et al., 2016): training and classification. There are four steps for generating the random forest (Rodriguez-Galiano et al., 2012). 1) In the training process, K sample subsets are randomly selected from the training samples by the bootstrap self-help sampling method to construct K trees. The samples not selected are used as out of bag data, with a total of K out of bag data. 2) All nodes of each tree have m returned extracted features (where M is less than the total number of features in the corresponding sample subset m). By calculating the amount of information contained in each feature, one of the M features with the gretest classification ability is selected to split the nodes. 3) Each tree grows to the maximum without pruning. 4) A random forest is formed from each tree generated. The random forest is used to classify the data that are not involved in the sampling, and the classification results are generated according to the following formula:
$H(x)=arg\underset{Y}{\mathop{\max }}\,\underset{i=1}{\overset{K}{\mathop \sum }}\,I({{h}_{i}}(x)=Y)$
where H(x) is the final classification result of the random forest; ${{h}_{i}}(x)$is the classification result of a single tree; K is the number of training rounds; Y is the output variable; and I is an indicative function.

2.3.3 Uncertainty of the population size estimation

The error in the Tibetan wild ass scale in Gaize County that is estimated based on the sample line survey and random forest model mainly comes from the error in the sample line survey, the error in the random forest model itself and the quality of the selected environmental variables. In light of these errors, this paper considers the following two points: 1) The influence of environmental factors on the number of Tibetan wild asses; 2) In order to compare the difference between the prediction results of the random forest model and the actual scale, Gumu Township, Gaize County is selected as the case for correcting the model error. The daily data from the field protection monitoring station for three years were compared with the prediction results, and the correction coefficient was calculated to correct the prediction data.

3 Results and analysis

3.1 Habitat distribution of Tibetan wild asses in Gaize County

A total of 450 distribution points of Tibetan wild asses were obtained through the field transect survey and questionnaire survey for three consecutive years from 2019 to 2021. The distribution points were screened with 1 km as the threshold (Yang et al., 2020). When the distances between multiple distribution points of Tibetan wild asses were less than 1 km, one of them was randomly retained and the rest were deleted. After data preprocessing, 332 distribution points of Tibetan wild asses were preserved for predicting the habitat distribution of Tibetan wild asses.
For predicting habitats of Tibetan wild asses, the DEM data of this study came from the radar topographic mission (SRTM) data of space shuttle Endeavour. The Euclidean distances between the distribution points of Tibetan wild asses and the river layer were calculated to reflect the distance between each grid and its nearest river. The spatial distribution dataset of vegetation index (NDVI) was from the Spot/Vegetation Proba-V 1 km products (http://www.vito-eodata.be) based on the 10-day 1 km vegetation index data, and it is formed by splicing, mosaic and projection transformation. The dataset effectively reflects the 10-day scale vegetation cover distribution and changes in Gaize County on spatial and temporal scales, and it has very important reference significance for the monitoring of vegetation changes and the study of wildlife habitats. The vegetation type data were derived from the 1:1000000 Vegetation Atlas of China. From the worldclim database (http://www.worldclim.org/), 19 bioclimatic variables of worldclim were downloaded.
The ROC curve evaluation results (Fig. 3) show that the AUC value of the training data set (75% of the Tibetan wild ass observation point data) is 0.921, the AUC value of the test data set (25% of the Tibetan wild ass observation point data) is 0.913, and the AUC value of the ten-fold cross validation is 0.911. These prediction results are very good, indicating that the predicted habitat distribution reliability for Tibetan wild asses in Gaize county is high (Sun et al., 2021). According to the analysis results of the knife cutting method (Xiong et al., 2019), the influence of rivers on Tibetan wild asses, the average temperature in the warmest season, altitude and the maximum temperature in the warmest month have the most obvious effects on the gain of the model, indicating that these environmental factors contribute greatly. In contrast, NPP, precipitation in the coldest season, precipitation in the wettest month and precipitation in the wettest season have no obvious effect on the gain of the model, indicating that these environmental factors contribute less.
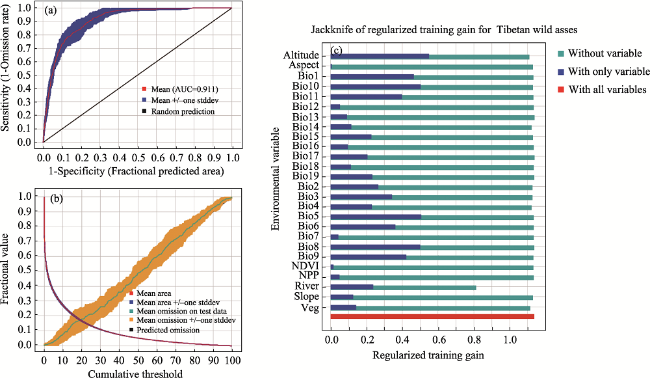
Fig. 3 Model accuracy verification (a) Average sensitivity for Tibetan wild asses; (b) Average omission and predicted area for Tibetan wild asses; (c) Test of the contribution of each environmental variable by Jackknife.
According to the predicted probability distribution map of Tibetan wild ass habitats (Fig. 4), the high probability distribution area of Tibetan wild asses, that is, where Tibetan wild ass habitats are suitable, is mainly distributed in Xianqian Township and Gumu Township.According to the analysis of the response curves of various environmental factors (Fig. 4), the suitable ranges for Tibetan wild asses are an altitude of 4400-4600 m, a distance from the river of 350-400 m, and an average temperature in the warmest season of 10-12 ℃. The vegetation types of suitable habitats are generally temperate tufted dwarf grass, dwarf semi shrub desert grassland, Alpine grass, Carex grassland, alpine cushion dwarf semi shrub desert, etc. (Bai et al., 2021).
Fig. 4 (a) Influence curve of Bio10 (i.e., mean temperature of warmest quarter), water and altitude on the distribution of Tibetan wild asses; (b) Habitat suitability rating distribution of Tibetan wild asses.

3.2 Estimation of the population size of Tibetan wild asses in Gaize County

Due to the advantages of the maximum entropy model, the impacts of individual environmental variables on the habitat distribution of Tibetan wild asses can be considered as much as possible. When estimating the population size of Tibetan wild asses, this study selected the 10 environmental variables with high contribution rates in Section 3.1 for estimating the population size of Tibetan wild asses. Due to the geographical location of Gaize County on Chang Tang Plateau and the particular characteristics of Tibetan wild ass habitats, the maximum entropy model cannot accurately estimate the population size of Tibetan wild asses. Therefore, the population size of Tibetan wild asses is estimated in this paper by using the random forest model combined with sample line survey data and the distribution range of Tibetan wild ass habitats predicted in Section 3.1.
The random forest model was used to quantify the relationship between Tibetan wild asses and the 10 selected environmental variables. Gaize County in the hinterland of Chang Tang Plateau was taken as the study area. After removing abnormal points, Gaize county was divided into 94298 background points, and the distribution points of Tibetan wild asses and the values of the 10 environmental variables of background points were extracted. The random forest model can predict the number of Tibetan wild asses according to the relationship between the existing wildlife sites and the selected environmental variables. The effectiveness of the random forest model is determined according to the determination coefficient (R) of the random forest model and the interpretation rate of each environmental factor, i.e., the %IncMSE (Percentage of increase of mean square error) and IncNodePurity (Increased node purity) values (Fig. 5).
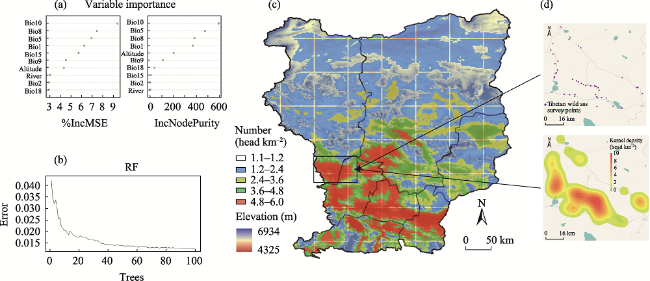
Fig. 5 (a) Ranking of the importance of environmental factors on the distribution of Tibetan wild asses; (b) Error rate curve of the random forest model; (c) Density distribution of Tibetan wild asses; (d) Survey points, survey paths and density results of Tibetan wild asses in Xianqian Township.
According to the random forest results, the order of the 10 selected environmental variables was obtained. It was not surprising to find that the average temperature of the warmest season (Bio10) still mainly affects the number of Tibetan wild asses. In this paper, the number of Tibetan wild asses calculated by the random forest was divided into five categories in order to correct the model and obtain an estimated population size of Tibetan wild asses closer to the actual number. The data in Fig. 5 showed that Tibetan wild asses preferred to inhabit relatively low altitudes. When the temperature is 10 ℃, the population scale of Tibetan wild asses is large. It is apparent that due to the limitations of field investigation for various reasons, the quantitative prediction effect in the north of Gaize County is poor, and the prediction effect in the south is good.

4 Discussion

4.1 Effects of environmental factors on the population size of Tibetan wild asses

According to the maximum entropy species distribution model and the random forest population prediction model, the influences of the selected environmental variables on the scale of the Tibetan wild ass population can be obtained. In order to further discuss the habitat preferences of Tibetan wild asses, this study substituted several environmental factors into the random forest model for the calculation, and calculated the mean decrease in the Gini value. This value represents the influence of each variable on the heterogeneity of observed values at each node of the random forest classification tree, so as to compare the importance of the environmental variables. The greater the value, the greater the influence of an environmental factor on Tibetan wild asses. According to the same method in Sections 3.1 and 3.2, the top 11 environmental variables were iterated 14 times, and an importance score was obtained in each iteration to determine which environmental variables are important for predicting the number of Tibetan wild asses. At the same time, the iterative results can also calculate the mean, median and maximum values of the environmental variables.
Through the cross validation of Mean decrease gini and Boruta algorithm (Fig. 6), the importance ranking of factors affecting the number of Tibetan wild asses and the importance scores (0-20 points) of each factor including mean value, maximum value and minimum value can be obtained.The results of this cross-validation showed that the number of Tibetan wild asses was affected by altitude and slope. The number of Tibetan wild asses was higher in the positions with relatively low altitude and gentle slope, but lower in the positions with a large slope and high altitude. Tibetan wild asses tend to choose areas with a warm climate and a small temperature difference between day and night. Also, Tibetan wild asses have a high distribution density near places with rich water sources and sufficient food.
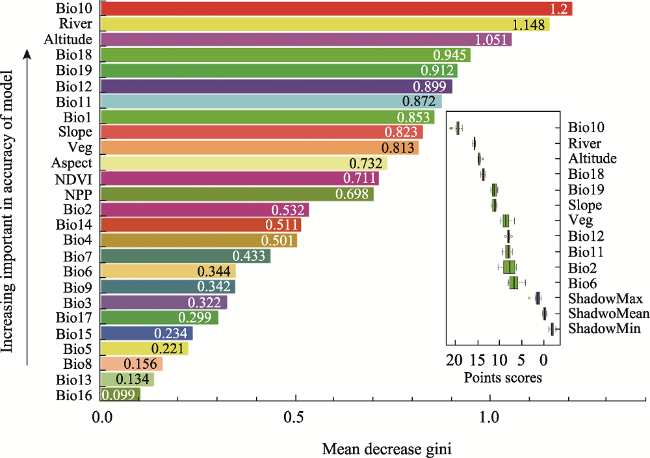
Fig. 6 Cross validation results of environmental factors affecting the population size and the number of Tibetan wild asses

4.2 Uncertainty analysis of population size estimation

In Section 3.1, the maximum entropy model was used to calculate the habitat distribution of Tibetan wild asses in Gaize County. The maximum entropy statistical model obtains the model with maximum information entropy among all the models that meet the constraints. As a classical classification model, it has high accuracy. Formally, the advantages of the maximum entropy model lead to the inevitable errors of the maximum entropy model. The maximum entropy model requires a large number of environmental factors and the calculation process takes a long time. The environmental variable factors selected in this paper are insufficient, and other environmental factors affecting the distribution of Tibetan wild asses may be omitted. In order to improve the accuracy of the model calculation results, it would be necessary to explore more environmental factors that affect the distribution of Tibetan wild asses.
In Section 3.2, the random forest model was used to estimate the number of Tibetan wild asses in Chang Tang Plateau and calculate the population densities in various local areas. The results (Fig. 5) can better reflect the heterogeneity of the spatial distribution of Tibetan wild asses in Gaize County, although the overall number of Tibetan wild asses in each area of Gaize County can be counted. However, the predicted quantities obtained by the model must have errors relative to the actual quantities. The random forest does not perform as well in solving regression problems as it does in classification because it cannot give a continuous output. When regression is carried out, the random forest cannot make predictions beyond the data range of the training set, which may lead to over-fitting when some data with specific noise are modeled. So, the uncertainty of the model is discussed, and the model was corrected to reduce the error in predicting the number of Tibetan wild asses.
The main data for estimating the scale of Tibetan wild asses in Gaize County of Chang Tang Plateau came from the sample line survey of our research group in the Second Scientific Survey of Qinghai-Tibet Plateau. Due to the limitations of scientific research security, the research group could not go deep into the northern part of Gaize County. As a result, the survey sample line was mainly distributed in the southern part of Gaize County, which makes the prediction effect in the southern region obviously more accurate than that in the north. In the next scientific survey, our research group will pay more attention to the spatial uniformity of the spline distribution, so as to make the model results more accurate.
The second reason for the error in the Tibetan wild ass prediction results is the error caused by the random forest model itself. One method to reduce this error is to use the MaxEnt maximum entropy model to consider as many environmental variables as possible, and spatially divide the areas where Tibetan wild asses appear in Gaize County with high probability, medium probability, low probability and very low probability. When calculating the random forest model, the environmental factors with low contribution rates and the areas with a very low probability of Tibetan wild asses are excluded, so as to reduce the error of the model. In order to further reduce the error of the random forest model itself, Gumu Township, Gaize County was selected as the case study for the model correction. The daily data of the field protection monitoring station for three years were compared with the prediction results, the correction coefficient of Gumu Township was calculated, and the correction coefficient was then used to correct the number of Tibetan wild asses in the other areas of Gaize County. Finally, the approximate number of Tibetan wild asses (Table 2) in the different townships of Gaize County of Chang Tang Plateau were obtained.
Table 1 Environmental variables and their descriptions and units
Variable abbreviation Description Unit Primary resolution
Altitude Altitude m 90 m
Aspect Aspect ° 90 m
Slope Slope ° 90 m
River Distance to river m Euclidean distance
NDVI NDVI - 1 km
NPP Net primary productivity gC m-2 1 km
Veg Vegetation type - 1 km
Bio1 Annual mean temperature 1 km
Bio2 Mean diurnal range 1 km
Bio3 Isothermality Ratio 1 km
Bio4 Temperature seasonality Standard deviation 1 km
Bio5 Max temperature of warmest month 1 km
Bio6 Min temperature of coldest month 1 km
Bio7 Temperature annual range 1 km
Bio8 Mean temperature of wettest quarter 1 km
Bio9 Mean temperature of driest quarter 1 km
Bio10 Mean temperature of warmest quarter 1 km
Bio11 Mean temperature of coldest quarter 1 km
Bio12 Annual precipitation mm 1 km
Bio13 Precipitation of wettest month mm 1 km
Bio14 Precipitation of driest month mm 1 km
Bio15 Precipitation seasonality Coefficient of variation 1 km
Bio16 Precipitation of wettest quarter mm 1 km
Bio17 Precipitation of driest quarter mm 1 km
Bio18 Precipitation of warmest quarter mm 1 km
Bio19 Precipitation of coldest quarter mm 1 km
Table 2 The corrected number of Tibetan wild asses by township (Unit: head)
Township High probability Medium
probability
Low
probability
Total number
Xianqian Township 784 1407 1267 3458
Chabu Township 538 408 507 1453
Gumu Township 142 1842 374 2358
Wuma Township 876 50 17 943
Mami Township 582 98 63 743
DongcuoTownship 446 148 53 647
Gaize Township 642 192 21 855

5 Conclusions

In this paper, the maximum entropy model was used to analyze the living environment factors and habitat selection preferences of Tibetan wild asses. This analysis found that Tibetan wild asses preferred to live in areas with an altitude of 4500 m, a relatively low slope, warm climate and close to the river. After determining the environmental factors which affect the Tibetan wild ass habitat selection, the quantitative relationship between the number of Tibetan wild asses and environmental factors was constructed by using a random forest model. Based on the corrected versions of the sample line survey data and habitat distribution data, the number of Tibetan wild asses in Gaize County of Chang Tang Plateau was estimated more accurately.
With the increasing trend of temperatures in Chang Tang Plateau in recent years, the population size of Tibetan wild asses, which likes sufficient hydrothermal conditions, is also expanding. The expansion of the Tibetan wild ass population has caused great pressure on the scarce grassland resources of Chang Tang Plateau, and the human-animal conflict is also increasing in strength. According to the trends of environmental factor changes, the distribution and quantity of Tibetan wild asses can be predicted. These predicted results can guide local governments in formulating wildlife protection and grazing policies to alleviate the grassland pressure on Chang Tang Plateau and solve the growing problem of human-animal conflict.
[1]
Bai Y L, Li Y H, Zheng W C, et al. 2021. Habitat suitability assessment of Rhinopithecus roxellana in Tangjiahe National Reserve. Acta Ecologica Sinica, 41(11): 4460-4468. (in Chinese)

[2]
Baikov K S, Krivenko D A, Murtazaliev R A, et al. 2021. Spatial monitoring of the modern environmental situation in localities of Vavilovia formosa (Fabaceae) based on predictive climatic modeling. Contemporary Problems of Ecology, 14(2): 182-192.

DOI

[3]
Breiman L. 2001. Random forests. Machine Learning, 45(1): 5-32.

DOI

[4]
Du J, Niu X J, Yuan L, et al. 2020. Climate and environmental features in Chang Tang National Nature Reserve during 1971-2017. Journal of Glaciology and Geocryology, 42(3): 1017-1026. (in Chinese)

[5]
Fourcade Y, Engler J O, Rödder D, et al. 2014. Mapping species distributions with MAXENT using a geographically biased sample of presence data: A performance assessment of methods for correcting sampling bias. Plos One, 9(5): e97122. DOI: 10.1371/journal.pone.0097122.

DOI

[6]
Gu H Y, Yan L, Li H T, et al. 2016. An object-based automatic interpretation method for geographic features based on random forest machine learning. Geomatics and Information Science of Wuhan University, 41(2): 228-234. (in Chinese)

[7]
Guo Y, Gan F P, Yan B K, et al. 2021. Hydrochemical characteristics and controlling factors of lakes in the southern Qiangtang Plateau. Journal of Hebei GEO University, 44(4): 74-82. (in Chinese)

[8]
Jin Y, Zhou K X, Gao J X, et al. 2016. Identification the priority conversation areas for key national protected terrestrial vertebrate species based on a random forest model in China. Acta Ecologica Sinica, 36(23): 7702-7712. (in Chinese)

[9]
Li X H. 2013. Using “random forest” for classification and regression. Chinese Journal of Applied Entomology, 50(4): 1190-1197. (in Chinese)

[10]
Lin Z Y, Wu X D. 1990. A preliminary analysis about the tracks of moisture transportation on the Qinghai-Xizang Plateau. Geographical Research, 9(3): 33-40. (in Chinese)

[11]
Liu Y D, Cui R X. 2015. Segmentation of winter wheat canopy image based on visual spectral and random forest algorithm. Spectroscopy and Spectral Analysis, 35(12): 3480-3484. (in Chinese)

[12]
Lu F Y, Shi J F, Zhang Z H, et al. 2015. Surveys of Tibetan antelope, kiang and wild yak in Arjinshan Nature Reserve, Xinjiang, China. Journal of Beijing Normal University (Natural Science), 51(4): 374-381. (in Chinese)

[13]
Luo B Q, Yi X D J, Suo L J B, et al. 2021. Achievements and development suggestions of grassland Tibetan sheep breeding in Gaize County. Modern Animal Husbandry Science & Technology, (9): 29-30. (in Chinese)

[14]
Rodriguez-Galiano V F, Ghimire B, Rogan J, et al. 2012. An assessment of the effectiveness of a random forest classifier for land-cover classification. ISPRS Journal of Photogrammetry and Remote Sensing, 67: 93-104.

[15]
Shang Z D, Kong Q H, Tan Z K, et al. 2021. Comparative study on fecal fungal diversity between Tibetan antelope and Tibetan wild ass. Mycosystema, 40(7): 1605-1616. (in Chinese)

[16]
Sun X Y, Li W B, Wu Q M, et al. 2021. Habitat suitability assessment and habitat selection of the Grey heron (Ardea cinera) during autumn in Songnen Plain, China. Acta Ecologica Sinica, 41(7): 2877-2885. (in Chinese)

[17]
Sun X Y, Zhang L T, Zhang Y, et al. 2020. Evaluation of line transect sampling method in vegetation survey of north rock island: Take North Changshan Island for example. Ocean Development and Management, 37(9): 62-68. (in Chinese)

[18]
Wang J, Zhang Y P, Sun Q W, et al. 2021a. Study on the growth suitability of Bletilla ochracea based on ArcGIS and Maxent Model. Chinese Wild Plant Resources, 40(9): 86-90. (in Chinese)

[19]
Wang Y, Guan L, Du L X, et al. 2021b. Overlapping barrier and avoidance effects of the Qinghai-Tibet highway and railway on four typical ungulates on the Tibetan Plateau. Chinese Journal of Ecology, 40(4): 1091-1097. (in Chinese)

[20]
Wei Z Q, Xu Z R. 2019. Habitat distribution of Tibetan antelope in the Chang Tang Plateau and influential factors. Acta Ecologica Sinica, 40(23): 8763-8772. (in Chinese)

[21]
Wen X, Yan Y, He M X, et al. 2020. A Survey on the population densities of three galliformes species by using two different methods in the Heizhugou National Nature Reserve, Sichuan. Sichuan Journal of Zoology, 39(1): 68-74. (in Chinese)

[22]
Wu F M, Zhu W W, Wu B, et al. 2019. Method of automatic counting of large herbivores from UAV images in the source region of Three Rivers. Acta Theriologica Sinica, 39(4): 450-457. (in Chinese)

[23]
Wu Z Y, Du Y B, Xu G, et al. 2020. Spatial distribution and suitability analysis of Equus kiang along G219 national road—Case study of road section from Zhongba to GaEr. Journal of Tianjin Normal University (Natural Science), 40(3): 18-21, 47. (in Chinese)

[24]
Xiong G J, Xiong Q. 2004. Comparative research of several kinds of methods on density estimate for biological population by line transect sampling. Journal of Nanchang Normal University, 25(6): 6-9. (in Chinese)

[25]
Xiong Z R, Zhang X C, Zou X, et al. 2019. Prediction of the suitable distribution and responses to climate change of Sorbus tianschanica in China. Ecological Science, 38(5): 44-51. (in Chinese)

[26]
Xu T W, Wang X G, Zhao X Q, et al. 2020. Standing herbage nutrition characters and herbivore carrying capacities of typical alpine grasslands in Sanjiangyuan National Park during cold season. Chinese Science Bulletin, 65(32): 3610-3618. (in Chinese)

[27]
Xu Z R, Jin M M, Zheng X, et al. 2019. Causes for human-wildlife conflict on Changtang Plateau in Tibet. Journal of Natural Resources, 34(7): 1521-1530. (in Chinese)

DOI

[28]
Yang B, Zhang Q J, Wang B, et al. 2020. The habitat suitability evaluation of Salweenia bouffordiana based on MaxEnt model. Acta Ecologica Sinica, 40(17): 6077-6085. (in Chinese)

[29]
Zhang X W, He H, Wang K. 2020. Application of variable distance transect method in forest bird investigation of hilly unit along the coast of Zhejiang and Fujian. East China Forest Management, 34(2): 31-34. (in Chinese)

[30]
Zhang Z H, Yan L, Liu S Y, et al. 2021. Leaf nitrogen concentration retrieval based on polarization reflectance model and random forest regression. Spectroscopy and Spectral Analysis, 41(9): 2911-2917. (in Chinese)

[31]
Zhao G S, Liu M, Shi P L, et al. 2020. Variation of leaf and root traits and ecological adaptive strategies along a precipitation gradient on Changtang Plateau. Acta Ecologica Sinica, 40(1): 295-309. (in Chinese)

[32]
Zheng D, Li B Y. 1990. Evolution and differentiation of the physico-geographical environment of Qinghai-Xizang Plateau. Geographical Research, 9(2): 1-10. (in Chinese)

DOI

[33]
Zheng W, Ge C, Li Z Q, et al. 2012. Preliminary exploration of methods for bird population density survey and estimation. Sichuan Journal of Zoology, 31(1): 84-88. (in Chinese)

[34]
Zhu G H, Li N, Wang Y, et al. 2019a. Monitoring wildlife traffic channel and effectiveness evaluation based on the technology of infrared camera. Journal of China & Foreign Highway, 39(2): 313-315. (in Chinese)

[35]
Zhu Y B, Ping C Z D, Luo S D Z, et al. 2019b. Population genetic diversity assessment of local yak and semi-wild yak in Gaize County based on MHC genetic. Modern Agricultural Science and Technology, (21): 209-211. (in Chinese)

Outlines

/