
Journal of Resources and Ecology >
Analysis of Food Consumption and Its Characteristics in Uzbekistan based on the Emergy Method
|
JIA Mengmeng, E-mail: Jiamm.19b@igsnrr.ac.cn |
Received date: 2021-11-01
Accepted date: 2022-04-20
Online published: 2022-07-15
Supported by
The Strategic Priority Research Program of Chinese Academy of Sciences(XDA20010202)
Food resources play a great role in human livelihood, so it is meaningful to investigate their utilization and structural evolution, especially in developing countries. This study takes data from FAOSTAT and the World Bank, and applies the emergy method to analyze Uzbek food consumption changes and characteristics from 1992 to 2019. Two main results were obtained: (1) National food consumption showed a persistent increase and had a remarkable change in stages, with the first stage of low-level repetition, the second stage of speeding up and the third stage of high development. The increase of animal-based food consumption was more notable than that of plant-based food consumption. (2) Per capita annual food consumption had a tendency of change that was similar to that of national food consumption. The proportion of animal-based food in the total per capita annual food consumption usually remained about 2-fold higher than that of plant-based food consumption. The main food consumption pattern was the combination of crops such as wheat and rice with meat such as beef. The fruit and vegetable consumption also increased. With the growing population, various changes in food demand will inevitably happen, so it is necessary to take sustainable measures in time to satisfy the new demand and to protect resources and the environment.
Key words: food consumption; emergy method; Uzbekistan
JIA Mengmeng , ZHEN Lin , ZHANG Changshun . Analysis of Food Consumption and Its Characteristics in Uzbekistan based on the Emergy Method[J]. Journal of Resources and Ecology, 2022 , 13(5) : 842 -850 . DOI: 10.5814/j.issn.1674-764x.2022.05.008
Table 1 Conversion rates of different food items |
| Number | Food item | Energy conversion rate (J kg-1) | Emergy transformity (sej J-1) |
|---|---|---|---|
| 1 | Wheat | 1.57×10⁷ | 6.80×10⁴ |
| 2 | Rice | 1.55×10⁷ | 3.95×10⁴ |
| 3 | Barley | 1.60×10⁷ | 8.00×10⁴ |
| 4 | Maize | 1.65×10⁷ | 2.07×10⁴ |
| 5 | Oilseeds | 2.55×10⁷ | 6.90×10⁵ |
| 6 | Nuts | 2.59×10⁷ | 6.90×10⁵ |
| 7 | Fruits | 3.30×10⁶ | 5.30×10⁵ |
| 8 | Vegetables | 2.51×10⁶ | 2.70×10⁴ |
| 9 | Sugar | 2.50×10⁶ | 8.50×10⁴ |
| 10 | Egg | 8.30×10⁶ | 2.00×10⁶ |
| 11 | Chicken | 5.40×10⁶ | 2.00×10⁶ |
| 12 | Pork | 2.00×10⁷ | 1.70×10⁶ |
| 13 | Beef | 8.76×10⁶ | 3.17×10⁶ |
| 14 | Mutton | 1.41×10⁷ | 2.00×10⁶ |
| 15 | Milk | 2.90×10⁶ | 1.71×10⁶ |
| 16 | Fish | 5.40×10⁹ | 2.00×10⁶ |
Note: Data from Li et al. (2019). |
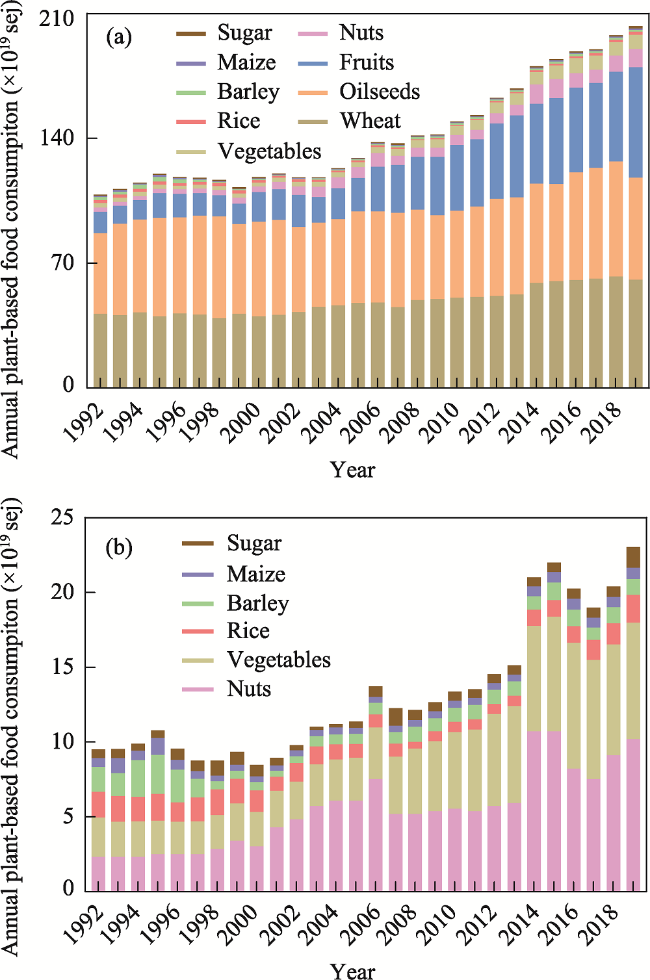
Fig. 3 Per capita annual food consumption |
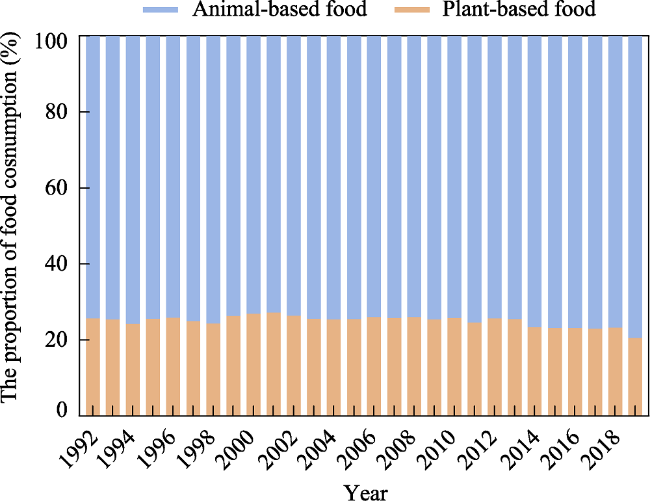
Fig. 4 Proportions of plant-based and animal-based food consumption |
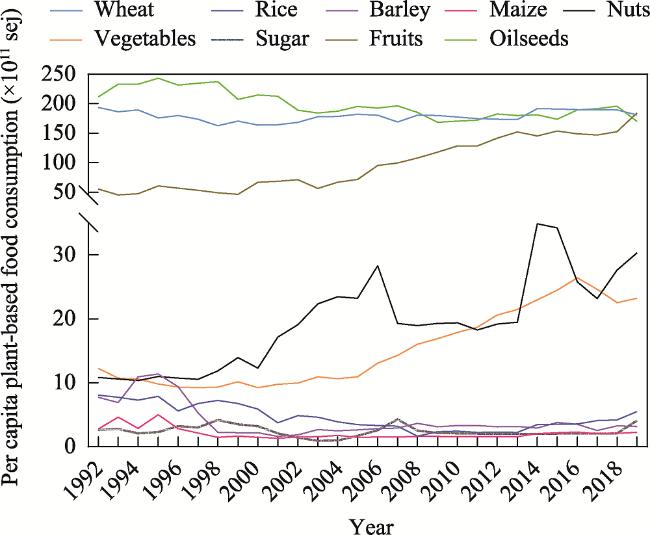
Fig. 5 Per capita plant-based food consumption |
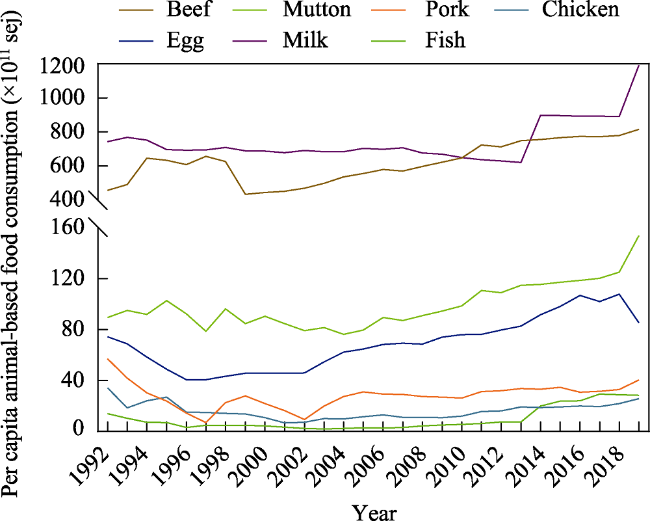
Fig. 6 Per capita animal-based food consumption |
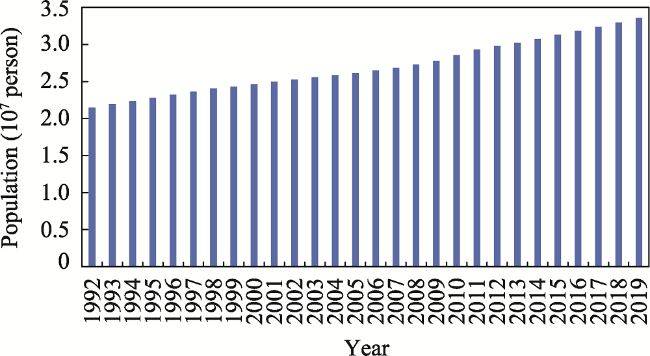
Fig. A1 Population of Uzbekistan from 1992 to 2019 |
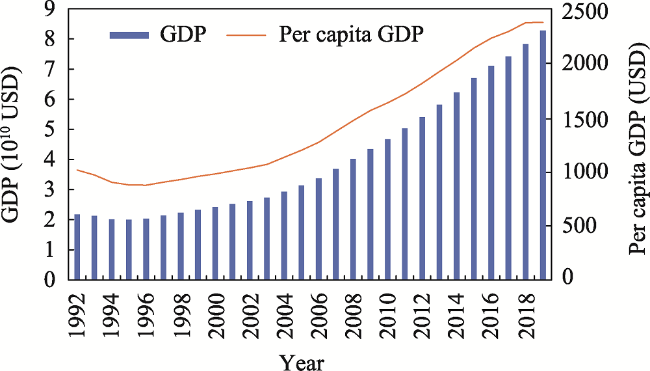
Fig. A2 GDP and per capita GDP of Uzbekistan from 1992 to 2019 |
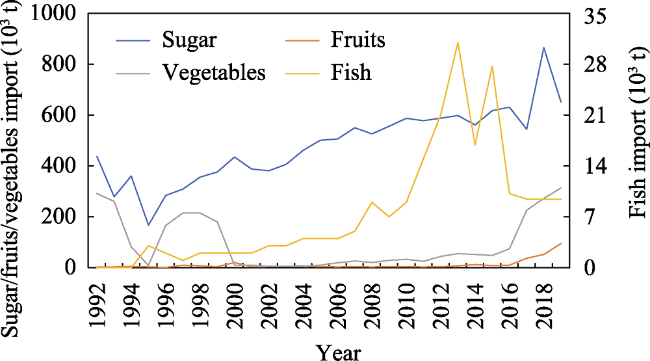
Fig. A3 Main types of food imports in Uzbekistan from 1992 to 2019 |
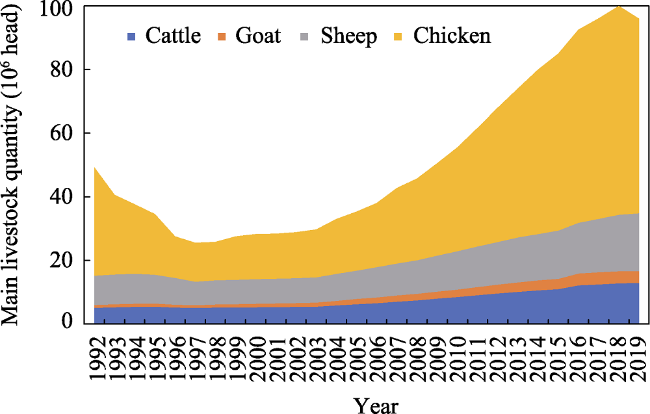
Fig. A4 Population of Uzbekistan from 1992 to 2019 |
Fig. A5 Population of Uzbekistan from 1992 to 2019 |
| [1] |
|
| [2] |
|
| [3] |
|
| [4] |
|
| [5] |
|
| [6] |
|
| [7] |
|
| [8] |
|
| [9] |
|
| [10] |
|
| [11] |
|
| [12] |
|
| [13] |
|
| [14] |
|
| [15] |
|
| [16] |
|
| [17] |
|
| [18] |
|
| [19] |
|
| [20] |
|
| [21] |
|
| [22] |
|
| [23] |
|
| [24] |
|
| [25] |
|
| [26] |
|
| [27] |
|
| [28] |
|
| [29] |
|
| [30] |
|
| [31] |
|
| [32] |
|
| [33] |
|
| [34] |
|
| [35] |
|
| [36] |
|
| [37] |
|
| [38] |
|
| [39] |
|
| [40] |
|
| [41] |
|
| [42] |
|
| [43] |
|
| [44] |
|
| [45] |
|
| [46] |
|
| [47] |
|
/
| 〈 |
|
〉 |

