
Journal of Resources and Ecology >
SAR-based Subsidence Monitoring and Assessment of the Factors Involved in the Occurrence of Subsidence, Lahore City
|
Atif AHMAD, E-mail: atif@aircas.ac.cn |
Received date: 2021-06-07
Accepted date: 2022-01-29
Online published: 2022-07-15
Supported by
The National Natural Science Foundation of China(41930110)
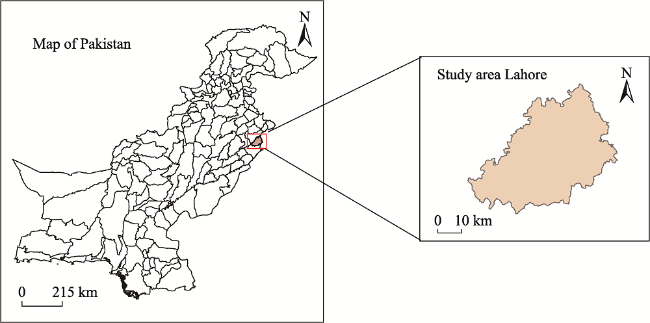
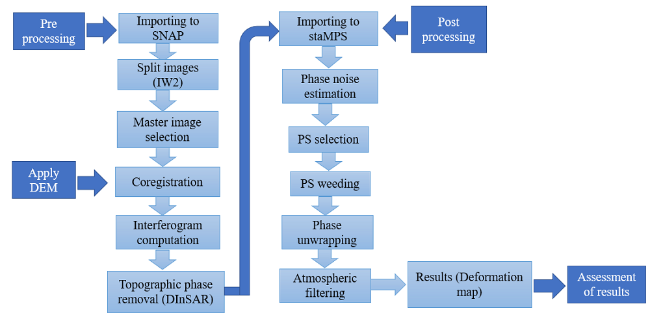
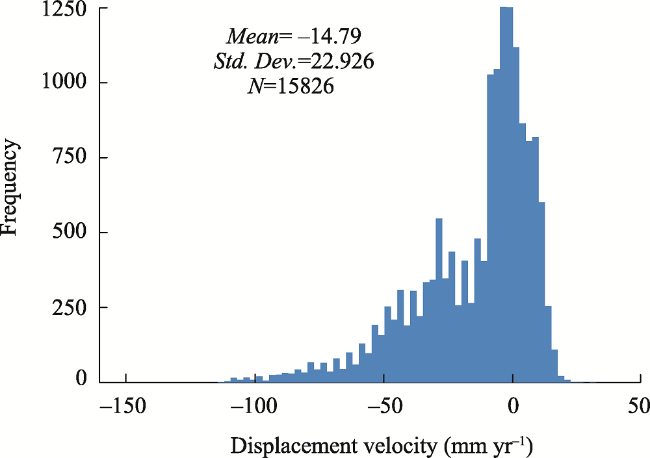
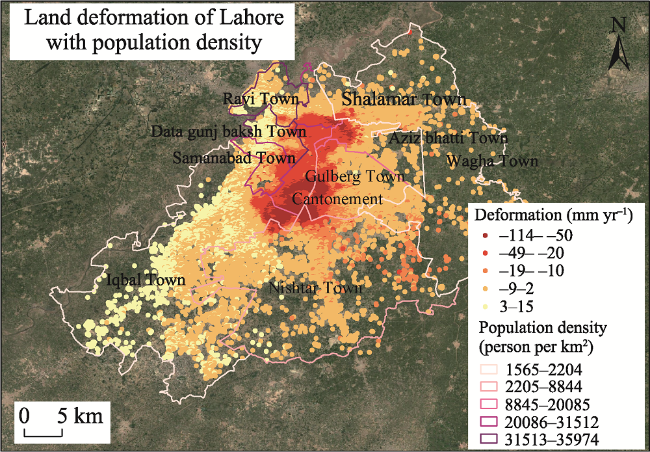
The judicious use and management of natural resources is vital to achieve sustainable development. Land and water are prime natural resources, and their depletion and degradation can lead to serious threats like land subsidence. Land subsidence is a phenomenon of the alteration of elevation at a point on the earth through the sinking of the surface. It occurs when the earth’s surface loses its support. The major causes of land subsidence include groundwater extraction, mining, construction overload, and other similar factors that increase pressure on the surface and eventually subsidize the land. Urban centers with excessive groundwater extraction and infrastructure development are at a high risk of subsidence. Lahore, the second-largest city in Pakistan, is undergoing an enormous increase in population density, uncontrolled urbanization with very large-scale construction projects, and intensive groundwater extraction which are responsible for subsidence directly or indirectly. Therefore, studies on groundwater status and unplanned urban appraisals have seriously urged monitoring of the subsidence in Lahore. Herein, we used freely available Sentinel-1 data for one year (from August 2018 to August 2019), with a high spatial and temporal resolution, to monitor subsidence in Lahore. The data were processed using the SNAP/StaMPS approach for Persistent Scatterer Interferometric Synthetic Aperture Radar (PSI) analysis, which is an advanced InSAR technique. The displacement velocity map from InSAR processing shows a significant land deformation in the area with values ranging from -114 to 15 mm yr-1. Along with the Sentinel-1 data, we also used supplementary data obtained from various government agencies of Pakistan to study the land cover map, transportation network and waterways of Lahore, soil types, population density, and field points for assessing the results and understanding the roles of various factors in the occurrence of uplift or subsidence. A strong correlation was established between subsidence and various parameters such as groundwater extraction and lowering of the water table, soil type variations, land cover changes, surface water channels, and population density. The deformation map confirms the greatest subsidence in the central part of Lahore, while the uplift is observed in the less populated and rural areas situated near Ravi River. The land subsidence and uplift could be attributed to groundwater extraction and recharge through the canal system and the river, respectively.
Key words: Sentinel-1; subsidence; PSI; groundwater extraction; urbanization; Lahore
Atif AHMAD , WANG Chao , TANG Yixian , Mubbashra SULTAN , Attia FALAK , DUAN Wei , WANG Jing . SAR-based Subsidence Monitoring and Assessment of the Factors Involved in the Occurrence of Subsidence, Lahore City[J]. Journal of Resources and Ecology, 2022 , 13(5) : 826 -841 . DOI: 10.5814/j.issn.1674-764x.2022.05.007
Fig. 1 The map of Pakistan and geographical location of Lahore |
Table 1 The features of Sentinel-1 data |
| Mission name (Agency) | Start-end date | Free | Frequency | Repeat cycle | Incidence angle | Resolution | Orbit direction |
|---|---|---|---|---|---|---|---|
| Sentinel-1 | Aug., 2018 to Aug., 2019 | Yes | C-Band | 12 days | 33.725 °-43.875° | 20 m | Ascending orbit |
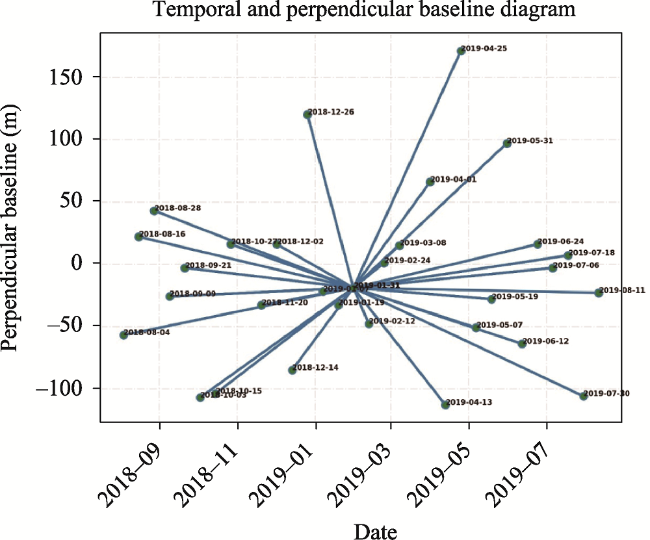
Fig. 2 Master-slave configuration for land subsidence in LahoreNote: The dots represent each image and lines show the interferograms formed by the master image in the center and the other image. |
Fig. 3 Flow chart representing the SNAP and StaMPS processing steps |
Fig. 4 Histogram of subsidence points |
Table 2 The ancillary data and its sources |
| Data type | Source |
|---|---|
| Tube well locations & water level data | Water & Sanitation Agency (WASA) |
| Landsat 8 imagery | United States Geological Survey (USGS) |
| Soil type map | Geological Survey of Pakistan (GSP) |
| Water channels & transportation network data | Local authorities |
| Field survey points and pictures | Field survey |
Table 3 The details of the software used to process data |
| Software | SNAP | StaMPS | Python IDLE | ERDAS- IMAGINE | Q-GIS/ArcGIS | SPSS |
|---|---|---|---|---|---|---|
| Purpose of use | Pre-processing (Coregistration to DInSAR) | Post processing (PSI analysis) | Baseline (Perpendicular & temporal image) | Satellite image classification | Mapping of results | Statistical data representation (Regression analysis) |
Fig. 5 Map showing the land deformation and population density of Lahore |
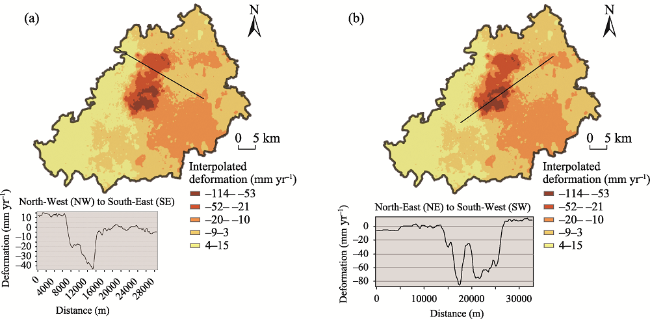
Fig. 6 Spatial profile of the interpolated displacement map (a) from the north-west (NW) to south-east (SE) and (b) from north-east (NE) to south-west (SW) |
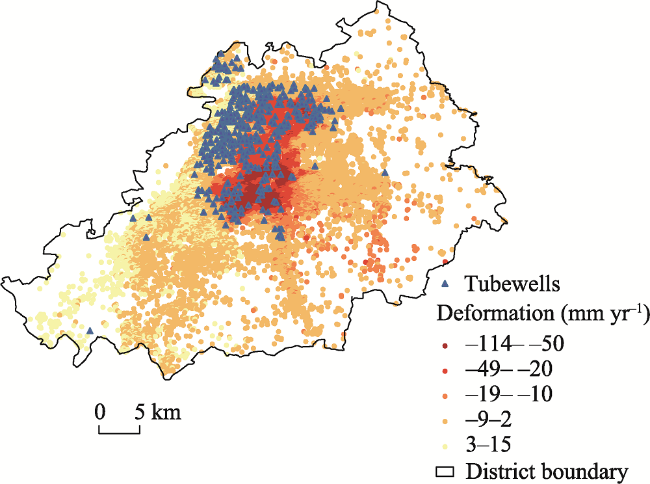
Fig. 7 Map of the locations of tube wells installed by WASA |
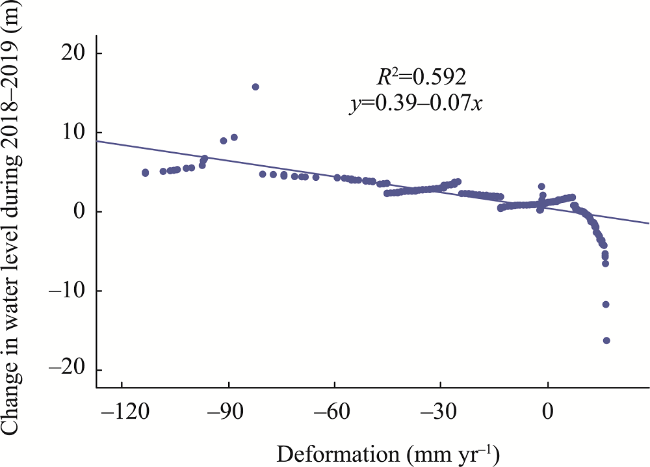
Fig. 8 Scatter plot of land deformation and changes in water level from 2018 to 2019 |
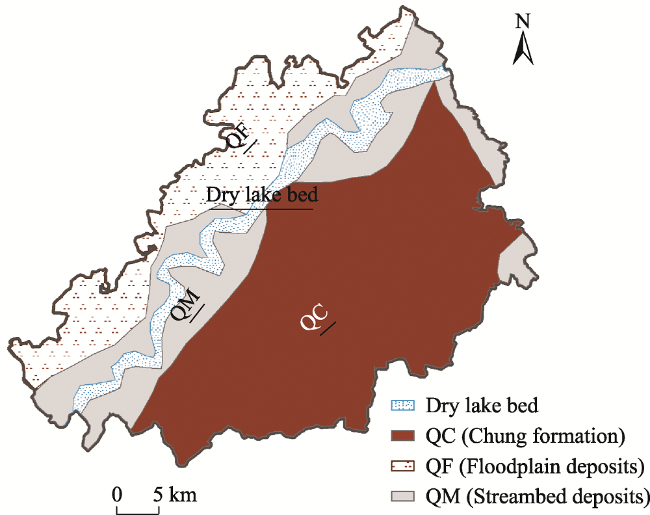
Fig. 9 The soil type map of LahoreNote: QC refers to the Chung formation, composed of loess deposits of the upper terrace, while QM refers to the meander belt flood plain and QF refers to floodplain deposits. |
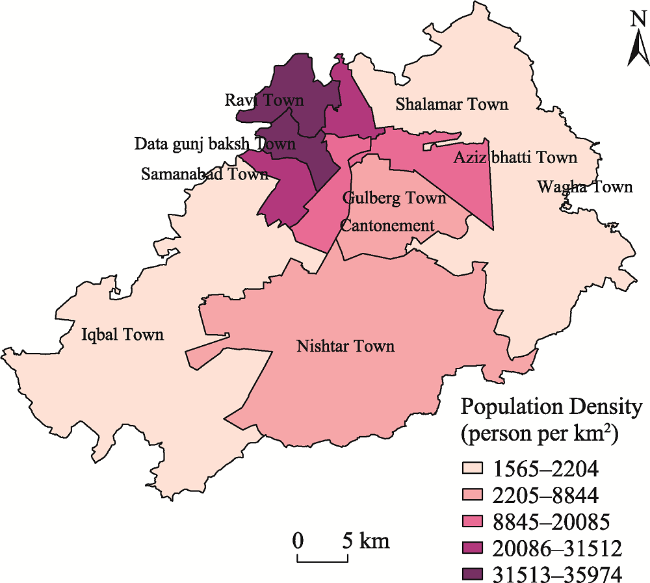
Fig. 10 The population density map of Lahore |
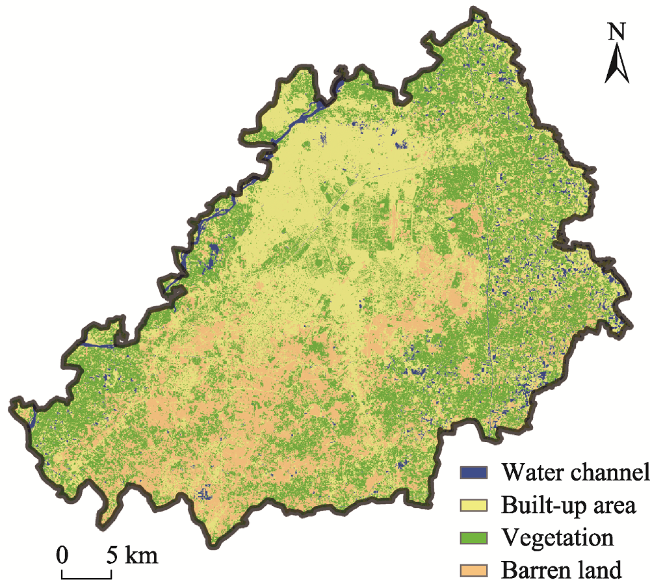
Fig. 11 The land cover map of Lahore |
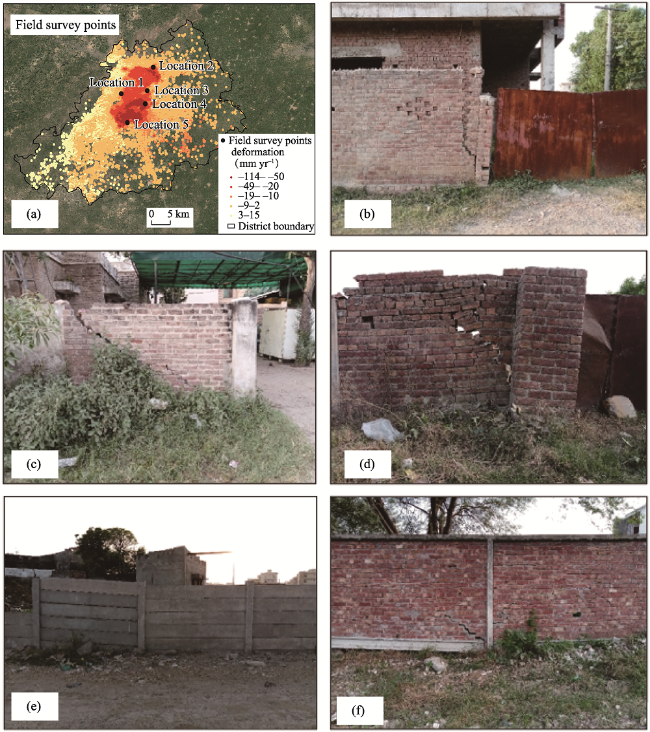
Fig. 12 (a) Field survey points on the map of Lahore district; (b-f) actual photographs of structures or buildings damaged by subsidence. |
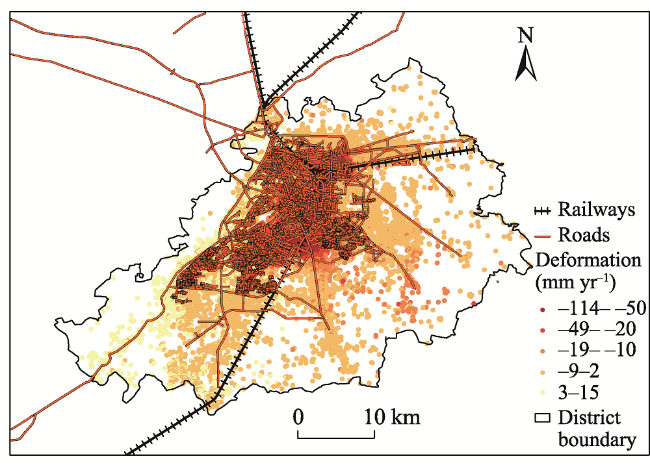
Fig. 13 The transportation network map of Lahore |
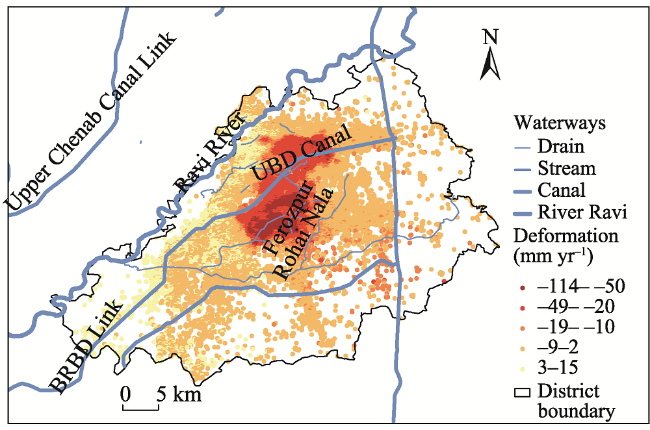
Fig. 14 Map highlighting the waterways in Lahore |
Table 4 Groundwater balance of Lahore |
| Components of recharge | Recharge (106 m3 yr-1) | Components of discharge | Discharge (106 m3 yr-1) |
|---|---|---|---|
| Precipitation | 138 | Domestic use | 1384 |
| Agricultural runoff | 150 | Industrial use | 335 |
| Irrigation network | 146 | Commercial use | 277 |
| Ravi River | 1937 | Agriculture | 623 |
| Total recharge | 2371 | Total discharge | 2619 |
Note: Source: World Wildlife Fund (WWF) for nature Pakistan (Qureshi and Sayed, 2014). |
The authors are grateful to the Aerospace Information Research Institute, Chinese Academy of Sciences. The authors would like to thank ESA and EU Copernicus Program for providing the PSI-1A SAR data; NASA and CGIAR-CSI for providing SRTM DEM data; and GMTSAR, SNAP, and GIAnT toolbox for providing the InSAR and Time-series analysis tools.
| [1] |
|
| [2] |
|
| [3] |
|
| [4] |
|
| [5] |
|
| [6] |
|
| [7] |
|
| [8] |
|
| [9] |
|
| [10] |
|
| [11] |
Dawn. 2020. Naya Pakistan Apartments PC-I finalised. https://www.dawn.com/news/1574148/naya-pakistan-apartments-pc-i-finalised
|
| [12] |
|
| [13] |
|
| [14] |
|
| [15] |
|
| [16] |
|
| [17] |
|
| [18] |
|
| [19] |
|
| [20] |
|
| [21] |
|
| [22] |
|
| [23] |
|
| [24] |
|
| [25] |
|
| [26] |
|
| [27] |
|
| [28] |
|
| [29] |
|
| [30] |
|
| [31] |
|
| [32] |
|
| [33] |
|
| [34] |
|
| [35] |
|
| [36] |
|
| [37] |
|
| [38] |
|
| [39] |
|
| [40] |
|
| [41] |
|
| [42] |
|
| [43] |
|
| [44] |
|
| [45] |
|
| [46] |
|
| [47] |
|
| [48] |
|
| [49] |
United Nations. 2015. Sustainable developmemt goals. https://www.un.org/sustainabledevelopment/cities
|
| [50] |
|
| [51] |
|
| [52] |
|
| [53] |
|
| [54] |
|
| [55] |
|
/
| 〈 |
|
〉 |